
Abstract
In this article, attempts are made to study the aerodynamic performance of co-axial rotors with different rotor spacings in hover. A custom-designed experimental platform with seven rotor spacings (z/D = 0.16, 0.19, 0.23, 0.26, 0.29, 0.33 and 0.38) is applied to measure the hover performance, i.e. co-axial thrust and power consumption, and to optimize the aerodynamic configuration of the co-axial system. The experimental errors in thrust coefficient, power coefficient and power loading calculated through ‘Kline-McClintock equation’ are less than 2%. Additionally, the streamline distribution and pressure of blade tip at different rotor spacings obtained from numerical simulations are presented to visualize the effects of aerodynamic interference between the top and bottom rotor. Results show that the aerodynamic performance of a co-axial rotor with the specific rotor configure and speed range can be indeed improved by changing the rotor spacing, and the optimal performance is obtained with a rotor spacing of 0.19. Also, the magnitude of aerodynamic interference related to the axial separation distance has demonstrated to be beneficial on the total thrust and power consumption. For the same disc loading, a decrease in rotational speed results in an increase in power loading especially for z/D = 0.19. It is also found that the bottom rotor does affect the performance of the top rotor at smaller rotor spacings, whereas the effect is significantly reduced as the rotor spacing increases.
Introduction
Micro air vehicles (MAVs) with multi-rotary-wing configuration are envisioned to have a wide range of both military and civilian applications, due to their ability in hover and low-speed flight.1–4 To maintain the moment of equilibrium of the rotor system in hover, the conventional configuration uses a tail rotor which consumes an additional 5%–10% of the total power and increases possibilities to cause accidents. 5 By contrast, for a contra-rotating co-axial rotor, no extra power is consumed, and without any redundancy, devices make the co-axial rotors more compact. 6 However, the interference between the top and bottom rotors makes the flow field more complicated and affects the co-axial rotor’s performance, such as hover efficiency concerning the co-axial thrust and power consumption.7–11 Accordingly, the rotor spacing, as one of the most important design parameters in the co-axial rotors, should be designed to reduce the aerodynamic interference and avoid blade collisions. In addition, the low Reynolds number (Re < 105) environment that the co-axial rotor operates in is critical for the aerodynamic performance of the rotor system which is also essential to be addressed.
Few studies have systematically investigated the rotor spacing of co-axial rotors. Ramasamy 12 found that the lower rotor produces more thrust as the axial separation distance decreases and the overall performance of the co-axial rotor was independent of the axial separation distance when z/D > 0.15 (where z is the axial separation distance and D is the rotor diameter). Bohorquez 13 performed experiments on the micro co-axial rotor with an R of 172 mm and found that the top rotor was affected by the bottom rotor when the spacing is larger than 0.35 R. Syal 14 conducted series of tests on the Harrington rotor (R = 3.81 m) based on the momentum theory and tried to optimize the co-axial rotor system. She also found that the rotor performance decreased due to the interference between the rotors. Lei et al.15,16 designed an experimental platform to analyze the aerodynamic characteristics of a co-axial rotor at different rotor spacing and discovered that the co-axial rotor achieves better performance with minimum interference between the two rotors.
Additionally, as for the experimental studies, Lakshminarayan and Baeder 17 developed a high precision computing platform to understand the interference with different rotor spacing. Coleman 18 analyzed the relationship between the rotor separation and load distribution through experiments. McAlister et al. 19 confirmed that there were difficulties in assessing the performance of a co-axial rotor in hover with different rotor separations and considering the ground effect.
Most of the previous studies on the co-axial rotor either involve performance measurements to optimize efficiency, or use of computational fluid dynamics (CFD) method was focusing on the interference of vortices, contraction of wake trajectory, additional induced loss to investigate the aerodynamics performance. However, based on the comparison between experimental and simulation results, the comprehensive analysis of the effect of rotor spacing on the aerodynamic performance for the co-axial rotor was rarely involved, especially for the performance optimization of the co-axial rotor in hover. Additionally, the experimental setups reported in the literature were complicated, and only some typical rotor models were tested. Furthermore, the external disturbance and measurement errors of the rotor system were usually ignored in the experiments.
The present study attempts to measure the performance of the co-axial rotor using a custom-designed experimental setup. To evaluate the rotor performance, errors from the experimental setup are also calculated. Moreover, the flow field characteristics are also simulated using CFD methods to systematically study the effect of rotor spacing on the aerodynamic performance of a co-axial rotor. The range of z/D considered in this study is 0.16 to 0.38. Based on the obtained results, the aerodynamic configuration of the co-axial rotor is optimized with proper rotor spacing.
Experimental investigation
Basic parameters
The rotor is made of carbon fiber with two blades with the mass of 0.015 kg, and manufactured by the Beijing Satellite Factory in China with special manufacturing process. The rotor radius is 0.2 m with a fixed pitch. Further characteristics of rotor blade are shown in Table 1 and Figure 1 (where the c is the rotor chord).
Characteristics of rotor blade.

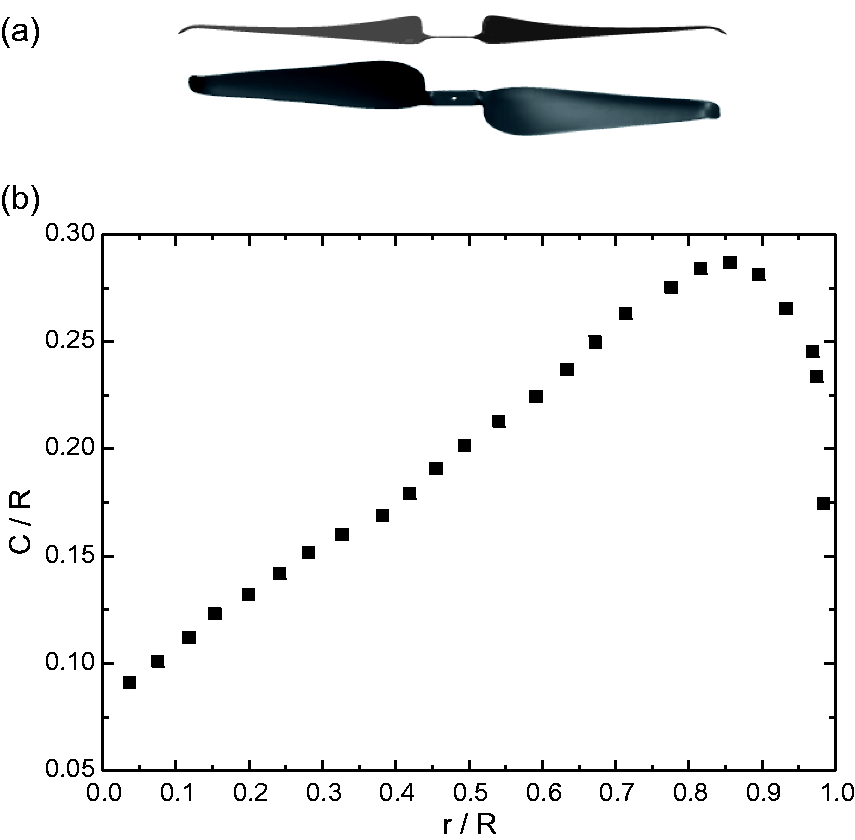
Rotor details. (a) Rotor profile. (b) Rotor chord distribution.
In the experiments, the top rotor rotates counterclockwise, and the bottom rotor rotates clockwise. The rotational speed range is from 1600 r/min to 2300 r/min. Therefore, the tip Mach number is varied from 0.1 to 0.14 and the tip Reynolds number is varied from

Reynolds number at 0.75 R.
To analyze the interference between the top and bottom rotor, the rotor spacing which is a dimensionless quantity, defined as z/D. In this experiment, different rotor spacings given by z/D = 0.16, 0.19, 0.23, 0.26, 0.29, 0.33 and 0.38 are studied. Furthermore, the rotational speed is divided into eight intervals for detailed research.
Experimental setup: Performance measurements
An experimental setup is customized to provide required torque, rotational speed, thrust and power consumption to measure the aerodynamic performance of the co-axial rotors. Sketch of the experimental setup is shown in Figure 3.
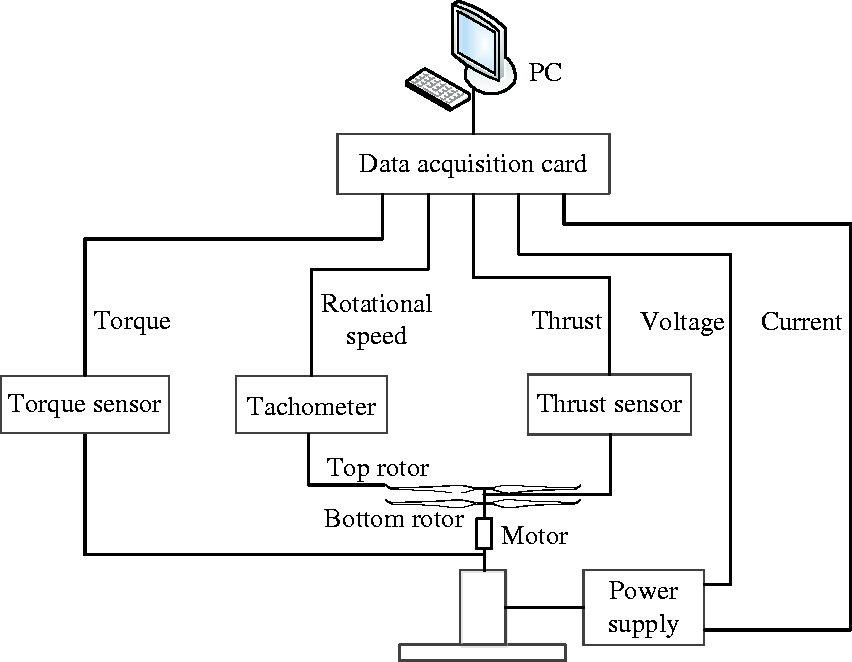
Sketch of the experimental setup.
The rotor system was inversely fixed above 1.5 m from the ground to avoid the ground effect. The co-axial rotor was driven by the BLDC motor with the inner rotor and the model is KV 4800. Also, the power supply of the motor uses the 6 V DC lead storage battery with the power of 300 W.
The rotational speed of the BLDC motor was controlled through pulse width modulation (PWM) from a remote controller and the resultant speed was measured by using a handheld tachometer (type: DT – 2234 C, accuracy: ± (0.05% + 1 d)). The thrust sensor (type: CZL 605, accuracy: 0.02% F.S) mounted on the rotor shaft to measure the rotor thrust. Similarly, a torque sensor (type: HLT – 131, accuracy: 0.5% F.S) was fixed on the motor to obtain the rotor torque which is measured by the technique of resistance strain gage. During the experiments, co-axial rotors were torque balanced by changing the rotational speed of the bottom rotor, while keeping the upper rotor’s rotational speed fixed to make the torque voltage on the voltmeter is zero. Additionally, the power consumed by the motor was calculated by the measured current and voltage of the motor. Torque, thrust, rotational speed, current and voltage of the co-axial rotor were recorded by a data acquisition connected to a computer.
Hinges and bearings were avoided during experiments to minimize the error that will be induced in the rotor system. Additionally, holes are provided at different locations on the rotor shafts to change the rotor spacing.
The experiments were done according to the following procedures: (1) test the co-axial rotor with different rotor spacing and rotational speed; (2) test the isolated rotors with different rotational speed; (3) validation of the co-axial rotor with simulations.
Experimental results and discussion
Thrust and power consumption are the key parameters to measure the performance of rotor system. Compared with the baseline case of z/D = 0.38, the percentage of thrust and power consumption at different spacing is shown in Figures 4 and 5.

Thrust vs. rotational speed of co-axial rotors system at different spacing.

Power consumption vs. rotational speed of co-axial rotors system at different spacing.
According to the data of z/D = 0.38 case, it is clear that the thrust and power consumption increases with the rotational speed for all the rotor spacings. As shown in Figure 4, the increasing rate of thrust expands with the rotational speed. This is because the blade is more sensitive to the viscosity effect at low Reynolds number, which causes a greater reduction in the thrust in lower rotational speed. Additionally, the largest thrust is obtained at z/D = 0.19 at different rotational speed. However, the thrust decreases and remains fairly constant with a larger rotor spacing. It seems that the upwash and downwash generated by the top and bottom rotors become weakened, and the fluctuation imposed on the rotor system also decreases as the rotor spacing increases, eventually leading to the thrust degradation.
As shown in Figure 5, fluctuations of power consumption are mainly between the rotor spacing of 0.16 and 0.19. This may be caused by a stronger aerodynamic interference generated by the smaller rotor spacing, which has a direct effect on the total power. However, the power consumption of z/D = 0.19 case is much lower than that of z/D = 0.16 case for the same rotational speed. At larger rotor spacings, trends are similar to the baseline case of z/D = 0.38. In summary, z/D = 0.19 case consumes less energy than z/D = 0.16 case and the power consumption of rotor system remains fairly constant with larger rotor spacings.
Based on the analysis of thrust and power consumption from z/D = 0.16 to z/D = 0.38, the higher thrust with a lower power consumption is obtained at z/D = 0.19, where the co-axial rotors show a relatively constant aerodynamic performance.
Thrust at different rotor spacing with rotor speed of 1600 r/min (low speed), 1950 r/min (medium speed) and 2300 r/min (high speed) are shown in Figure 6. It can be seen that the performance in terms of thrust is superior at z/D = 0.19. Moreover, thrust at different rotor spacing is significantly improved with the increase of rotational speed. It is also clear that the thrust reduction at higher rotor spacing seems stabilized and becomes independent of the rotor spacing.

Thrust vs. rotor spacing at typical rotational speed.
To study the aerodynamic interference between the top and bottom rotor, total thrust for three cases, viz., (i) isolated top and bottom rotors, (ii) an equivalent isolated rotor and (iii) co-axial rotors (same disk loading for each rotor) are compared in Figure 7.

Thrust vs. rotational speed.
It can be seen that the thrust of co-axial rotors increases more quickly along with the rotational speed as compared to that of the isolated rotor. The reason for this increase may be attributed to the reciprocal induction between the two rotors. Apparently, the co-axial thrust is smaller than the total thrust produced by the isolated top and bottom rotors. It seems that the mutual interference between the two rotors creates a certain loss in thrust when compared to each isolated rotor in hover since the bottom rotor works in the wake of the top rotor, while the top rotor is influenced by the upwash generated by the bottom rotor. Therefore, it can be concluded that the interference between the top and bottom rotors indeed affects the aerodynamic performance of co-axial rotors by comparing the thrust.
Power loading (PL), another important parameter for the hover efficiency, is defined as follows


Therefore, power loading (PL) can be simplified as

Power loading at different rotor spacings is shown in Figure 8.

Power loading (PL) vs. rotational speed.
For the same disk loading, the power loading apparently decreased along with the rotational speed. The key reason for the decrease is mainly that the descent rate of thrust is less than the power consumption for a co-axial rotor at lower rotational speed, which was also demonstrated by Bohorquez. 13 Besides, among all the rotor spacings, the power loading at z/D = 0.19 is relatively higher, where the co-axial rotor shows an optimal hover efficiency, especially at lower rotational speeds.
Error analysis
The main errors that introduced in the experiments are the deviations of the rotational speed and the voltages variations from the thrust sensor. Error in the rotational speed depends on the finite number of magnets which excite the Hall Effect sensor in the motor. For the selected motor, there are 24 magnets which result in an uncertainty of 1/24 revolution for each rotor rotation. Therefore, there is an error of 1/24 × 60 = 2.5 r/min by the number of times for a magnet passing over the Hall Effect sensor in 1 s.
Additionally, the accuracy of thrust sensor is 0.02% F.S and the thrust error is proportional to the rotational speed. According to ‘Kline-McClintock equation’, the uncertainty in thrust coefficient based on the measurements from experiments is calculated as follows
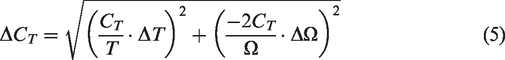
Finally

Similarly, the uncertainties in power coefficient and power loading are


Considering the measurement errors from the thrust and rotational speed, the uncertainties in thrust coefficient, power coefficient and power loading are 1.2%, 1.1% and 1.5%, respectively.
Simulation results analysis
Verification and validation
The obtained simulation results for the NACA 0012 airfoil are verified by comparing the computational results from Syal.14 Lift coefficient for low Reynolds number is shown in Figure 9.
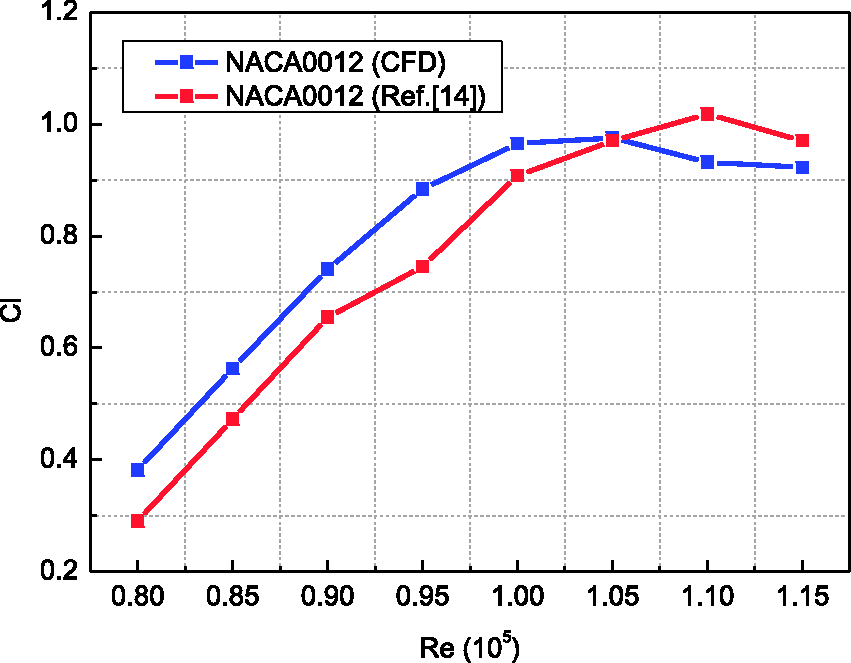
Comparison of computational results.
It can be seen from this figure that the simulation results are slightly higher than that of the values shown in Syal.14 for Reynolds number ranging from
Furthermore, the simulation results are also validated with experiments and comparison of the thrust and power coefficients is shown in Figure 10.
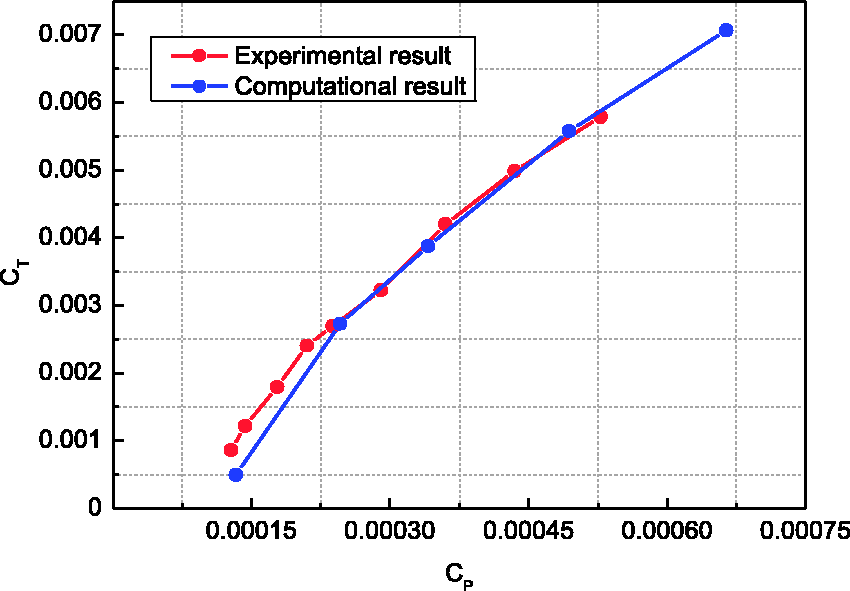
Comparison of experimental and computational results.
The thrust coefficient obtained from the experiments is slightly higher than that of the simulation results. The overall trend is consistent with that of the results presented in Ye and Xu.10 From the verification, it can be concluded that the experimental results, as well as the measurement methods, are valid.
Streamline analysis
Simulation results characterized by the aerodynamic interference of co-axial rotors in hover were also observed to study the aerodynamic performance of the overlap region between the top and bottom rotors. As the blades rotate, vortices shedding near the trailing edge affected each other and drifted away from the rotor tip, which affect the structure of the flow field of the co-axial rotors. Streamline distributions that reflect the actual states of flow field are shown in Figure 11.

Streamline distributions of flow field in the xy plane: (a) z/D = 0.16; (b) z/D = 0.19; (c) z/D = 0.23; (d) z/D = 0.26; (e) z/D = 0.29; (f) z/D = 0.33; (g) z/D = 0.38.
It is clear that streamlines in the flow field are circumferentially diffused by the vortices, resulting in the aerodynamic interference. Generally, the coupling aerodynamic interference and circumferential flow of vortices exist in the overlapping region. As the rotor spacing increases, the interference between the vortices became weak and the streamlines began to couple with each other. It can be inferred from the experimental results that the stronger coupling interference at the smaller rotor spacing is beneficial on the hover efficiency with a higher total thrust and lower power consumption, which eventually improves the aerodynamic performance of the rotor system.
As a result of the strong interference between the two rotors, part of the total power might be offset and the decreased power provides the co-axial rotor with higher power loading. Furthermore, the impingement of vortices on the bottom rotor could play a significant role in reducing the unstability for co-axial rotors.
Analysis of pressure at blade tip
Pressures at the blade tip for the co-axial and isolated rotors at 2200 r/min are shown in Figure 12.
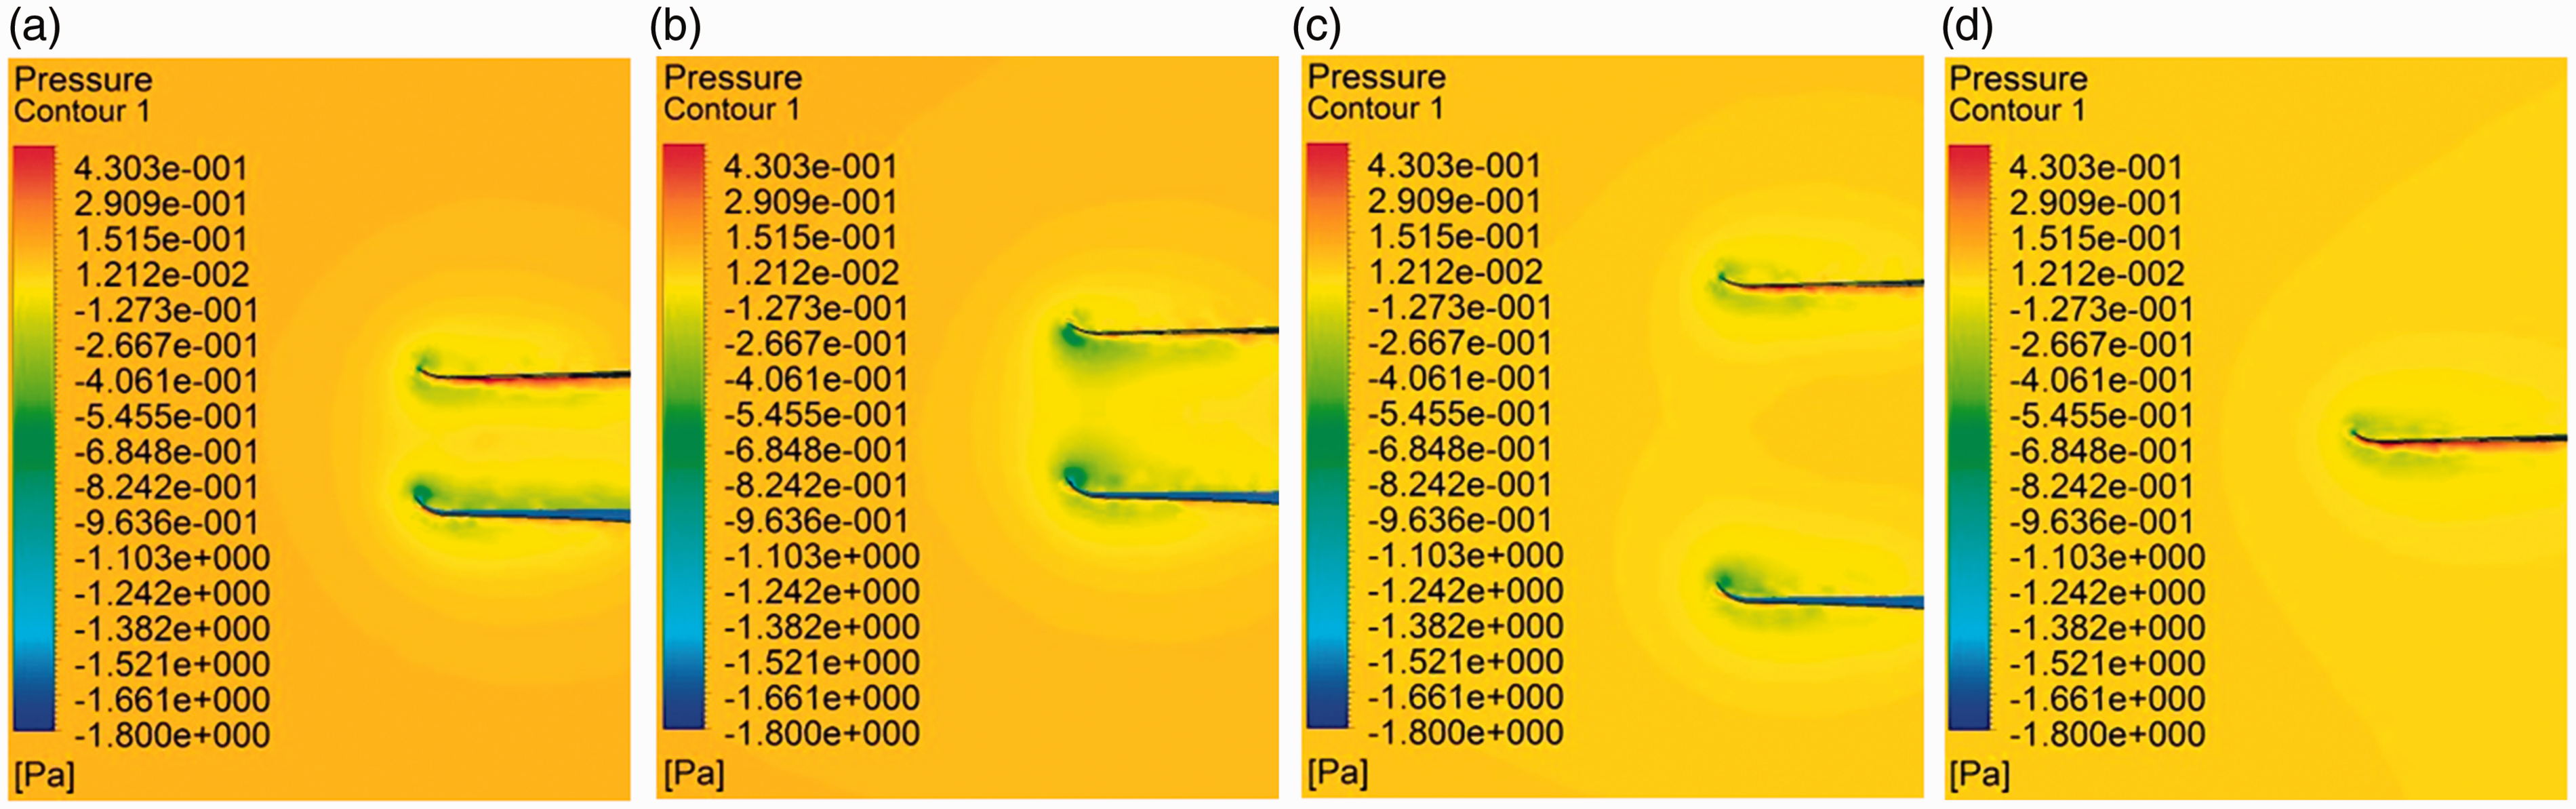
Pressure at the blade tip (2200 r/min): (a) z/D = 0.16 of co-axial rotor; (b) z/D = 0.19 of co-axial rotor; (c) z/D = 0.38 of co-axial rotor; (d) isolated rotor.
Generally, negative pressure around the blade tip generated by the higher rotational speed may result in an adsorption. Due to this effect, the vortices near the blade tip begin to shed and interact with each other, which will affect the pressure distribution of the flow field. By comparing the pressure distribution of the top and bottom rotors, it is found that the magnitude of the negative pressure is larger at z/D = 0.19 as compared to z/D = 0.16 and z/D = 0.38. Therefore, the pressure between the blade tip and is stronger at z/D = 0.19, where the co-axial rotor will generate higher thrust. According to the experimental results, the highest thrust is also obtained at z/D = 0.19. Therefore, it can be inferred that the aerodynamic interferences between the rotors and surrounding air are stronger at smaller rotor spacing, which might improve the rotor performance to some extent.
Furthermore, pressure at the blade tip for the top rotor at z/D = 0.38 shows similar distribution to that of the isolated rotor. It might be due to the fact that the bottom rotor does affect the performance of the top rotor at smaller rotor spacings. However, the effect is significantly reduced as the rotor spacing increases.
Conclusions
The present work was focused on understanding and optimizing the performance of co-axial rotors for a speed varied from 1600 r/min to 2300 r/min with the rotor spacing z/D varying from 0.16 to 0.38 (rotor diameter D = 0.4 m). Both the rotor profile and the experimental platform were custom designed to optimize the aerodynamic performance of co-axial rotors. Additionally, error analysis was also conducted to determine the experimental accuracy. Combined with the numerical simulations, the coupling interference generated between the top and bottom rotor was studied by the streamline and pressure distribution at the blade tip. It can be inferred that the effects of interaction indeed improve the aerodynamic performance of co-axial rotors. Results also prove that the hover efficiency of the co-axial system was indeed much improved by changing the rotor spacing and the optimal aerodynamic configuration was finally determined.
Considering the special rotor profile, specific conclusions obtained from the experiments and simulations are as follows:
The optimal aerodynamic performance of co-axial rotors is confirmed as z/D = 0.19 with a higher thrust and lower power consumption especially at larger rotor spacing. This can be attributed by the aerodynamic interactions between the top and bottom rotor. Also, stronger interference of vortices due to smaller rotor spacing can improve the performance of co-axial rotors. Compared with the isolated rotor, the thrust of co-axial rotors increased quickly along with the rotational speed. Consequently, the potential to increase the thrust of co-axial rotors is much higher than for thrust of the isolated top and bottom rotor. For the same disk loading, rotor spacing at z/D = 0.19 is relatively higher than other rotor spacings since the PL is apparently higher, especially at a lower rotor speed. The bottom rotor does affect the performance of the top rotor at smaller rotor spacings, whereas the effect is significantly reduced as the rotor spacing increases.
Footnotes
Acknowledgement
We thank Collaborative Innovation Center of High-End Equipment Manufacturing in Fujian Province of China for applying the experimental field.
Declaration of conflicting interests
The author(s) declared no potential conflicts of interest with respect to the research, authorship, and/or publication of this article.
Funding
The author(s) disclosed receipt of the following financial support for the research, authorship and/or publication of this article: This project was supported by the National Natural Science Foundation of China (Grant No. 51505087 and 11502052).