
Abstract
One of the major challenges of Mini-Unmanned Aerial Vehicle flight is the unsteady interaction with turbulent environment while flying in lower levels of atmospheric boundary layer. Following inspiration from nature we expose a new system for angle of attack estimation based on pressure measurements on the wing. Such an equipment can be used for real-time estimation of the angle of attack during flight or even further building of wind velocity vector with additional equipment. Those information can find purpose in control and stabilization of the aircraft due to inequalities seen by the wing or even for various soaring strategies that rely on active control for energy extraction. In that purpose, flying wing aircraft has been used with totally four span-wise locations for local angle of attack estimation. In-flight angle of attack estimation from differential pressure measurements on the wing has been compared with magnetic sensor with wind vane. The results have shown that pressure ports give more reliable estimation of angle of attack when compared to values given by wind vane attached to a specially designed air-boom. Difference in local angle of attack at four span-wise locations has confirmed spatial variation of turbulence in low altitude flight. Moreover, theoretical law of energy dissipation for wind components described by Kaimal spectrum has shown acceptable match with estimated ones.
Keywords
Introduction
There are strong indications that birds use their feathers for sensing of flow perturbations over their wingspan. Being fluffy and subjected to fluttering provoked by small disturbances, birds have natural sensory system which enables them to “feel” flow disorders along their wing. Another convenience of their elastic body structure is capability of using adaptronics for various turbulent flight regimes. Eventual immediate action due to surface pressure fluctuations by modifying wing geometry or profile curvature allows quick and effective response in gusty environment. Some photographs of Grey Gull shown in Figure 1 provide a hint on unsymmetrical reactions, possibly due to unequal disturbances on the wing.

Local separation control of natural flyers. 1
However, for a variety of reasons, it is understood that identical copies from nature to man-made technologies are not feasible. Instead, a creative inspiration and conversion into technology is often based on various steps of abstraction.
MiniUnmanned Aerial Vehicle(UAV) usually fly at lower levels of atmospheric boundary layer where the turbulence intensity is significantly increased due to the proximity of the ground. Such a complex surrounding implies intricate interaction between terrains’ geometry, physical conditions, and varying meteorology. If gust length scales were equal or larger than the wingspan, then flight through such a large gust structure would result in only pitching and heaving motion. However, gusts smaller than the wingspan would result in uneven load distribution along wingspan implying additional roll and yaw moments on the wing. These information can be of particular interest in case of gust energy extraction flight strategy.
The performance of small UAVs being constrained by onboard energy due to their limited size can be significantly enhanced by specific flight strategies according to expected atmospheric formations. Most of the energy harvesting methods rely on active control system that detects and exploits the energy of atmospheric turbulence through intentional maneuvering of the aircraft. As a response for such a request, this paper proposes one of the methods for wind estimation which could be used as a direct input of control for energy harvesting strategy. Moreover, such a system could be replicated on various positions along wingspan which could provide necessary information on gust length scales during the flight. The major benefit of such a biologically inspired sensory system is that the flying vehicle senses the disturbances rather than its responses to it.
An approach based on unscented Kalman filter is proposed by Condomines et al. 2 for nonlinear wind estimation in aspect of formation detection of cumulus-type clouds with a fleet of drones. Review and suitability of conventional sensors applicable to small UAVs is performed by Mohamed et al. 3 The use of pressure sensors on the wing as a stabilization system of a micro UAV for roll axis was demonstrated by Mohamed et al.4,5 Another way of stabilizing a small UAV in turbulent conditions has been performed by Mohamed et al. 6 with pitch probes (multihole probes) located on both sides of the wing. Both ways promise more effective stabilization of the aircraft when compared to conventional inertial systems. Moreover, a correlation between a single pressure tap on the wing and cord-wise integrated pressure coefficient was used for roll mitigation of oncoming turbulence by Marino.7,8 Capacitive strip sensors applied on the airfoil skin were demonstrated by Callegari et al. 9 A stabilization system based on surface pressure measurements can be considered as feeling way of turbulence affecting aircraft. They promise more effective response as opposed to conventional approach of traditional systems based on inertial sensors. The systems previously mentioned replicate the function of feathers and hairs as shown in Figure 2. A flush air data system intended for wind vector sensing in dynamic soaring UAVs is presented in Quindlen and Langelaan. 10 The system uses pressure holes on the aircraft nose cone as inspiration from Wandering Albatross and Giant petrel nostrils. As opposite to fluffy wing structures, some birds are also equipped with rigid sensory systems as explained in previous work. An overall view on biologically inspired aerodynamic structures and their effect on performance improvement and flight control has been presented by Rasuo. 1 An overview on aerodynamic structures for aircraft drag reduction inspired by wing tips of some natural flyers has been investigated in Gavrilovic et al. 11

Bionical approach.
The advantage of the principle proposed in this paper is the capability to estimate the precise value of angle of attack on the arbitrary chosen locations on the wing. Those precise information can be further used for meteorological investigation or as an direct input of control for energy harvesting flight strategies from atmospheric phenomena with gliding or powered flight. The system is particularly interesting for soaring strategies as it allows aircraft to feel upcoming disturbances. It also provides insurance that detected turbulent structures can be exploitable due to their magnitude frequency and length scale.
Existing meteorological knowledge of atmospheric boundary layer
Mini and micro UAVs predominantly fly in the surface of atmospheric boundary layer, where turbulence is strongly influenced by surface conditions, both terrain and temperature. We can differentiate two types of sources affecting turbulent formation of atmosphere. Mechanical is caused by friction as air flow masses move over the earth surface. Appearance of gradients in velocity will induce the formation of shear layers. Those shear layers produce rotating air motions or eddies and their strength is directly proportional to the magnitude of air velocity. The other sources could be the roughness and natural obstacles that deflect air flows. On the other hand, thermal turbulence is caused by buoyancy effects. Unequal heating of the ground provoked by the clouds or natural obstacles such as cliffs, mountains, and valleys generates large circulation systems called thermals, where warmer air have a tendency of climbing while being replaced by cold air from the bottom. Those thermal irregularities are actually magnifying vertical mixing caused by mechanical turbulence. These two distinct sources present obvious challenge to flight stability and control but they also provide the opportunity and energy source for soaring flight strategies.
The measurements of turbulence in lower part of atmospheric boundary layer (i.e. region influenced by the frictional effect of surface extending from surface up to the range of 100 up to 1000 m depending on the surface and climate conditions) are usually done at fixed mast locations near wind turbine stations. It is known that turbulence intensity increases nearing the ground, strongly influenced by the terrain, thus changing the conditions comparable with those at high altitudes. Designation of standard deviation Ti of fluctuating velocity σu divided by mean velocity
The average magnitude of wind in Europe measured in the horizontal plane at 10 m above ground followed over the period of 44 years (1957–2002) shows a variation of 2–4 m s−1 depending on the exact location of region as presented in Peter. 12 Recent experiments from Watkins 13 considered measurements of spatial variation in pitch angle and confirmed statement about spatial variation of turbulence magnitude.
Previously described environment satisfies possible scenario of MAV flight concerning both altitude and experienced wind conditions. Moreover, it proves that atmospheric influence on low altitude UAV flight is 3D.
Inspiration from nature
Various styles of flight could be noticed while bird-watching. According to Scott and McFarland 14 birds use several strategies of energy harvesting, which serve as an inspiration for all the current improvements in the field of UAV long endurance performance. Interaction of wind and obstacles such as buildings, hills, or waves generates an ascending component of air motion. Many birds with knowledge of soaring techniques use these updrafts to power their flight instead of wing flapping. In case of unequal heating of earth’s surface provoked, for example, by punctured cloud layer, implies uplift of hot air, known as thermal. Eagles, condors, vultures, and many other large birds use these updrafts with a technique called thermal soaring in order to extend their endurance while searching for a prey. Another example is sweeping flight within the gust pushed by the waves. Gulls and pelicans use these gusts to power their flight by flying along the wave cliffs. Gaining speed while wave slows down, they are able to pull up and glide to another wave where the process continues. Some birds such as kestrels remain motionless above a point on the ground by flying into the wind at a speed equal to that of the wind. This technique is called wind hovering.
There is a dense network of nerves around feather follicles according to Videler. 15 Feathers are actually connected to the follicles in the skin and they represent a very complex system of muscles and nerves interconnected. Primary function of such an anatomical configuration is mechanoreception. Specialized feathers on the head and breast have been shown to act as indicators of wind speed and direction. It has been also found that birds have very sensitive nerve endings (Herbst corpuscles) in their skin which are able to detect very high frequencies of vibrations of more than 100 Hz. Severe turbulent flows will cause the feathers to vibrate and gyrate wildly. As the feathers are elevated by the air stream, mechanoreceptors increase their discharge frequency according to Brown and Fedde. 16
Microstructures require much more attention because they serve a lot of functions. So far understanding of flight control in birds is very limited. The connection between the natural sensory system and motor pathways involved in complex movements in soaring flight strategies has not yet been fully understood.
Algorithm development
Wind model for simulations
From field experiments it is well known that undisturbed wind velocity is variable in space and time. The most adequate method to simulate a turbulent wind field would be to solve Navier–Stokes equations of an atmospheric flow bounded from below by an aerodynamically rough surface. This method requires enormous computational resources. Alternative could be large Eddy simulations as an approximate solution to the Navier–Stokes equations where the smallest scales are not solved directly but modeled. Still even simplified alternative requires big computational power. Therefore, empirical description is generally used for turbulence representation, using spectral and coherence functions.
Widely used Dryden and von Karman spectral representations describe an average of all conditions for clear air turbulence. The limitations for those two models are due to the factors not incorporated into the spectral representation, such as terrain roughness, wind shear, and mean wind magnitude. On the contrary, Kaimal and Finnigan
17
spectra were developed on measurements over flat homogeneous terrain. The main finding of Kaimal and Finnigan
17
was the jump in spectral energy density at low frequencies as the stability of the atmosphere changed from stable (cooling from below) to unstable (warming from below). A model of turbulent wind field suitable for calculations requires good representation of both temporal and spatial structure of turbulence. Method for a generation of a single wind time series from a Kaimal spectrum is proposed by Branlard.
18
It leads to natural representation of turbulent flow of high computational cost compared to alternative large Eddy or Navier–Stokes simulations. The spectrum used in simulations is presented by Kaimal and Finnigan
17
with its adjustable constants that depend on the chosen turbulent length scales, intensity of turbulence, surface roughness, and Reynolds and Richardson number

The characteristics of generated profiles are compared with available database on wind characteristics that can be found in the literature
19
with intention to match the same level of turbulence energy (see Figure 3 for power spectral density (PSD)). The generated profile has been made with turbulence intensity,

Generated time series of Kaimal spectrum as an input for URANS simulations. PSD: Power Spectral Density.
Numerical calculations
After the generation of wind profile time series, 2D computational domain has been built with structured mesh around an airfoil SD2048. Structured mesh convergence has been studied previously to satisfy required number of cells for precise representation of boundary layer and wake formation. The chosen airfoil is a typical low Reynolds number foil which could be found on several gliders including SB-XC (mini UAV) used by NASA.
20
The resulting vertical and horizontal wind profiles generated previously have been used as a direct input for inlet boundary condition of unsteady RANS simulations. The time step chosen for unsteady simulations was
The main goal was to pick a specific pair of pressure ports where one port is on the upper surface of the airfoil and the other on the lower surface. Chosen pair has been selected at 30% of cord with a request of precise estimation of angle of attack at high mean angles of attack, even after beginning of stall. Moreover, the chosen location also had to provide sufficient thickness of the structure for the hardware mounting. The points on airfoil surface are recording pressure with time, while the points in front of the airfoil record dynamic pressure (see Figure 4 for point location). The information on the pressure difference is afterward transformed into difference of pressure coefficients between the chosen ports. The following relation has been found

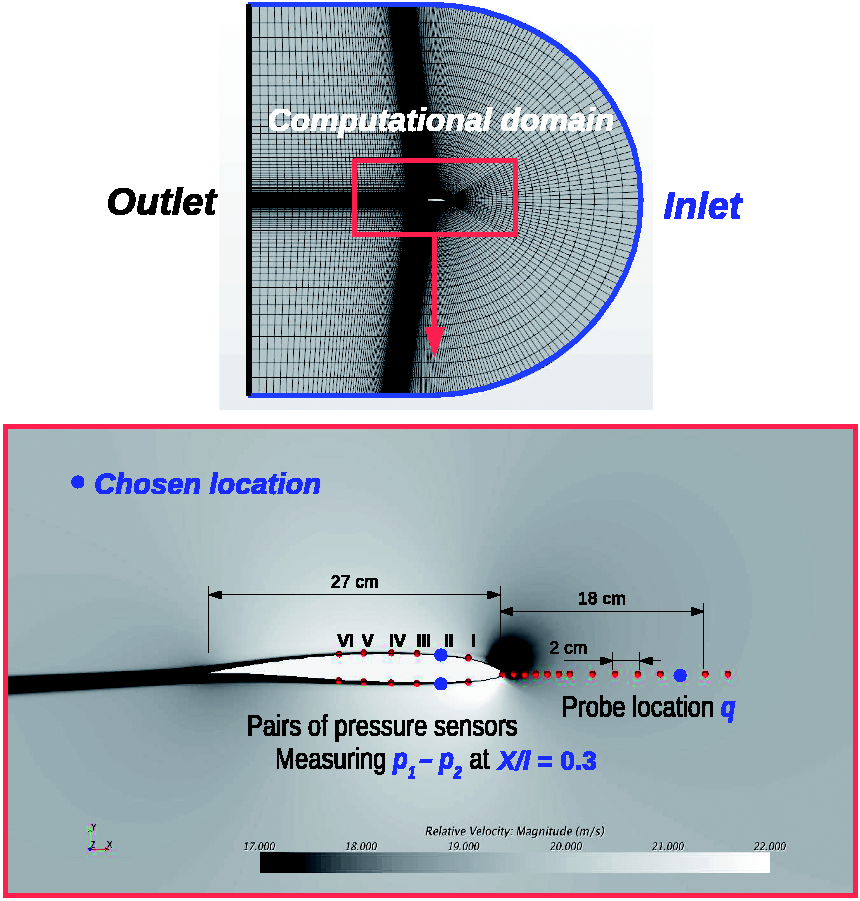
CFD computational domain of SD2048 airfoil with surface ports measuring pressure difference and forward ports measuring dynamic pressure.
The imposed wind profile at the inlet of the computational domain will generate additional angle of attack on the airfoil. The idea is to capture the angle of attack increments provoked by wind with related pressure coefficient fluctuations on the airfoil. This is achieved with polynomial fitting, where the optimization of the coefficients is performed with method of least squares

The relation claims that we are able to estimate the angle of attack knowing the pressure difference between the upper and lower point on the airfoil and dynamic pressure as shown in Figure 5. Once optimized for a certain airfoil and position of ports, coefficients of fitting were tested with various mean angles of attack and airspeeds. Those tests have shown that impact of Reynolds number variation does not affect significantly the angle of attack estimation.

Curve fitting between angle of attack and local wing pressure coefficient for numerical simulations (Re = 340,000).
However, for a variety of reasons it is clear that numerical simulations if posed correctly represent idealistic case where all the information of the flow are known in every node of the domain. Therefore, we proceed to realistic study of equipment in the flight test.
Platform
UAV and equipment
To verify the bioinspired sensory system, flight trials using an open source flight controller Paparazzi 21 were performed. The chosen flight test vehicle was a flying wing shown in Figure 6, built in UAV laboratory of ENAC. The aircraft geometrical parameters are shown in Table 1. Particular interest of using flying wing configuration is sufficient thickness of the wing cord for sensor and equipment integration. This type of vehicle could be a representative of a powered drone which has been loaded with sensors and other payloads. Modifications to the aircraft were required to house pressure ports and special custom designed airflow boom.
Aircraft characteristics.

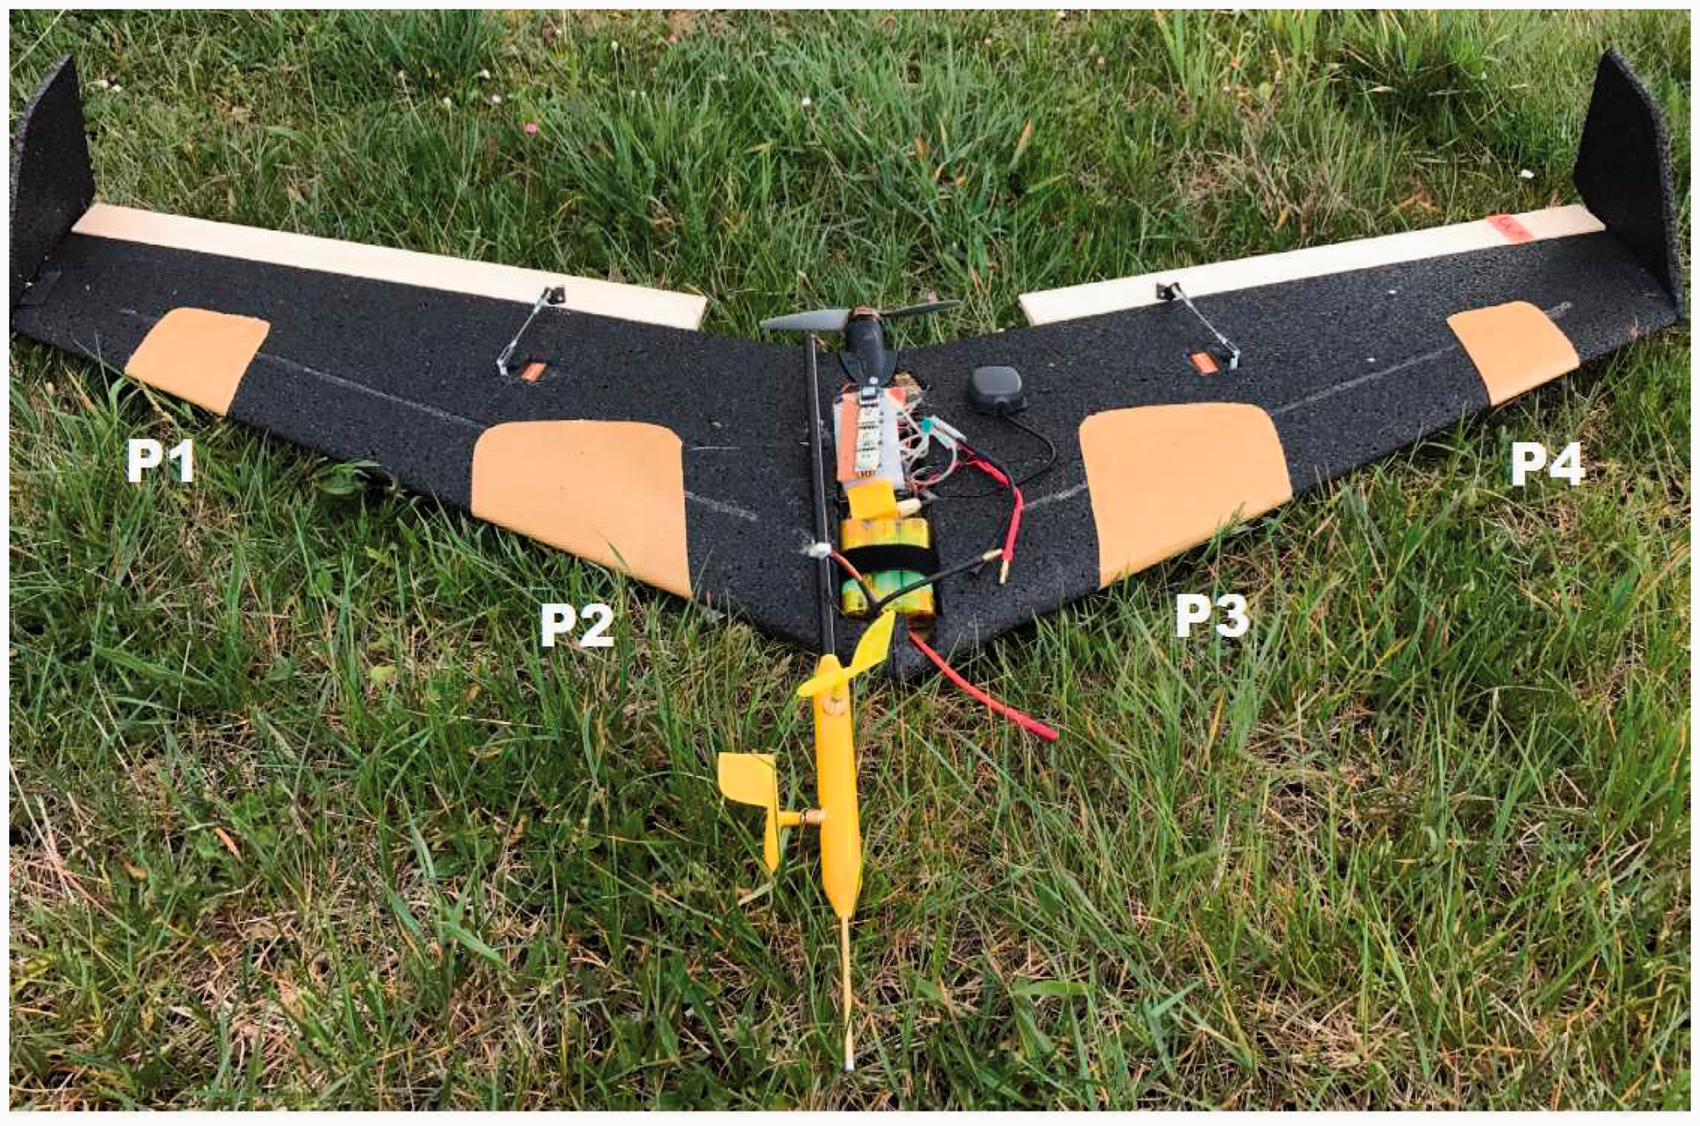
Flying wing UAV with equipment for angle of attack estimation.
Pressure sensors are located beneath the Kevlar wing skin at 30% of cord distance. Small holes of 2 mm diameter were made in the vertical plane of the wing. Totally four places were chosen marked as points 1, 2, 3, and 4 in Figure 6. Points 1 and 4 are located at 75% of the half-wing span. The distance between points is 40 cm. Each port pair is connected to a single differential pressure sensor. A separate device for airspeed and air angles has been designed in order to have values comparative to one estimated by the pressure measurements. Carbon rod has been joined to a 3D printed housing on its tip. The size of the housing was designed in such a way to accept magnetic encoder, pitot tube, and all necessary wiring and pressure tubes (see Figure 7). The length of the carbon rod was previously determined in CFD simulations for a nondisturbed pressure field condition. Small, 3D printed flag was attached to the magnetic encoder. All of the sensors shown in Table 2 update at frequency of 50 Hz and are being recorded to an onboard data logger, except for the differential GPS which works at 5 Hz.

Custom design of device for airspeed, angle of attack, and slide slip angle measurements.
Equipment onboard.

DGPS: Differential Global Positioning System; IMU: Inertial Measurement Unit.
Calibration of sensors
Calibration of the pitot tube, pressure sensors, and magnetic encoder has been performed in a wind tunnel with installed autopilot board and accompanying equipment. Reference for the pitot tube was imposed velocity of the wind tunnel measured with a hot wire anemometer. Calibration of pressure and flag sensor was done with respect to the IMU output from the autopilot, due to the equality of pitch angle and angle of attack in the wind tunnel, as shown in Figure 8 . Curve fitting has been performed once again with least square method in PYTHON and obtained constant coefficients were used for further flight tests analysis. One of the drawbacks of this system is that pressure sensor (for angle of attack estimation) calibration is strictly related to the wing geometry of the pressure port location. Once calibrated, sensor for chosen aircraft and position is not reusable for a different wing shape and dimensions. Due to the required precision, ground and climb speed estimation could not rely on only GPS output. Especially problematic estimation of altitude requires combined work of barometer, differential GPS, and accelerometer.
Analysis of experimental data
Flight data
Our intention is to use available information of flight parameters for further processing and transformation into wind components. The process of wind estimation requires knowledge of pitch angle θ coming from IMU system; angle of attack α coming from pressure or flag sensors; dynamic pressure q coming from pitot tube; and finally ground and climb speed coming from GPS, barometer, and accelerometer combined together. With respect to Figures 9 and 10 we write the following equations for wind components


The flight has been started directly in autopilot-assisted mode. After a short attempt, a small angle of attack increment was required in order to sustain the level flight. Due to the fact that ailerons occupy most of the wingspan, certain modifications in algorithm function have been made taking into account aileron deflection

Some intentionally provoked oscillations were made in order to visualize similarity between the angle of attack estimated from pressure sensors and wind vane. The first flight was performed in calm atmosphere (i.e. no wind conditions). Figure 11 shows acceptable similarity between the two with a slight difference in magnitude for the highest peak. The difference is coming due to the fact that 3D printed flag has a certain inertia and that the boom is of significant length and mass.
Further comparison between pressure-based angle of attack and one delivered by wind vane showed a significant divergence for small amplitude oscillations provoked by actuator programmed elevator input. This flight was performed in turbulent atmosphere. High level of coherence between the pressure-based angle estimated at points 1 and 4 (i.e. far left and far right point) can be seen in Figure 12. However, the spectrum for angle delivered by wind vane reveals deviation when compared to pressure-based angles. It can be seen on the graph that wind vane did not capture high-frequency oscillations. The wind tunnel results shown in Figure 8 proved that there was no noise from electronic devices. Therefore, the high-frequency noise is considered to be physical. The reason behind such a discrepancy can be due to flag inertia or vibrations due to boom length. Hence, we conclude that the pressure sensors integrated in the wing provide more reliable and better quality output for angle of attack estimation. It was demonstrated that pressure-based angle of attack captures higher frequency response when compared to wind vane.

Results of calibration from wind tunnel experiment. AoA: angle of attack; IMU: Inertial Measurement Unit.
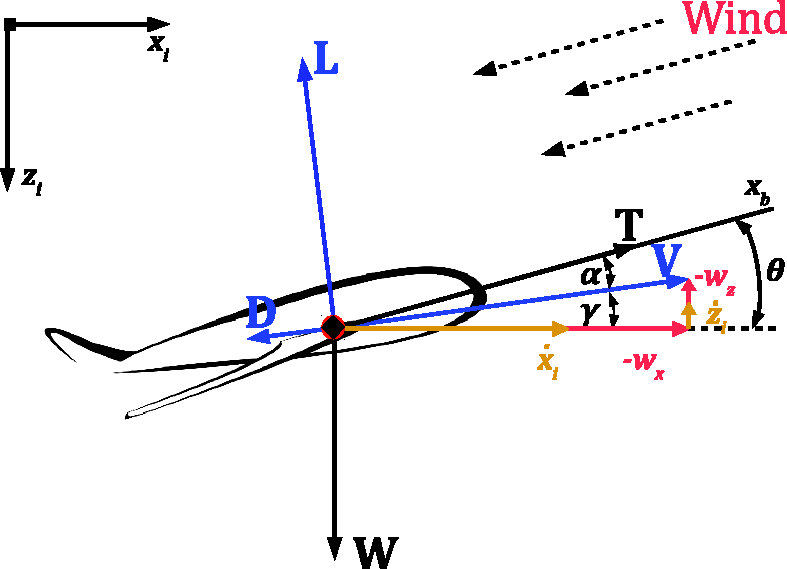
Longitudinal flight dynamics.

Algorithm for wind components estimation. GPS: Global Positioning System; IMU: Inertial Measurement Unit.

High-frequency oscillations in flight test provoked by command input in calm atmosphere. AoA: angle of attack.
Most of the time, flight test resulted with negligible error between angles estimated by different point locations (see Figure 13). This is due to the fact that flight was conducted in relatively calm atmosphere with airspeed of 12 m s−1. However, there were some parts where error was considerable. One of them is shown in Figure 14 where relative difference computed with respect to point 1 located at far right side of the wing is highest for point 4 located at opposite side of the wing. Described discontinuity resulted in roll and yaw moment regulated by actuators for the auto stabilization flight regime. The discontinuity is coming from a gust of a length scale smaller than the wing span, thus implying different wind components seen by each side of the wing locally. Figure 14 illustrates that left side of the wing (i.e. points 3 and 4) saw higher vertical wind component as this part of the wing experienced higher local angle of attack. Locally, angle of attack was dropping in span-wise direction, from point 4 till point 1 with lowest amplitude.

Comparison between pressure-based angle and one delivered by wind vane in turbulent atmosphere. AoA: angle of attack.

Local AoA difference compared to first point. AoA: angle of attack.

Local AoA difference compared to first point—zone of low coherence. AoA: angle of attack.

Stall, spin, and crash. AoA: angle of attack.
Input for the control stabilization in this case is regulated from the IMU coming from autopilot. On one side, IMU acts as a correcting system which responds to direct consequence of disturbance, while on the other side local angle of attack estimation promises “feeling” of upcoming disturbance pointing toward more effective way of control.
Advantage of having multiple location angle of attack sensors can also be found in stall control and evasion which was demonstrated by Bunge et al. 22
The following flight shown in Figure 15 case can be divided into three phases. First phase represents partial stall of the right side of the wing as points 1 and 2 first reached stall limit. This led to an immediate, unrecoverable spin of the aircraft. Despite the efforts of autopilot to recover the aircraft from moderately steep spin, as he was leaving stall several short periods, right part of the wing was always reaching stall limit which resulted finally in a crash. The potential of these information could be easily implemented into the autopilot control laws, restricting the exceeding of stall limit on any part of the wing.
Moreover, wind field estimation can be used as an input for gust energy harvesting. It can serve as a decisive mechanism for control activation of energy extraction presented in the work of Gavrilovic et al. 23 and as guarantee for exploitation of length scales equal or greater than aircraft wing. Accurate estimation of wind field components depends on precision of all the elements involved as discussed in the beginning of this section. So far the estimation relies on integrated equipment where the weakest link is certainly the flight parameters delivered by GPS. As shown in Figure 16 both vertical and horizontal components follow the natural law of turbulence dissipation (i.e. power spectral density (PSD)) represented by Kaimal spectrum. 17 A time series of estimated wind components for around 90 s is shown in Figure 17. However, convincing statement on accuracy of wind components estimation requires comparison between estimated wind field by aircraft and available data from another source (example of flying around meteorological mast at different altitudes) which will be the subject of our further study.

Spectrum from estimated, raw wind components. PSD: Power Spectral Density.

Filtered wind components for 90 s of flight.
Conclusions
Unlike the majority of the wind field data sets, the tests presented here are related to a typical mini UAV flying environment in the low level of atmospheric boundary layer. The presented work shows development of a system for angle of attack estimation based on pressure measurements on the wing for further investigation of meteorological conditions experienced by a small UAV. The system showed several potential applications. The current results have concentrated on the spatial variation in angle of attack along an aircraft wing span. Ability to locally estimate the angle of attack promises potential for control of upcoming roll motions of the aircraft before the inertial response, as information on local angle of attack can be used as direct input of active control for stabilization. The difference between the local angles of attack has been clearly identified during the flight tests. Moreover, the system can be involved in a stall prevention mechanism of the autopilot. As critical point of stall on the wing (i.e. place of maximum local lift coefficient) depends on its geometry, those locations were used for pressure ports, thus detecting initial separations. Particular interest is the implementation of algorithm for wind field estimation. Beside the knowledge of wind field components, the system can also provide a decisive mechanism for actions for power gain in energy harvesting flight strategies. Results have also shown acceptable comparison of measured and theoretical wind spectra.
Footnotes
Acknowledgements
Declaration of conflicting interests
The author(s) declared no potential conflicts of interest with respect to the research, authorship, and/or publication of this article.
Funding
The author(s) received no financial support for the research, authorship, and/or publication of this article.