
Abstract
Objective:
This study aimed to further investigate the relationship between the ratio of red cell distribution width to serum albumin (RAR) index and the risk of kidney stones in the US population, focusing on the mediating effect of body mass index (BMI), and to provide new insights into the prevention and management of kidney stone disease.
Methods:
This was a cross-sectional study derived from the National Health and Nutrition Examination Survey (NHANES) 2009–2018. The total sample size of the study was 20,755, and the association between RAR and kidney stones was studied using multiple logistic regression, subgroup analysis and mediation analysis.
Results:
The findings of this study demonstrate a substantial positive correlation between the prevalence of kidney stones and the RAR index (OR: 1.37, 95% CI: 1.27, 1.49). This association remains consistent even after adjusting for relevant covariates (OR: 1.23, 95% CI: 1.12, 1.36). Utilising curve fitting, threshold effect analysis and restrictive cubic spline methods, an ‘S’-shaped non-linear dose–response relationship between the RAR index and the prevalence of kidney stones was identified (p for overall < 0.001, p for non-linear = 0.002). In subgroup analyses, the association between RAR index and the risk of kidney stones was more significant in the obese population (OR: 1.33, 95% CI: 1.18, 1.51, p for interaction = 0.021). The results of the mediation analysis found that BMI played a 24.5% mediating role between the RAR index and kidney stones. Sensitivity analysis also confirmed the stability of this result.
Conclusion:
A non-linear association has been identified between the RAR index and the prevalence of kidney stones. The study found that BMI is a mediating variable in this association. In obese individuals of Other Race – Including Multi-Racial, the RAR index has been shown to have a more marked effect on the prevalence of kidney stones.
Introduction
Kidney stone disease is one of the most common benign diseases of the urinary tract. However, with the global incidence of kidney stone disease increasing every year, it has become a major public health burden worldwide. 1 The pathological mechanisms associated with kidney stones are still partly controversial, but the harm they cause to patients is certain.2,3
In most studies of kidney stones, exposure factors, such as vitamin D levels, obesity and other related indicators, diet, etc., are often chosen to be directly related to independent risk factors for kidney stones.4–7 But some newer, indirect indicators of the body’s health are often overlooked. The ratio of red cell distribution width to serum albumin (RAR) is a new blood indicator that reflects and assesses the body’s inflammatory response, nutritional status and prognosis for a variety of diseases.8,9
The mechanism underlying kidney stone formation is a controversial and complex process. Several studies have shown that kidney stones are closely linked to oxidative stress, inflammatory responses and nutritional status.10–12 Reactive oxygen species (ROS) and inflammatory cascades play a significant role in this process. The production of ROS and the activation of inflammasomes can encourage the deposition of crystalline deposits in the renal interstitium.12,13 Other studies have found that serum albumin is abundant in kidney stones, which is related to the ability of serum albumin to promote crystallisation and crystal adhesion.12,14,15 A cross-sectional study has also confirmed that elevated serum albumin levels are a risk factor for calcium oxalate formation. 16 The primary treatment for kidney stones is currently surgical removal of the stones. Preliminary explorations into treatment options have been conducted through in vitro and in vivo experiments based on the pathophysiological mechanisms underlying kidney stone formation. Research has shown that downregulating the expression of ROS and blocking the NLRP3 inflammasome pathway reduces the release of inflammatory factors, thereby decreasing crystal formation and renal tubular damage and ultimately achieving a preventive and therapeutic effect against kidney stones.17–19 An increase in oxidative stress levels leads to an increase in inflammatory factor release and a negative nutritional balance (low albumin levels), which, in turn, leads to an increase in red blood cell distribution width (RDW) levels.20–22 Therefore, it is crucial to regulate RDW and albumin levels in the body to prevent and treat the formation and recurrence of kidney stones. Numerous clinical studies have demonstrated the close association between the novel clinical indicator RAR index and various inflammatory-related diseases, including diabetes, metabolic syndrome and rheumatoid arthritis.23–25 Wu et al. 26 suggested a non-linear relationship between the RAR index and the prevalence of kidney stones in US adults. However, this study has obvious shortcomings, and there is no further research that can significantly influence the RAR index in specific populations in the prevalence of kidney stones. Therefore, it is important to further investigate the relationship between the RAR index and the risk of kidney stones.
This study aimed to analyse the association between RAR and kidney stones using data from the National Health and Nutrition Examination Survey (NHANES). To provide new evidence and perspectives for the control and prevention of kidney stone disease.
Methods
Study population and design
The reporting of this study follows the Strengthening the Reporting of Observational Studies in Epidemiology (STROBE) statement. 27 The National Center for Health Statistics (NCHS), a division of the Centers for Disease Control and Prevention (CDC), was responsible for the conceptualisation and execution of the NHANES. The objective of the NHANES was to systematically assess the health and nutritional status of adults and children in the United States through home interviews, physical examinations and laboratory tests. All participants in the NHANES programme provided written informed consent. The study encompassed 49,693 participants from five survey cycles from 2009 to 2018, and data on participants’ demographics, exercise time and kidney stones were collected. However, data pertaining to missing values in all variables were excluded from the analysis (see Figure 1 for details).

Flow chart of the study design.
Definition of exposure and outcome variables
RAR index: RAR = RDW (%)/serum albumin (g/dL). 28
Kidney stone disease
In the questionnaire section of the NHANES database, participants were asked ‘Have you ever had a kidney stone?’ and those who answered ‘yes’ were included in the kidney stone group, and those who answered ‘no’ were included in the non-kidney stone group. Those who answered ‘yes’ were included in the kidney stone group, and those who answered ‘no’ were included in the non-kidney stone group. 26 This diagnostic approach has been proven to be reliable and scientifically sound by numerous studies.29,30
Selection of covariates
In this study, we included age, gender, race, educational level, marital status, family income-to-poverty ratio (PIR), smoking, drinking, hypertension, diabetes mellitus, hyperlipidaemia, moderate physical activity, sedentary behaviour, body mass index (BMI), serum uric acid, serum creatinine and serum urea nitrogen as covariates. Smoking based on ‘at least 100 cigarettes in a lifetime?’ Identified as a smoker. Drinking based on ‘at least 12 alcoholic drinks a year?’ Identified as a drinker. Diabetes, according to ‘Doctor told you have diabetes?’ or ‘Take diabetic pills to lower blood sugar?’ or ‘HbA1c ⩾6.5%’ or ‘Fasting blood glucose ⩾7 mmol/L’ or ‘2-hour oral glucose tolerance test plasma glucose ⩾11.1 mmol/L’ is recognised as diabetes mellitus. 31 Hyperlipidaemia was based on total cholesterol (TC) levels ⩾ 200 mg/dL, triglyceride levels ⩾ 150 mg/dL, low-density lipoprotein (LDL) levels ⩾ 130 mg/dL, or high-density lipoprotein levels ⩽50 mg/dL for women and ⩽40 mg/dL for men Participants self-reporting the use of lipid-lowering medications were also categorised as hyperlipidaemic. 32 Moderate recreational activities are recognised according to ‘In a typical week, do {you/SP} continuously engage in any moderate-intensity exercise, fitness, or recreational activity that results in a slight increase in respiration or heart rate, such as brisk walking, cycling, swimming, or volleyball, for at least 10 minutes?’ Identified as moderate recreational activity.4,33 Sedentary activity is recognised as ‘yes’ based on ‘sitting for more than 5 hours a day’. 33
Statistical analysis
No sampling weights were applied in this study; all analyses were based on the unweighted study sample. Data for continuous variables were presented as means with standard deviations (mean ± SD); data for categorical variables were presented as categorical data by number (%), and comparisons between two groups were made using the chi-squared test. The relationship between the RAR index and kidney stones was analysed using logistic regression models. It was analysed using three models, where model I was the crude model without adjustment for any covariates. Model II is a partially adjusted model, adjusting for age, gender and race. Model III is a fully adjusted model adjusting for age, gender, race, education level, marital status, PIR, smoking, drinking, BMI, hypertension, moderate recreational activities, serum uric acid, serum creatinine, serum urea nitrogen, diabetes mellitus, sedentary activity and hyperlipidaemia. To further explore the dose–response relationship between the RAR index and the prevalence of kidney stones, we employed curve fitting, threshold effect analysis and restricted cubic spline analysis. Curve fitting provides an intuitive visualisation of the trend between the RAR index and the prevalence of kidney stones; threshold effect analysis identifies whether a turning point exists between the two by comparing the goodness-of-fit of two linear models; and restricted cubic spline analysis combines p-values from non-linear tests to assess the linear or non-linear relationship between the RAR index and the prevalence of kidney stones. We used subgroup analysis to assess the moderating effect of BMI on the relationship between the RAR index and kidney stone prevalence, and employed mediation analysis to quantify the proportion of BMI mediating this association. We employed sensitivity analysis to validate the stability of the results. All statistical analyses were performed using R software (version 4.21, R Foundation for Statistical Computing, Vienna, Austria), with a statistical significance threshold of p < 0.05.
Results
Characteristics of the participants
Table 1 demonstrates the baseline characteristics of patients with kidney stones associated with the RAR index. A total of 20,755 participants were included in the study, of whom 2041 (9.83%) had kidney stones. The results showed that the mean age of patients with kidney stones was significantly higher than that of patients without kidney stones (55.53 vs 48.84 years). A higher prevalence of kidney stones was observed in male non-Hispanic whites; more participants smoked, drank alcohol, had high blood pressure, diabetes mellitus, hyperlipidaemia, moderate recreational activities and sedentary activity, suggesting that unhealthy behaviours and populations with underlying medical conditions are more susceptible to developing kidney stones. In addition, the RAR index was significantly higher in the kidney stone group than in the non-kidney stone group.
Characteristics of participants.

Data are expressed as the mean ± SD, median (interquartile range) or percentage.
BMI, body mass index, RAR, ratio of red cell distribution width to serum albumin; RDW, red blood cell distribution width.
Association between RAR index and kidney stones
Table 2 shows the relationship between the RAR index and the prevalence of kidney stones analysed by several regression equation models. In model I, a positive correlation was identified between the RAR index and the prevalence of kidney stones (OR = 1.37, 95% CI: 1.27, 1.49). Following adjustment for multiple confounding variables using the model III method, a 23% increase in the prevalence of kidney stones was observed (OR = 1.23, 1.12–1.36), with a one-unit increase in the RAR index. The RAR index was trichotomised, and a positive correlation was identified between the RAR index and the prevalence of kidney stones in each model. Consequently, as the RAR index increased, so too did the prevalence of kidney stones. This finding was further validated by the outcomes of the trend test, which yielded a p-value for trend less than 0.001. The findings indicated a consistent and significant positive correlation between the RAR index and the prevalence of kidney stones, irrespective of the model employed.
Association of the RAR index with kidney stones.

Model I adjust for none. Adjust II model adjust for age, gender and race. Adjust III model adjust for age, gender, race, education level, marital status, family income-to-poverty ratio, smoking, drinking, BMI, hypertension, moderate recreational activities, serum uric acid, serum creatinine, serum urea nitrogen, diabetes mellitus, sedentary activity and hyperlipidaemia.
BMI, body mass index; RAR, ratio of red cell distribution width to serum albumin.
Non-linear association between RAR index and prevalence of kidney stones
In this study, a non-linear relationship between the RAR index and the prevalence of kidney stones was obtained using curve fitting, threshold effect methods and restricted cubic spline. As shown in Figure 2, there is an ‘S’ curve relationship between the RAR index and the prevalence of kidney stones. In this study, the inflection points in the curves were obtained by the threshold effect analysis method (see Table 3). The results of the standard linear model demonstrated an adjusted ratio (OR) of 1.23 (95% CI: 1.12, 1.36), thereby indicating that an increase in RAR is positively associated with the prevalence of kidney stones. When analysed using a two-stage linear model, the inflection point of the RAR index was determined to be 3.29. The adjusted OR for kidney stones was 1.87 (95% CI: 1.44, 2.41) when the RAR was lower than 3.29 and 1.06 (95% CI: 0.92, 1.21) when the RAR was higher than 3.29, indicating a significant reduction in risk. The log-likelihood ratio of the model was less than 0.001, further supporting the correlation between RAR and kidney stone prevalence. Restricted cubic spline results indicate a significant non-linear association between the RAR index and the prevalence of kidney stones (p for overall < 0.001, p for non-linear = 0.002). See Figure 2S for details.
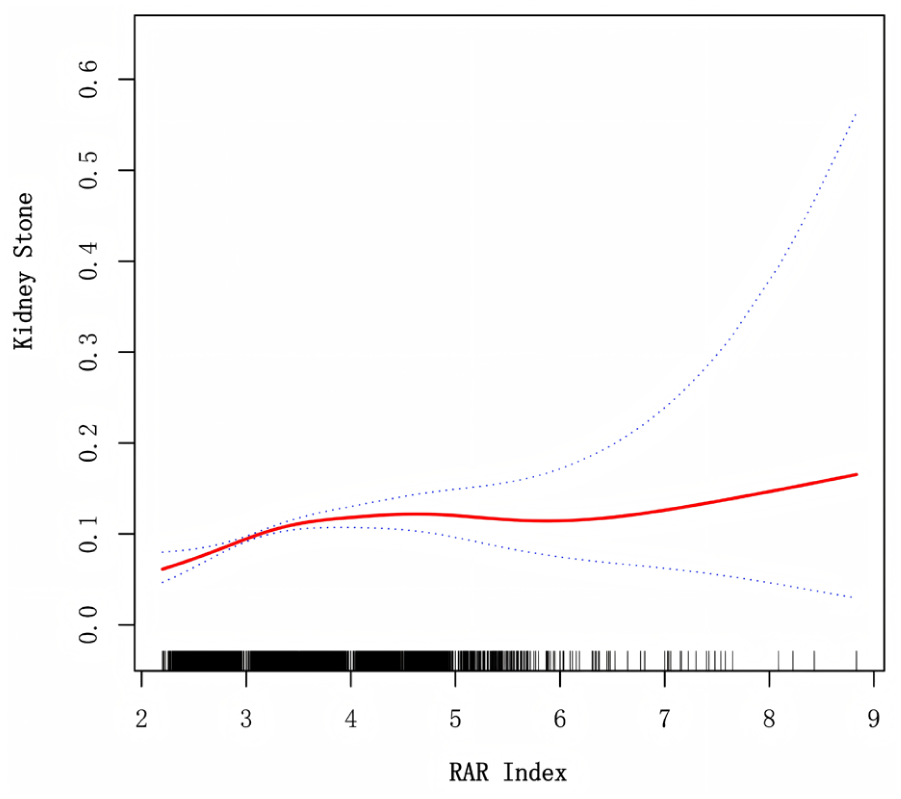
Dose–response relationship between RAR index and kidney stones. Curve fitting analysis was used to determine the non-linear relationship between RAR and the risk of kidney stone. The solid red line represents the fitted curve between RAR and risk of kidney stone, while the light red shaded area represents the 95% confidence interval of the curve. The analysis was further adjusted for age, sex, race, educational level, marital status, PIR, smoking, alcohol consumption, BMI, hypertension, moderate physical activity, serum uric acid, serum creatinine, serum urea nitrogen, diabetes mellitus, sedentary behaviour and hyperlipidaemia.
Threshold effect approach to analyse the relationship between RAR index and kidney stones.

Adjustment variables: age, gender, race, education level, marital status, PIR, smoking, drinking, BMI, hypertension, moderate recreational activities, serum uric acid, serum creatinine, serum urea nitrogen, diabetes mellitus, sedentary activity, hyperlipidaemia.
PIR, family income-to-poverty ratio; RAR, ratio of red cell distribution width to serum albumin.
Subgroup analysis
To further investigate the relationship between RAR index and kidney stones, we performed subgroup analyses and focused on the interactions between factors. In this study, age, gender, race, smoking, drinking, hypertension, diabetes, hyperlipidaemia, moderate activity intensity, sedentary activity and BMI variables were stratified. The findings demonstrated that the correlation between the RAR index and kidney stone exhibited stability and consistency across the majority of the subgroups (p > 0.05). Of particular note, a significant interaction was observed between BMI stratification and RAR index, after adjusting for confounders (p > 0.05). This finding indicates that the association between RAR index and the prevalence of developing kidney stones is more pronounced in the obese population (see Table 4 and Figure 3).
Subgroup analysis between RAR and kidney stones.
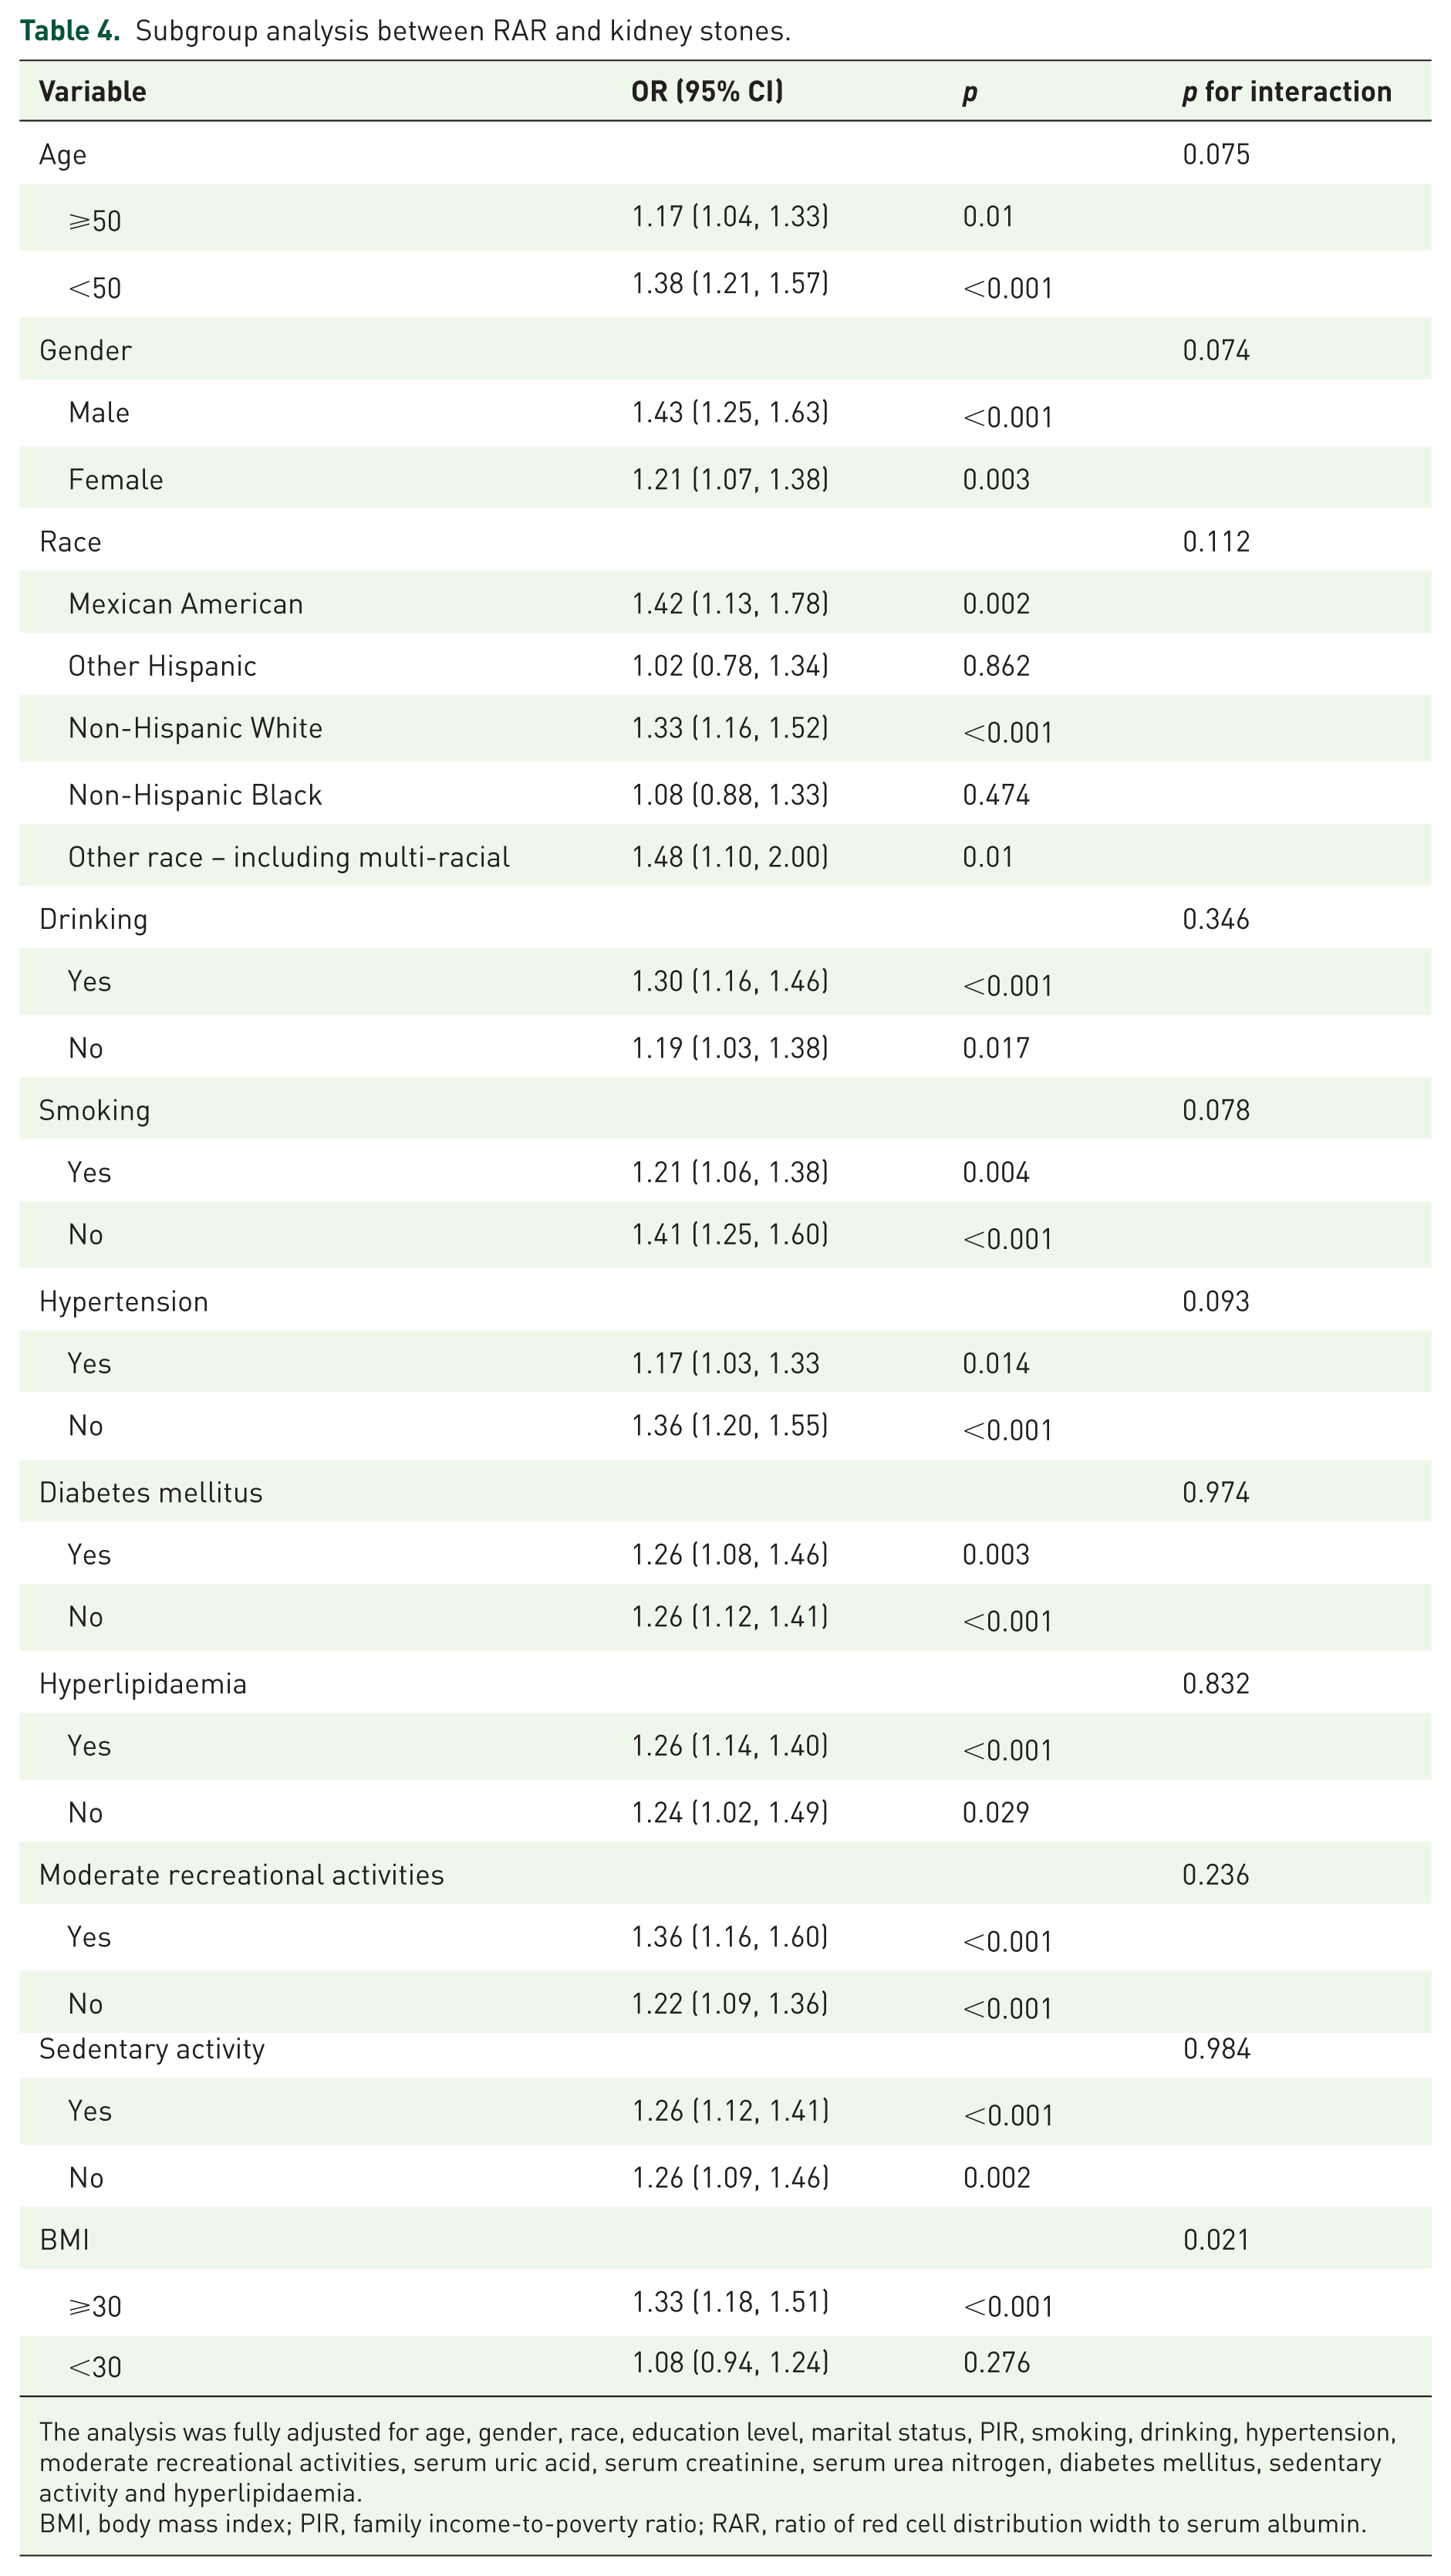
The analysis was fully adjusted for age, gender, race, education level, marital status, PIR, smoking, drinking, hypertension, moderate recreational activities, serum uric acid, serum creatinine, serum urea nitrogen, diabetes mellitus, sedentary activity and hyperlipidaemia.
BMI, body mass index; PIR, family income-to-poverty ratio; RAR, ratio of red cell distribution width to serum albumin.

Association between RAR and prevalence of kidney stones in obese and non-obese populations. The association between RAR and the risk of kidney stone prevalence in the presence or absence of obesity was analysed using a curve-fitting method. After full adjustment for confounders (age, sex, race, educational level, marital status, PIR, smoking, alcohol consumption, BMI, hypertension, moderate physical activity, serum uric acid, serum creatinine, serum urea nitrogen, diabetes mellitus, sedentary behaviour and hyperlipidaemia), there was a positive association between RAR and the prevalence of kidney stones in the obese population. In the non-obese population, there was an inverted U-shaped relationship between RAR and the risk of kidney stone prevalence.
Racial associations between obese and non-obese people and kidney stones
Table 5 shows the results of analysing the relationship between race and kidney stones using multiple logistic regression. Model II was adjusted for age and gender, and Model III was adjusted for the other covariates contained within Model II, which included education level, marital status, PIR, smoking, drinking, hypertension, diabetes mellitus, hyperlipidaemia, moderate activity intensity, sedentary activity, serum uric acid, serum creatinine and serum urea nitrogen. The study found that the obese population was statistically insignificant among Mexican Americans, using the non-obese population as a reference, suggesting that the presence or absence of obesity in this particular population does not increase the risk of kidney stone prevalence in this population. However, in the other four races (other Hispanic, non-Hispanic white, non-Hispanic black and other), the occurrence of obesity had a significant effect on this population, and the results were stable (p < 0.05), which demonstrates that the occurrence of obesity increases the prevalence of kidney stones in this population.
Race in obesity and kidney stones.
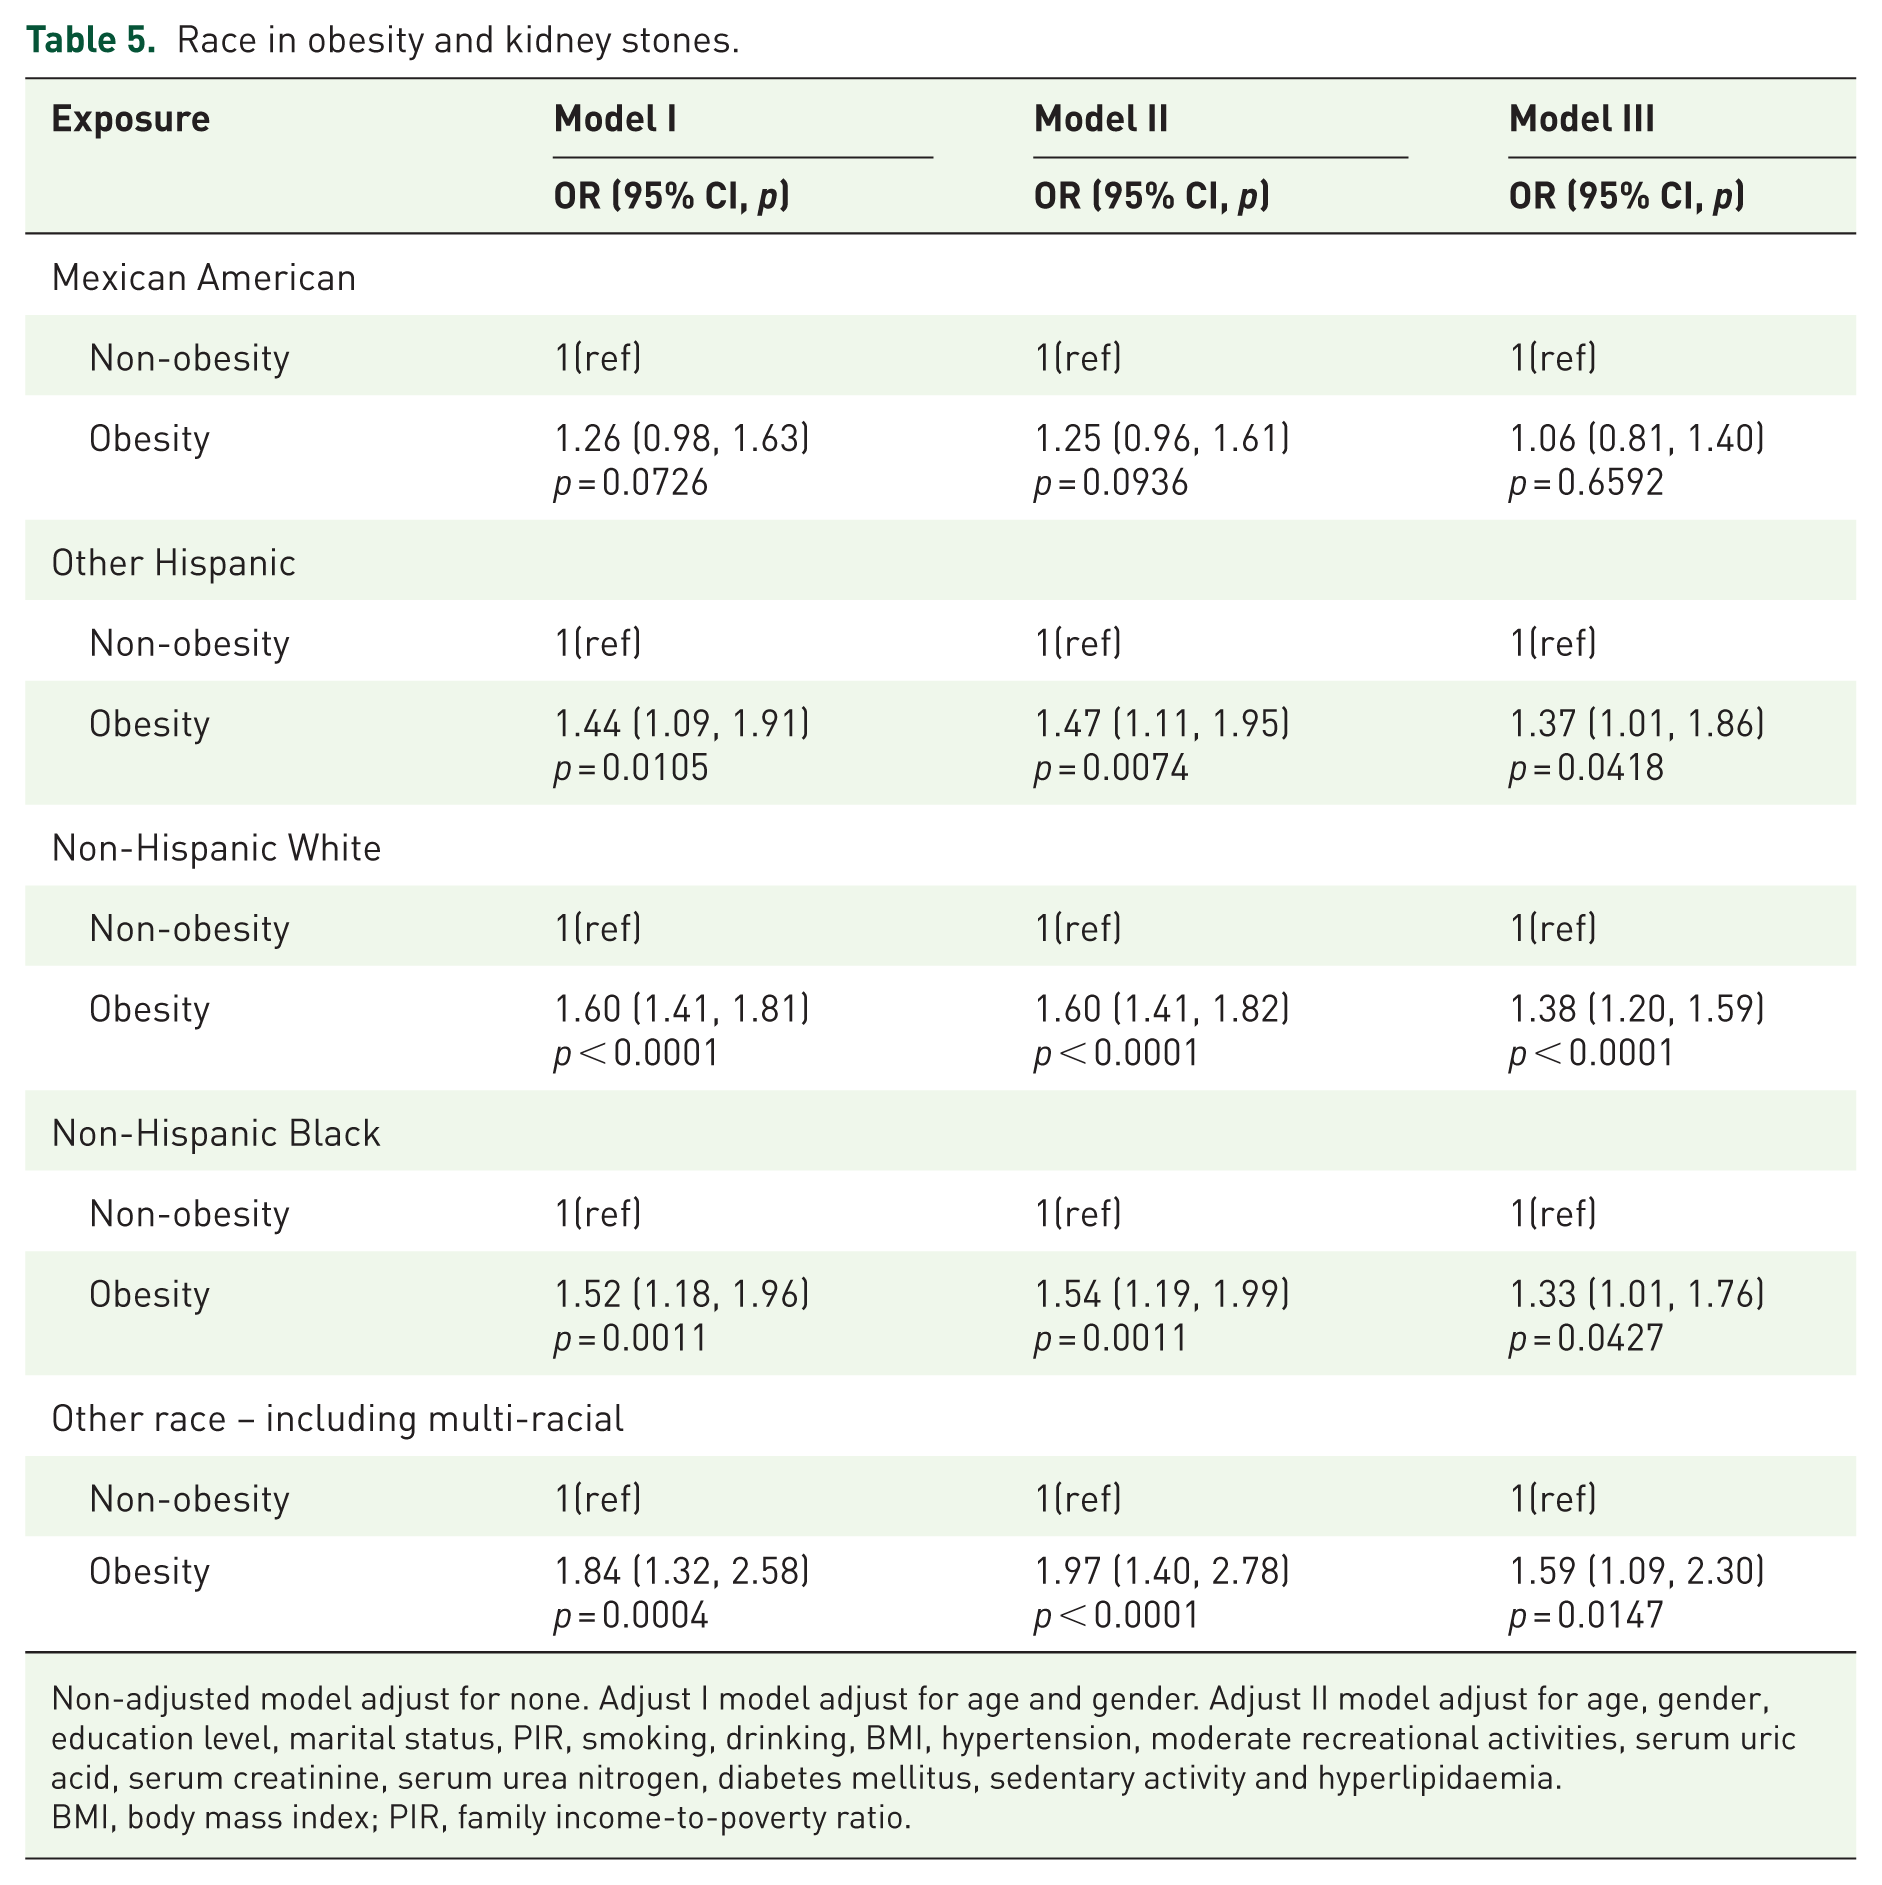
Non-adjusted model adjust for none. Adjust I model adjust for age and gender. Adjust II model adjust for age, gender, education level, marital status, PIR, smoking, drinking, BMI, hypertension, moderate recreational activities, serum uric acid, serum creatinine, serum urea nitrogen, diabetes mellitus, sedentary activity and hyperlipidaemia.
BMI, body mass index; PIR, family income-to-poverty ratio.
Mediation analysis
In this study, the relationship between RAR index and kidney stones was analysed using mediated effect analysis. The results in Figure 4 show that RAR levels may play a role in kidney stone disease through BMI as a mediating variable. BMI accounted for 24.5% of the mediated effect ratio.
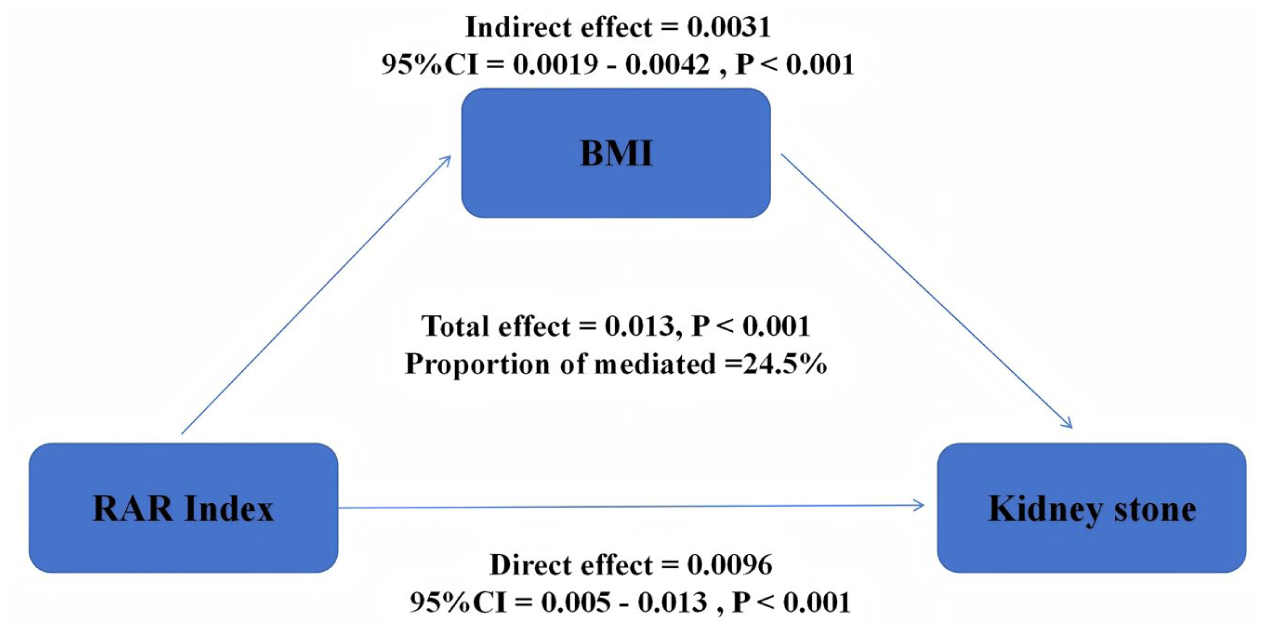
Mediation analysis.
Sensitivity analysis
In this study, to mitigate potential bias risks from various major comorbidities affecting the association between the RAR index and kidney stone prevalence, data were supplemented and excluded from the Supplemental Materials (see Figure 1S). Following the exclusion of chronic inflammatory diseases, advanced liver disease, advanced kidney disease and malignant tumours, a multivariate logistic regression model was established and a mediation effect analysis was conducted (see Table 1S and Figure 3S). The results of the sensitivity analysis indicate that the multivariate logistic regression model and mediation effect analysis, after excluding relevant diseases, maintain consistency and stability with the original findings.
Discussion
This study used information from the NHANES database to analyse the relationship between the RAR index and the prevalence of kidney stones. This study found a non-linear relationship between RAR index and prevalence of kidney stones, which is consistent with the findings of Wu et al. 26 On this basis, this study also found a significant interaction between BMI and the RAR index. This indicates a more significant effect of the RAR index on the prevalence of kidney stones in the obese population. To further investigate whether there is a specific population association between the presence of obesity and the development of kidney stones, we conducted analyses using multiple logistic regression modelling methods. The results show that the presence or absence of obesity does not affect the risk of kidney stone prevalence in the Mexican American population. Of note, in other Hispanic, non-Hispanic white, non-Hispanic black and other racial populations, obesity significantly increased the risk of kidney stone prevalence compared with non-obese populations, and the results were robust. The results of the mediation analysis suggested BMI as a mediating variable in the association between RAR index and kidney stones, suggesting that the effect of RAR index on kidney stones is mediated, both directly and indirectly, through BMI. These findings highlight the importance of obesity in the association between RAR index and kidney stones, and provide a reference point for clinical prevention or early intervention of kidney stone disease.
Through extensive literature reviews, we found that the current focus of research on the RAR index is primarily on assessing inflammatory disease prognosis and predicting mortality risk. Liu and Tingting et al. demonstrated that the RAR index is independently associated with depression and has a high predictive value for the condition.28,34 A large-scale cohort study revealed that the RAR index is independently associated with all-cause and specific mortality in patients with prehypertension and hypertension. 35 These studies emphasise the RAR index’s important clinical significance in disease prediction and mortality risk assessment. Furthermore, research has shown a significant positive correlation between inflammatory markers and the prevalence of kidney stones.29,36 The inflammatory immune response has been shown to promote the formation of Randall’s plaques and calcium stones.12,37 One study found that serum albumin may play a dual role in the mechanism of renal stone formation. 38 On the one hand, as a component of the stone matrix, albumin may promote renal stone formation through crystal aggregation and adhesion.39,40 On the other hand, albumin has anti-inflammatory and antioxidant effects and inhibits renal stone formation by binding to inflammatory factors to inhibit the inflammatory response and by scavenging reactive oxygen species (ROS) to regulate the balance of oxidative stress.41–43 Furthermore, the Composite Dietary Antioxidant Index and the oxidative balance score were found to significantly reduce kidney stone prevalence.44,45 In this study, an S-shaped non-linear relationship was found between the RAR index and kidney stones using curve-fitting analysis. Therefore, the inflection point between the two was obtained by threshold effect analysis. We found that when the RAR index was less than 3.29, there was a significant increase in the risk of developing kidney stones. This is in general agreement with the results of previous studies. 26 This may be because the RAR index is a reflection of the level of inflammation and the level of nutritional status of individuals.28,46
Building on previous findings of a non-linear relationship between the RAR index and kidney stones, the present study also found a significant interaction between obesity and the RAR index. This indicates a significant increase in the risk of kidney stones in an obese population. BMI, WHR and other indices of adiposity are independent risk factors for kidney stones, as numerous studies have shown.47–49 Therefore, we investigated the role of BMI between the RAR index and kidney stones. We used a mediated effects approach, and the results suggest that BMI plays a partial mediating effect role between RAR index and kidney stones, and the mediation utility ratio reached 24.5%. In addition, this study identified four races that significantly increased the risk of kidney stone prevalence in the obese population: other Hispanic, non-Hispanic white, non-Hispanic black and other races. These findings highlight the importance and complexity of BMI variables, especially in obese populations, in the association between RAR index and kidney stones. It is therefore particularly important to further investigate the mechanisms associated with how BMI, especially in obese populations, affects kidney stones.
Limitations
There are several limitations to this study. Firstly, the nature of this study is a cross-sectional study, which limits the results of this study from showing a causal relationship between exposure factors and outcomes. To confirm this, future studies could consider a large prospective study or a more refined Mendelian randomisation study to confirm. Second, based on the design plan of this study, most of the content was derived from the participants’ questionnaires, and participant recall bias affected the results to some extent. Third, all the data were obtained from the NHANES database, and these findings only indirectly reflect the basic situation of the US population, but may not be applicable to populations in other countries or regions. Finally, although we adjusted for as many confounders as possible, the presence of residual confounding cannot be ruled out. These residual confounders may also affect the final results.
Implications for future research
This study used a nationally representative sample to clarify the non-linear dose–response relationship between RAR index and the prevalence of kidney stones. It also quantified the role of BMI as a partial mediator. The study also found that four ethnic groups in the United States significantly increase the risk of kidney stones in obese populations. Based on these findings, future prospective cohort studies and Mendelian randomisation analyses should be conducted to confirm causal relationships and test whether lifestyle or drug interventions guided by the RAR index can reduce the incidence of kidney stones. In terms of pathogenic mechanisms, as BMI mediates 24.5% of the association between RAR and kidney stones, future studies should explore how obesity amplifies or promotes kidney crystal formation and whether targeted antioxidant or nutritional interventions (e.g. reducing RDW or increasing serum albumin) can inhibit crystal formation. Additionally, the observed racial heterogeneity—particularly the lack of significant effects among Mexican Americans—suggests the need for genome-wide or dietary pattern analyses to identify protective modifying factors. In terms of clinical prediction, integrating the RAR index with existing inflammatory and antioxidant markers could improve kidney stone prediction models. In summary, the findings of this study have clinical significance and provide a reference for the aforementioned future research directions.
Conclusion
The present study demonstrates a non-linear relationship between the RAR index and the prevalence of kidney stones, with an increased risk of kidney stone prevalence observed as the RAR index rises. In specific populations, obesity is associated with a significantly higher risk of developing kidney stones. Furthermore, the RAR index may influence kidney stone disease through BMI as a mediating variable. These findings provide valuable insights into the association mechanism between the RAR index and kidney stones, highlighting the potential role of BMI in this relationship.
Supplemental Material
sj-docx-1-tau-10.1177_17562872251397201 – Supplemental material for BMI mediates the association between red cell distribution width to serum albumin index and kidney stone risk: a population-based study
Supplemental material, sj-docx-1-tau-10.1177_17562872251397201 for BMI mediates the association between red cell distribution width to serum albumin index and kidney stone risk: a population-based study by Yuwen Zhong, Ganglin Kang, Jing He, Kaimin Xiao and Li Li in Therapeutic Advances in Urology
Footnotes
References
Supplementary Material
Please find the following supplemental material available below.
For Open Access articles published under a Creative Commons License, all supplemental material carries the same license as the article it is associated with.
For non-Open Access articles published, all supplemental material carries a non-exclusive license, and permission requests for re-use of supplemental material or any part of supplemental material shall be sent directly to the copyright owner as specified in the copyright notice associated with the article.