
Abstract
Background:
The aim of the study was to compare overall survival (OS) and unplanned hospital readmissions (UHRs) within 30 days between partial nephrectomy (PN) and radical nephrectomy (RN) for clinically localized T1 renal tumors.
Methods:
The National Cancer Database was queried to identify 51,018 patients who had undergone RN (n = 23,904; 46.9%) or PN (n = 27,114; 53.1%) for a cT1N0M0 renal mass from 2004 to 2013. OS and UHRs were compared using inverse probability of treatment weighted (IPTW)-adjusted Cox proportional hazards regression models.
Results:
For patients with a cT1a tumor, IPTW-adjusted analysis showed PN compared with RN was associated with improved OS (hazard ratio [HR] = 0.62; 95% confidence interval [CI] = 0.56, 0.67; p < 0.001) with a 5-year and 10-year IPTW-adjusted OS of 93.0% versus 88.2% and 78.1% versus 71.7%, respectively with no difference in UHR (odds ratio [OR] = 1.02; 95% CI = 0.90, 1.16; p = 0.727). For patients with a cT1b tumor, IPTW-adjusted analysis showed PN compared with RN to be associated with marginally improved OS (HR = 0.89; 95% CI = 0.82, 0.99; p = 0.025) with a 5-year and 10-year IPTW-adjusted OS of 85.3% versus 84.3% and 70.8% versus 63.6%, respectively, with more UHRs for PN (OR = 1.43; 95% CI = 1.19, 1.72; p < 0.001).
Conclusions:
PN compared with RN was associated with a significant survival benefit for patients with a cT1a renal mass and a modest survival benefit for patients with a cT1b renal mass. PN should be offered over RN when feasible despite a marginal increase in UHRs for PN of cT1b tumors. Randomized controlled trials are necessary to confirm these findings.
Introduction
Overall, there were 64,000 new diagnoses of kidney cancer in the USA in 2016. 1 Increased use of radiographic imaging has led to a significant proportion of these masses being detected incidentally. Over the course of little more than a decade, by the early to mid-1990s, the incidental detection rate rose from roughly 10% to 60%. 2 With that dramatic rise came a shift towards smaller masses; T1a tumors now represent 27–41% of new diagnoses. 3
In their 2009–2010 guidelines, the American Urological Association and the European Association of Urology began recommending partial nephrectomy (PN) where technically feasible, as the standard of care for T1 masses.4,5 Since the early 2000s, the rate of PN for tumors up to 7 cm in size (T1) has doubled, reaching 50–90% for T1a masses and 25–50% for T1b masses. 6
Factors that favor PN include better cardiovascular outcomes and similar oncologic control. 7 In a meta-analysis of PN compared with radical nephrectomy (RN) for T1b and T2 tumors, Mir and colleagues found improved cancer-specific survival (CSS) and overall survival (OS) with PN. 8 Further, in a large National Cancer Database (NCDB) analysis of T1b and T2 tumors, Venkatramani and colleagues found improved OS in patients with T1b renal tumors who underwent PN. 9 It is important to note that conflicting survival data exist. 10 The only randomized controlled trial to compare PN with RN in patients with a solitary renal mass smaller than 5 cm showed improved OS with RN (European Organization for Research and Treatment of Cancer 30904), however, the study failed to reach its accrual target and was closed prematurely, 11 leaving the debate unresolved.
Perioperative complications are known to increase with PN, the major risks being hemorrhage and fistulae, 12 with risk increasing as complexity increases. 13 Complications are a substantial contributing factor to unplanned hospital readmissions (UHRs), a major source of preventable healthcare spending, and a possible surrogate for quality of care, 14 a secondary measure of PN versus RN outcomes.
In an attempt to elucidate a benefit between PN and RN, we analyzed the NCDB from 2004 to 2013 in the largest comparison of OS and UHR data for T1a and T1b renal cell carcinoma.
Materials and methods
Data source and eligibility criteria
The American College of Surgeons’ NCDB of 390,884 patients with renal cancer was queried to identify 249,430 patients who underwent PN or RN as definitive treatment from 2004 to 2013. Patients with clinical T2-4, N1, or M1 renal cell carcinoma, or missing clinical stage data were excluded (n = 165,515). Patients with renal tumors excised bilaterally or a horseshoe kidney (n = 94), or receiving additional treatments (n = 471) were excluded. In addition, 24,632 patients with a concurrent or prior cancer diagnosis were excluded.
A complete case analysis was conducted and patients with missing data on baseline characteristics, survival, or readmission were excluded (n = 7700) since inverse probability of treatment weighting (IPTW) cannot be performed on missing data.
After exclusion, there were 51,018 eligible patients with 23,904 (46.9%) patients who had undergone RN and 27,114 (53.1%) patients who underwent PN for a clinically localized T1 renal mass.
Treatment groups
The 51,018 PN and RN patients included in this study were compared separately for T1a (n = 33,943; 66.5%) and T1b renal masses (n = 17,075; 33.5%).
Primary outcomes
Our primary outcomes were OS (months from diagnosis) and UHRs (within 30 days of discharge).
Statistical analysis
Baseline characteristics were compared between PN and RN patients using the chi-square tests of independence and independent samples t tests. IPTW was employed to account for selection bias and confounding by the following demographic and clinical covariates: age, sex, race, Charlson score, primary insurer, income/education based on zip code, residence type (metropolitan, urban, or rural), distance to the hospital, treatment facility type (academic, community, or integrated network), tumor size (cm), and tumor laterality. IPTW is a well-described method for balancing covariates when comparing treatment groups in observational studies. 15 UHR was compared using IPTW-adjusted binary logistic regression models and OS was compared using IPTW-adjusted Cox proportional hazards regression models. The IPTW-adjusted Kaplan–Meier (IPTW-KM) method was used to estimate 5-year and 10-year OS. Logistic regression analysis was performed to confirm balance on covariates after IPTW adjustment. Factors associated with treatment (p < 0.15) after adjustment were further adjusted for with inclusion into the multivariable IPTW regression model. IPTW results were evaluated with a naïve model-based variance estimator and with a robust sandwich-type variance estimator, 16 which is optimal when sample sizes are large. 17
Two sensitivity analyses of OS were performed: the first on 35,162 patients who underwent nephrectomy before 2012 (before NCDB recorded modality of operation), and the second on 35,949 patients adjusted for pathologic factors (T and N stage, margins, and grade).
Statistical analysis was performed using R, version 3.1.3, with a significance level set at 0.05.
Results
Demographic and tumor-specific characteristics
Patient demographic data associated with T1a and T1b renal masses, and tumor-specific characteristics for T1a and T1b masses are presented in Tables 1 and 2, respectively. Among those with a T1a renal mass, 66.9% (n = 22,695) underwent PN and 33.1% (n = 11,248) underwent RN. Among those with a T1b renal mass, 25.9% (n = 4419) underwent PN and 74.1% (n = 12,656) underwent RN. From 2004 to 2013, the proportion of cases performed by PN increased from 44.9% to 77.9% for T1a tumors (p < 0.001) and from 10.6% to 34.2% for T1b tumors (p < 0.001) (Figure 1).
Demographic data for patients who underwent partial nephrectomy or radical nephrectomy for T1a and T1b renal tumors.

PN, partial nephrectomy; RN, radical nephrectomy; SD, standard deviation.
Tumor-specific data between patients undergoing partial nephrectomy or radical nephrectomy for T1a and T1b renal tumors.

PN, partial nephrectomy; RN, radical nephrectomy; SD, standard deviation.

Over time utilization of partial nephrectomy and radical nephrectomy.
Patients who underwent RN for both the T1a and T1b groups were significantly older (p < 0.001), with a higher Charlson score (p < 0.001 T1a, p = 0.047 T1b), a larger tumor (p < 0.001), and were more likely to be men (p < 0.001), with a lower income (p < 0.001), a shorter time to surgery (p < 0.001), and treated at a community hospital (p < 0.001).
OS for T1a tumors
Median follow up for the patients with a T1a was 46.0 months (interquartile range [IQR]: 26.9–69.5 months; range: 0.0–142.6 months). In the unadjusted analysis PN was associated with a lower hazard of death (hazard ratio [HR] = 0.48; 95% confidence interval [CI] = 0.45, 0.52; p < 0.001).
The IPTW-adjusted Cox proportional hazards regression models also showed PN associated with improved OS (HR = 0.62; 95% CI = 0.57, 0.68; p < 0.001). This was confirmed when further adjusting for factors associated with treatment modality (PN versus RN) after IPTW adjustment (HR = 0.62; 95% CI = 0.56, 0.67; p < 0.001). The 5-year and 10-year IPTW-KM OS estimates for PN compared with RN were 93.0% versus 88.2% and 78.1% versus 71.7%, respectively (Figure 2). Of note, the OS benefit associated with PN increased over time until 5 years postnephrectomy, remaining proportional thereafter.

Inverse probability of treatment weighting Kaplan–Meier (IPTW-KM) plots of overall survival between partial nephrectomy and radical nephrectomy for cT1a tumors.
In the sensitivity analysis of 23,351 patients who underwent nephrectomy before 2012, results were consistent with a benefit for PN (HR = 0.65; 95% CI = 0.59, 0.72; p < 0.001). In the sensitivity analysis of 23,789 patients with T1a adjusted for all covariates including pathologic factors, results similarly favored PN (HR = 0.67; 95% CI = 0.59, 0.74; p < 0.001). The above analyses remained consistent with both a naïve model-based variance estimator and a robust sandwich-type variance estimator.
OS for T1b tumors
Median follow up for patients with T1b was 44.5 months (IQR: 25.7–68.1 months; range: 0.0–141.5 months). In the unadjusted analysis PN was associated with a lower hazard of death (HR = 0.77; 95% CI = 0.69, 0.86; p < 0.001).
The IPTW-adjusted Cox proportional hazards regression also showed PN associated with improved OS (HR = 0.89; 95% CI = 0.82, 0.99; p = 0.025), but when applying a more robust sandwich-type variance estimator, statistical significance was lost (HR = 0.89; 95% CI = 0.79, 1.02; p = 0.106). The 5-year IPTW-KM estimates of OS for PN and RN were 85.3% and 84.3%, and in fact, remained similar until 9 years postnephrectomy, thereafter diverging. The 10-year IPTW-KM estimates for PN and RN were 70.8% and 63.6%, respectively (Figure 3).
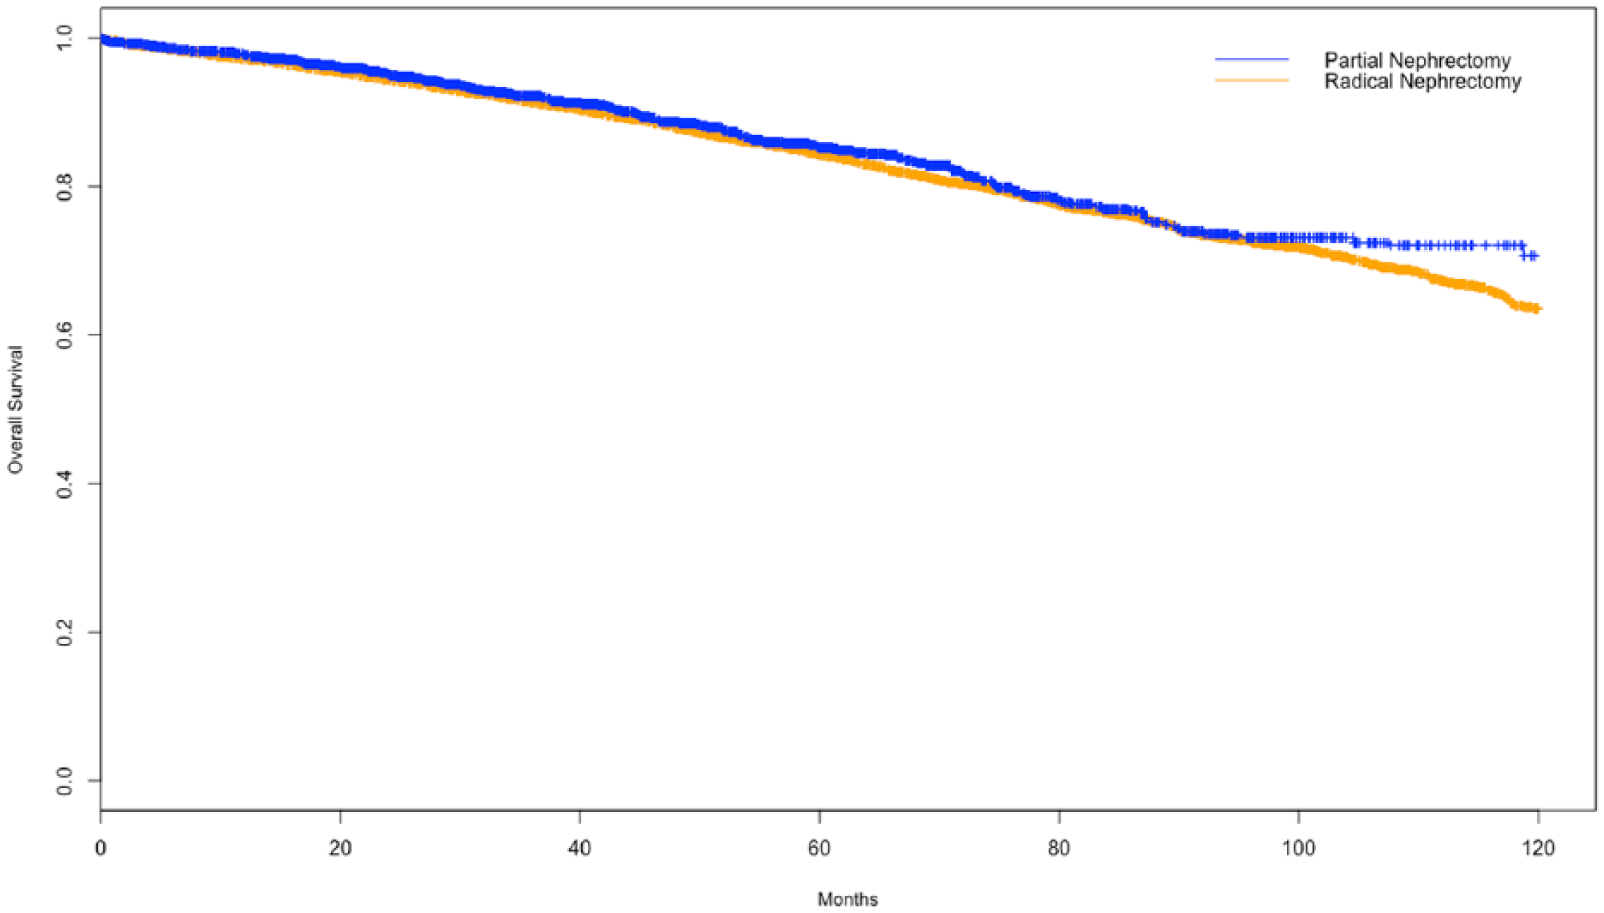
Inverse probability of treatment weighting Kaplan–Meier (IPTW-KM) plots of overall survival between partial nephrectomy and radical nephrectomy for cT1b tumors.
In the sensitivity analysis of 11,811 patients undergoing nephrectomy pre-2012, results consistently favored PN with both the naïve (HR = 0.89; 95% CI = 0.81, 0.99; p = 0.038) and robust sandwich-type variance estimators (HR = 0.89; 95% CI = 0.76, 1.04; p = 0.134). A sensitivity analysis adjusting for all covariates showed only nonsignificant trends towards improved OS with PN with both the naïve (HR = 0.90; 95% CI = 0.81, 1.01; p = 0.072) and robust sandwich-type variance estimators (HR = 0.90; 95% CI = 0.77, 1.07; p = 0.232).
UHR for T1a and T1b masses
T1a tumors showed no preferential benefit with PN or RN on unadjusted analysis (3.0% versus 3.3%; odds ratio [OR] = 0.90; 95% CI = 0.79, 1.02; p = 0.111). This was confirmed by IPTW-adjusted binary logistic regression (OR = 1.01; 95% CI = 0.89, 1.15; p = 0.820), and with further adjustment for factors still associated with PN compared with RN after IPTW adjustment (OR = 1.02; 95% CI = 0.90, 1.16; p = 0.727).
T1b tumors were associated with higher UHRs with PN on unadjusted analysis, (4.4% versus 2.8%; OR = 1.59; 95% CI = 1.33, 1.90; p < 0.001). This was confirmed on IPTW-adjusted binary logistic regression (OR = 1.43; 95% CI = 1.19, 1.72; p < 0.001).
Discussion
Patients receiving any form of nephrectomy for a localized renal mass virtually eliminated the risk of kidney cancer-specific mortality; 18 however, the ideal form of nephrectomy remains controversial. In this study, we found that PN is associated with improved OS for both T1a and T1b tumors, albeit with an increased risk of UHR with T1b tumors only.
This is the largest retrospective cohort of patients with localized renal cell carcinoma, both T1a and T1b, to compare PN with RN. It specifically shows a distinct OS benefit for PN for T1a tumors, and a modest benefit in T1b tumors. It is our speculation that the decreasing OS benefit of PN for T1a (HR = 0.62) to T1b (HR = 0.89) is due to the reduced amount of preserved healthy nephrons. Support for this idea comes from PN for benign lesions, where the preservation of glomerular filtration rate (GFR) and subsequent decreased incidence of chronic kidney disease correlates strongly with improved OS. 19
For T1a tumors, our results are consistent with studies by Tan and colleagues and Weight and colleagues.20,21 Tan and colleagues showed improved OS with PN for T1a tumors with an 11.8% survival increase at 5 years, however, it failed to show any differences in CSS. 20 Moreover, on multivariate analysis, Weight and colleagues found an OS benefit for PN for both T1a and T1b tumors. 21 For T1b tumors, our results are consistent with prior literature.8,9,21,22 Mir and colleagues examined 21 case-controlled studies comparing PN with RN for T1b and T2 tumors, and found an increased CSS and OS benefit for PN. 8 Our study did not include a subgroup analysis of T2 tumors due to the small numbers available (PN 212 versus RN 1792).
The only randomized controlled trial to compare OS for PN and RN favored RN, 11 however, large studies since have suggested that PN for T1a/T1b renal masses can be safely performed without compromising oncologic outcomes and may lead to improved OS.8,9,21,23 With increased utilization of minimally invasive techniques, 24 even tumors up to 10 cm are performed with nephron-sparing surgery (NSS). 25 In our analysis we appreciated increasing utilization of PN and decreasing utilization of RN for all subtypes of localized renal masses from 2004 to 2013 (Figure 1).
NSS is not without pitfalls. While PN for T1b tumors improved OS, a marginal increase in UHR was found (4.4% for PN versus 2.8% for RN). PN is known to increase the risks of perioperative complications such as increased hemorrhage, operative time, and length of stay 14 and may lead to UHR.25,26,27 Previous studies have shown that UHR is approximately 4.5% for PN and 5.2% for RN; minimally invasive approaches decrease UHR and any postoperative Clavien III–IV complications increase UHR. 28 In a multi-institutional study of robotic PN for T1a versus T1b renal tumors, PN for T1b tumors was associated with a longer operative time and increased intraoperative and postoperative complications in a univariate analysis; multivariate analysis confirmed the findings of increased postoperative complications and length of stay in T1b tumors. 29 In our series, an increased risk of UHR is only seen with T1b tumors, suggesting that a larger tumor may parallel a more difficult operation and may contribute to increased perioperative complications and UHR. PN on a larger tumor increases the risk of postoperative hemorrhage due to a more difficult renorrhaphy, and urinary leak secondary to greater involvement of the collecting system. Despite the 1.5% increased rate of UHR with PN for T1b tumors, the IPTW-KM projected 10-year survival benefit in our study approaches 7%. As such, PN should still be pursued in the properly selected patient.
Interestingly, in T1a tumors a difference in IPTW-KM OS estimates for PN compared with RN was seen at 5 years, and remained proportional thereafter, whereas for T1b tumors, the OS for PN only began to diverge at 9 years. This supports the notion that survival benefit may be more dependent on the amount of healthy nephrons (greater in a T1a PN than T1b) than on oncologic control.
There are several limitations to this study. First, this is a retrospective analysis and thus cannot exclude selection bias. Our data are matched and compared with IPTW adjustment in an attempt to mitigate factors leading to such bias. Second, a large proportion of the initial patient population had missing clinical grade information (33%, 83,915/249,430) and was immediately excluded from our study. Moreover, the NCDB does not include information regarding recurrence free survival and CSS. Previous studies have demonstrated improved OS for PN without associated changes in CSS. 20 Renal function and surgeon selection bias are also not accounted for by the NCDB and may contribute to the differences in OS. As such, improvements in OS based on a decreased change in GFR in patients who underwent PN can only be inferred from the data since postoperative renal function is also lacking in the NCDB. Furthermore, we acknowledge that a follow-up time of 46 months for T1a and 44.5 months for T1b may be insufficient to implement changes to existing protocols; however, our follow-up time is similar to existing studies (42–49 months).21,22,30 Finally, the NCDB does not include a cause for UHR, therefore our study cannot comment on the degree of perioperative complication or whether complications were surgical or medical in nature. It is conceivable that healthier patients were more likely to have UHR for surgical reasons, while more comorbid patients had UHR secondary to medical complications.
Future analyses should include a stratification analysis for modality of operation (open, laparoscopic, or robotic), which may determine if the mode of operation can translate to a decrease in complications and UHRs, as demonstrated in previous studies. 31 A subanalysis of PN compared with RN based on hospital volume may be helpful in testing the hypothesis that experienced centers in NSS, such as tertiary referral centers, have lower rates of UHR.
Conclusion
PN for T1a and T1b tumors conferred an OS benefit compared with RN with a marginal increase in UHRs for T1b tumors. PN should continue to be utilized for T1a tumors, and when technically feasible, for T1b tumors as well despite the slightly increased UHRs.
Footnotes
Funding
This research received no specific grant from any funding agency in the public, commercial, or not-for-profit sectors.
Conflict of interest statement
The authors declare no conflicts of interest in preparing this article.