
Abstract
Background:
Post-stroke epilepsy (PSE) is a common complication after ischemic stroke (IS) that worsens prognosis and quality of life. The atherogenic index of plasma (AIP) is an emerging biomarker for cardiovascular and metabolic diseases, but its link with PSE is unknown.
Objective:
This study aimed to evaluate the association between AIP and the risk of PSE in patients with IS.
Design:
A multicenter retrospective cohort study.
Methods:
We analyzed data from 21,459 IS patients in Southwest China (2017–2023). AIP was calculated as log10(triglycerides/high-density lipoprotein cholesterol) from baseline lipid profiles. The primary outcome was PSE occurrence within 1 year post-stroke. The relationship between AIP and PSE was assessed using multivariable logistic regression and restricted cubic spline (RCS) models, adjusting for demographic, clinical, and laboratory covariates. Subgroup and sensitivity analyses were performed to test robustness.
Results:
Among 21,459 participants, 936 (4.36%) developed PSE. Higher AIP levels were significantly associated with increased PSE risk. After full adjustment, each 1-standard deviation increase in AIP was associated with a 1.56-fold higher PSE risk (odds ratio = 1.56; 95% confidence interval: 1.44–1.68). Patients in the highest AIP quartile (Q4) had a 3.89-fold increased risk compared to the lowest quartile (Q1). RCS analysis revealed a nonlinear dose-response relationship, with an inflection point at AIP = 0.193. Subgroup analyses indicated stronger associations in patients without diabetes, coronary artery disease, or specific subcortical lesions.
Conclusion:
Elevated AIP is independently associated with an increased risk of PSE in IS patients, following a nonlinear dose-response pattern. AIP may serve as a valuable clinical tool for PSE risk stratification, facilitating early identification and preventive management. Prospective studies are warranted for validation.
Keywords
Introduction
Stroke is the second most common cause of death worldwide, accounting for nearly 7 million fatalities annually, and represents the third leading cause of disability. 1 It presents a substantial challenge to healthcare systems across the globe, particularly in low- and middle-income countries, where 90% of all stroke-related deaths and disabilities occur, alongside a rising incidence of stroke, in contrast to high-income nations. 2 Stroke is primarily categorized into ischemic stroke (IS) and hemorrhagic stroke, with IS being the predominant form, responsible for approximately 80% of all cases. 3 Post-stroke epilepsy (PSE) is a major sequela of IS and one of the most common forms of acquired epilepsy, significantly impairing both functional prognosis and quality of life in affected individuals.4,5 PSE may exacerbate cognitive, psychiatric, and physical deficits linked to cerebrovascular disease and related disorders.6–8 Therefore, accurate prediction and early intervention for PSE are crucial for preserving patients’ quality of life. Multiple studies have sought to identify clinical risk factors associated with PSE and to develop prognostic tools, such as the PSEiCARe 9 and SeLECT 10 scores. Nevertheless, the identification of reliable biomarkers for PSE in patients with IS remains challenging due to several unresolved issues. The etiology of PSE is multifactorial, involving not only stroke-related and post-stroke mechanisms but also the brain’s pre-existing condition prior to the stroke. 11
The atherogenic index of plasma (AIP), defined as the logarithmic transformation of the molar ratio of triglycerides (TG) to high-density lipoprotein cholesterol (HDL-c), was proposed as a novel lipid parameter by Dobiasova and Frohlich 12 in 2001. AIP effectively combines TG and HDL-c levels, serving as both a marker of dyslipidemia and a robust indicator of arterial plaque formation. It has also been associated with the risk of several disorders, including obstructive sleep apnea, 13 coronary artery disease, 14 insulin resistance, 15 and fatty liver disease. 16 Recently, a large retrospective cohort study demonstrated a significant correlation between sustained elevation of AIP and an increased risk of IS. 17 Moreover, another investigation indicated that among individuals with cardiovascular-kidney-metabolic syndrome in stages 0–3, AIP levels were positively correlated with stroke risk, especially in more advanced stages. 18 Thus, elevated AIP is closely linked to a heightened propensity for stroke. However, large-scale cohort studies examining the relationship between AIP and the incidence of PSE after stroke are currently lacking.
In light of the growing burden of PSE and the pressing need for effective preventive measures, 19 this study aims to evaluate the predictive utility of AIP for the development of PSE across different populations. By analyzing a large cohort from the Chongqing region in southwestern China, we endeavor to determine whether AIP can serve as a significant biomarker for stratifying the risk of PSE. Elucidating this relationship may yield valuable insights into the mechanisms underpinning PSE and support timely interventions for high-risk patients. Furthermore, the results may inform the development of more targeted preventive strategies, thereby helping to alleviate the public health impact of PSE.
Methods
Study population
This is a secondary analysis study based on data from a public database. Data were obtained from the Dryad Digital Repository (https://datadryad.org/). The data were shared by Professor Yongbing Deng, Dr Jinxin Liu, and their colleagues.
As stipulated in Dryad’s Terms of Service, researchers are permitted to use these data for secondary analysis, exploration of new hypotheses, and optimization of data usage. Detailed information regarding the study design has been described in a previous publication. 20 Briefly, this multicenter retrospective study was carried out in the Chongqing area of southwestern China. Data collection took place across four medical institutions: Chongqing Emergency Center, Qianjiang Central Hospital, Bishan District People’s Hospital, and Yubei District Traditional Chinese Medicine Hospital, between June 2017 and July 2023.
Inclusion criteria comprised patients aged 18–90 years who were hospitalized due to acute IS. Exclusion criteria included: (1) a history of stroke or transient ischemic attack; (2) pre-existing epilepsy-associated conditions such as traumatic brain injury, intracranial tumors, or cerebral vascular malformations; (3) prior diagnosis of epilepsy or use of antiseizure medications for either prophylaxis or comorbid indications (e.g., migraine or psychiatric disorders); (4) death within 72 h after stroke onset.
Diagnostic criteria for PSE
PSE is diagnosed by either two or more unprovoked seizures occurring after the acute phase of stroke or, according to updated International League Against Epilepsy criteria, a single unprovoked seizure with high recurrence risk. 21
Calculation of AIP
The AIP was calculated using the following formula: AIP = log10[TG (mmol/L)/HDL-C (mmol/L)]. 12
Data collection
Baseline data included general information, comorbidities covering cardiovascular disorders (e.g., hypertension, atrial fibrillation, and coronary atherosclerosis), metabolic conditions (such as diabetes mellitus, hyperlipidemia, hyperuricemia, and hypoproteinemia), renal impairments (including uremia and elevated creatinine), and thrombotic events (e.g., deep vein thrombosis (DVT)). Neuroanatomical involvement in acute IS encompassed cortical regions (frontal, parietal, temporal, occipital, and insular lobes, along with subcortical areas, paraventricular zones, and centrum semiovale), deep structures (basal ganglia, thalamus, and internal capsule), posterior fossa components (brainstem and cerebellum), vascular territories (anterior, middle, and posterior cerebral arteries; vertebral and basilar arteries; anterior and posterior circulations), and atherosclerotic lesions (plaques in the common, internal, and external carotid arteries). Laboratory parameters consisted of hematologic indices (platelet count, white and red blood cell counts, APTT, prothrombin time, thrombin time, international normalized ratio, D-dimer, and fibrinogen), metabolic profiles (HbA1c, TG, LDL-C, HDL-C, lactate, anion gap, and total carbon dioxide), hepatic and renal markers (aspartate aminotransferase, alanine aminotransferase (ALT), bilirubin, albumin, urea, creatinine, and uric acid), as well as inflammatory and cardiac indicators (C-reactive protein, creatine kinase, creatine kinase MB (CK-MB), lactate dehydrogenase, and hydroxybutyrate dehydrogenase). All laboratory parameters were measured from the initial laboratory tests performed on the first day following hospital admission for stroke.
Outcome definition
The primary outcome was the development of PSE within 1 year after the index stroke.
Logistic regression models
To assess the association between AIP and PSE, we built logistic regression models treating AIP both as a continuous variable and a categorical variable based on quartiles. Results are presented as odds ratios (ORs) with accompanying 95% confidence intervals (CIs). Three sequentially adjusted models were developed: Model 1 was unadjusted; Model 2 included adjustments for age, gender, uremia, DVT, hydrocephalus, hypoproteinemia, HbA1c, ALT, creatinine, albumin, and LDL-C; and Model 3 further incorporated hypertension, coronary artery disease, atrial fibrillation, fatty liver disease or steatosis, diabetes, cerebral herniation, and anterior and posterior circulations.
Restricted cubic spline models
To explore the shape of the relationship between AIP and PSE, we applied restricted cubic spline (RCS) models, with model selection guided by the Bayesian Information Criterion. The Likelihood Ratio Test was used to evaluate nonlinear associations. Knots were placed at the 5th, 35th, 65th, and 95th percentiles of the AIP distribution, using the median value as reference. RCS models were constructed for the overall study population, patients with different NIHSS score, and subgroups stratified by involvement of the cerebral cortex (i.e., frontal, parietal, temporal, occipital, or insular lobes) versus non-cortical regions. All RCS models were adjusted for the same covariates as in logistic regression Model 3.
Subgroup analyses
To examine the consistency of the association between AIP and PSE incidence across different subpopulations, we performed subgroup analyses. Subgroups were defined by the presence of DVT, diabetes, coronary artery disease, and involvement of specific neuroanatomical structures including the basal ganglia, paraventricular region, centrum semiovale, middle cerebral artery (MCA) territory, common carotid artery plaque, subcortical lobe, and anterior or posterior circulations. Interaction terms between AIP (as a continuous variable) and each subgroup variable were introduced into logistic regression models to test for effect modification. All subgroup models were adjusted for the same set of covariates as in Model 3, with the exception of the stratification variable itself to avoid over-adjustment.
Statistical analysis
All data processing and statistical analyses were conducted using R software (version 4.5.0). A two-sided p-value <0.05 was considered statistically significant. Baseline characteristics were summarized according to AIP quartiles and by the presence or absence of PSE. Continuous variables are presented as medians (interquartile range) for non-normally distributed data and means (standard deviation (SD)) for normally distributed data. Categorical variables are expressed as numbers and percentages. Between-group differences for categorical variables were assessed using the χ2 test, while those for continuous variables were compared using analysis of variance or the Kruskal–Wallis test, as appropriate. We have followed the STROBE Guidelines when preparing the manuscript.
Results
Participant characteristics
Of the 21,459 patients with acute IS stratified by AIP quartiles, notable differences were observed between those in the highest quartile (Q4, n = 5209) and the lowest quartile (Q1, n = 6926), as detailed in Table 1. Patients in Q4 were significantly younger than those in Q1 (mean age 64.5 vs 68.6 years) but exhibited markedly higher metabolic risk profiles, including a greater prevalence of diabetes (61.4% vs 12.7%), hypertension (86.3% vs 52.6%), and nonalcoholic fatty liver disease (41.2% vs 5.4%); all differences were statistically significant (p < 0.001). Laboratory analyses revealed that Q4 patients had elevated levels of LDL cholesterol (2.76 vs 2.59 mmol/L), reduced HDL-c (1.13 vs 1.35 mmol/L), higher uric acid (370.0 vs 323.5 μmol/L), and increased lactate concentrations (2.68 vs 2.39 mmol/L), with all p-values below 0.001. Neuroimaging findings indicated less frequent cortical involvement, with fewer temporal lobe (1.6% vs 3.7%) and parietal lobe lesions (2.2% vs 3.5%), yet a higher incidence of posterior circulation abnormalities, such as vertebral artery (4.8% vs 1.8%) and basilar artery lesions (1.7% vs 0.3%); all comparisons were statistically significant (p < 0.001). Baseline characteristics stratified by PSE status are presented in Table S1.
Baseline characteristics stratified by AIP quartiles.

Values are expressed as number (percentage) or mean ± SD.
AIP, atherogenic index of plasma; ALT, alanine aminotransferase; AST, aspartate aminotransferase; CI, confidence interval; CK, creatine kinase; CK-MB, creatine kinase MB; CRP, C-reactive protein; DVT, deep vein thrombosis; HBDH, hydroxybutyrate dehydrogenase; HDL-c, high-density lipoprotein cholesterol; INR, international normalized ratio; LDH, lactate dehydrogenase; LDL-c, low-density lipoprotein cholesterol; PLT, platelet count; PT, prothrombin time; RBC, red blood cell count; TG, triglycerides; TT, thrombin time; WBC, white blood cell count.
Logistic regression models for predicting the occurrence of PSE based on the AIP
Logistic regression analyses were conducted to examine the associations between AIP and PSE (Table 2). A total of 936 (4.36%) participants experienced a PSE. The number of PSE events from Q1 to Q4 was 142, 166, 375, and 253, respectively. Regression analyses confirmed a significant association between AIP and PSE risk. In model 1, each 1-unit increase in AIP was associated with a 7.49-fold rise in PSE risk (OR, 7.49 (95% CI, 4.73–11.81)). Model 2 indicated a 14.30-fold increase in PSE risk per additional AIP unit (OR, 14.30 (95% CI, 8.30–24.52)). Model 3 demonstrated a 25.61-fold increase in PSE risk for every 1-unit rise in AIP (OR, 25.61 (95% CI, 14.40–45.40)). However, each 1-SD increase in AIP was associated with a 1.32-fold rise in PSE risk (OR, 1.32 (95% CI, 1.24–1.40)) in Model 1. Model 2 indicated a 1.44-fold increase in PSE risk per additional 1-SD (OR, 1.44 (95% CI, 1.33–1.55)). Model 3 demonstrated a 1.56-fold increase in PSE risk for every 1-SD rise in AIP (OR, 1.56 (95% CI, 1.44–1.88)). Furthermore, when AIP was categorized into quartiles to evaluate its relationship with PSE incidence, the fully adjusted model (model 3) yielded adjusted ORs for Q2, Q3, and Q4 compared to Q1 of 2.35 (95% CI, 1.86–2.98), 4.49 (95% CI, 3.65–5.56), and 3.89 (95% CI, 3.06–4.96), respectively. These results indicate that participants in Q2, Q3, and Q4 had 2.35-, 4.49-, and 3.89-fold higher risks of PSE, respectively, relative to those in Q1.
Association between the AIP and PSE incidence in patients with ischemic stroke.

Model 1: unadjusted for any covariates. Model 2: adjusted for age, gender, uremia, DVT, hydrocephalus, hypoproteinemia, HbA1c, ALT, creatinine, albumin, LDL-c. Model 3: Model 2 + further adjusted for hypertension, coronary artery disease, atrial fibrillation, fatty liver disease or steatosis, diabetes, cerebral herniation, anterior circle, posterior circle.
AIP, atherogenic index of plasma; ALT, alanine aminotransferase; CI, confidence interval; DVT, deep vein thrombosis; LDL-c, low-density lipoprotein cholesterol; OR, odds ratio; PSE, post-stroke epilepsy; SD, standard deviation.
Nonlinear relationships
RCS regression with multivariable adjustments was employed to examine dose-response relationships between AIP and PSE prevalence across 11 subgroups: the overall baseline population, and subgroups based on lesion location (non-frontal lobe, frontal lobe, non-parietal lobe, parietal lobe, non-temporal lobe, temporal lobe, non-occipital lobe, occipital lobe, non-insular lobe, and insular lobe). Figure 1 showed the dose-response association between AIP and PSE risk in IS patients using multivariable-adjusted RCS regression. It illustrates a nonlinear relationship between AIP and PSE incidence in the entire population, with an inflection point at 0.193 (p for nonlinear <0.001). Additionally, a significant nonlinear association was observed between AIP and PSE risk in participants with cerebral cortex lesions (p < 0.001 and p for nonlinear = 0.032; Figure 2(a)) and in those without cerebral cortex lesions (p < 0.001 and p for nonlinear <0.001; Figure 2(b)). Finally, we also found a significant nonlinear association was observed between AIP and PSE risk in participants with NIHSS score between 5 and 14 (p < 0.001 and p for nonlinear <0.001; Figure 3(a)) and in those with NIHSS score greater than or equal to 14 (p < 0.001 and p for nonlinear <0.001; Figure 3(b)).
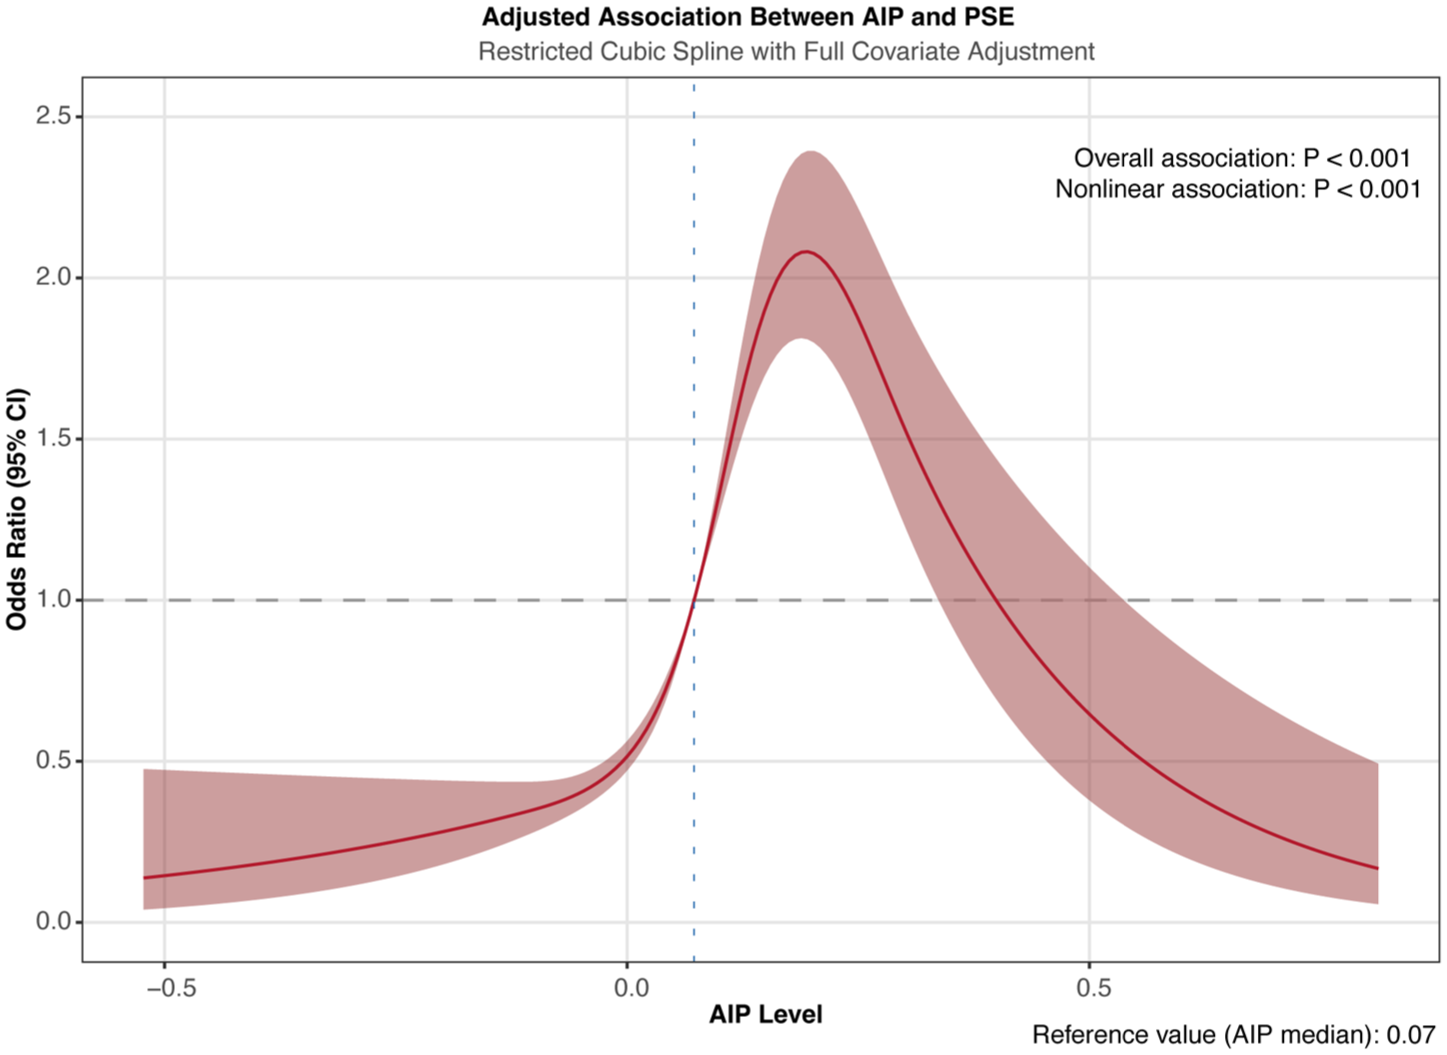
Dose-response association between AIP and PSE risk in acute ischemic stroke patients using multivariable-adjusted RCS regression. The model was adjusted for age, gender, uremia, DVT, hydrocephalus, hypoproteinemia, HbA1c, ALT, creatinine, albumin, LDL-c, hypertension, coronary artery disease, atrial fibrillation, fatty liver disease or steatosis, diabetes, cerebral herniation, anterior circle, posterior circle.

RCS analysis of AIP and PSE incidence in IS patients stratified by cortical involvement. (a) Cortical involvement. (b) Non-cortical involvement. Both models were adjusted for age, gender, uremia, DVT, hydrocephalus, hypoproteinemia, HbA1c, ALT, creatinine, albumin, LDL-c, hypertension, coronary artery disease, atrial fibrillation, fatty liver disease (steatosis), diabetes, cerebral herniation, anterior circulation involvement, and posterior circulation involvement.
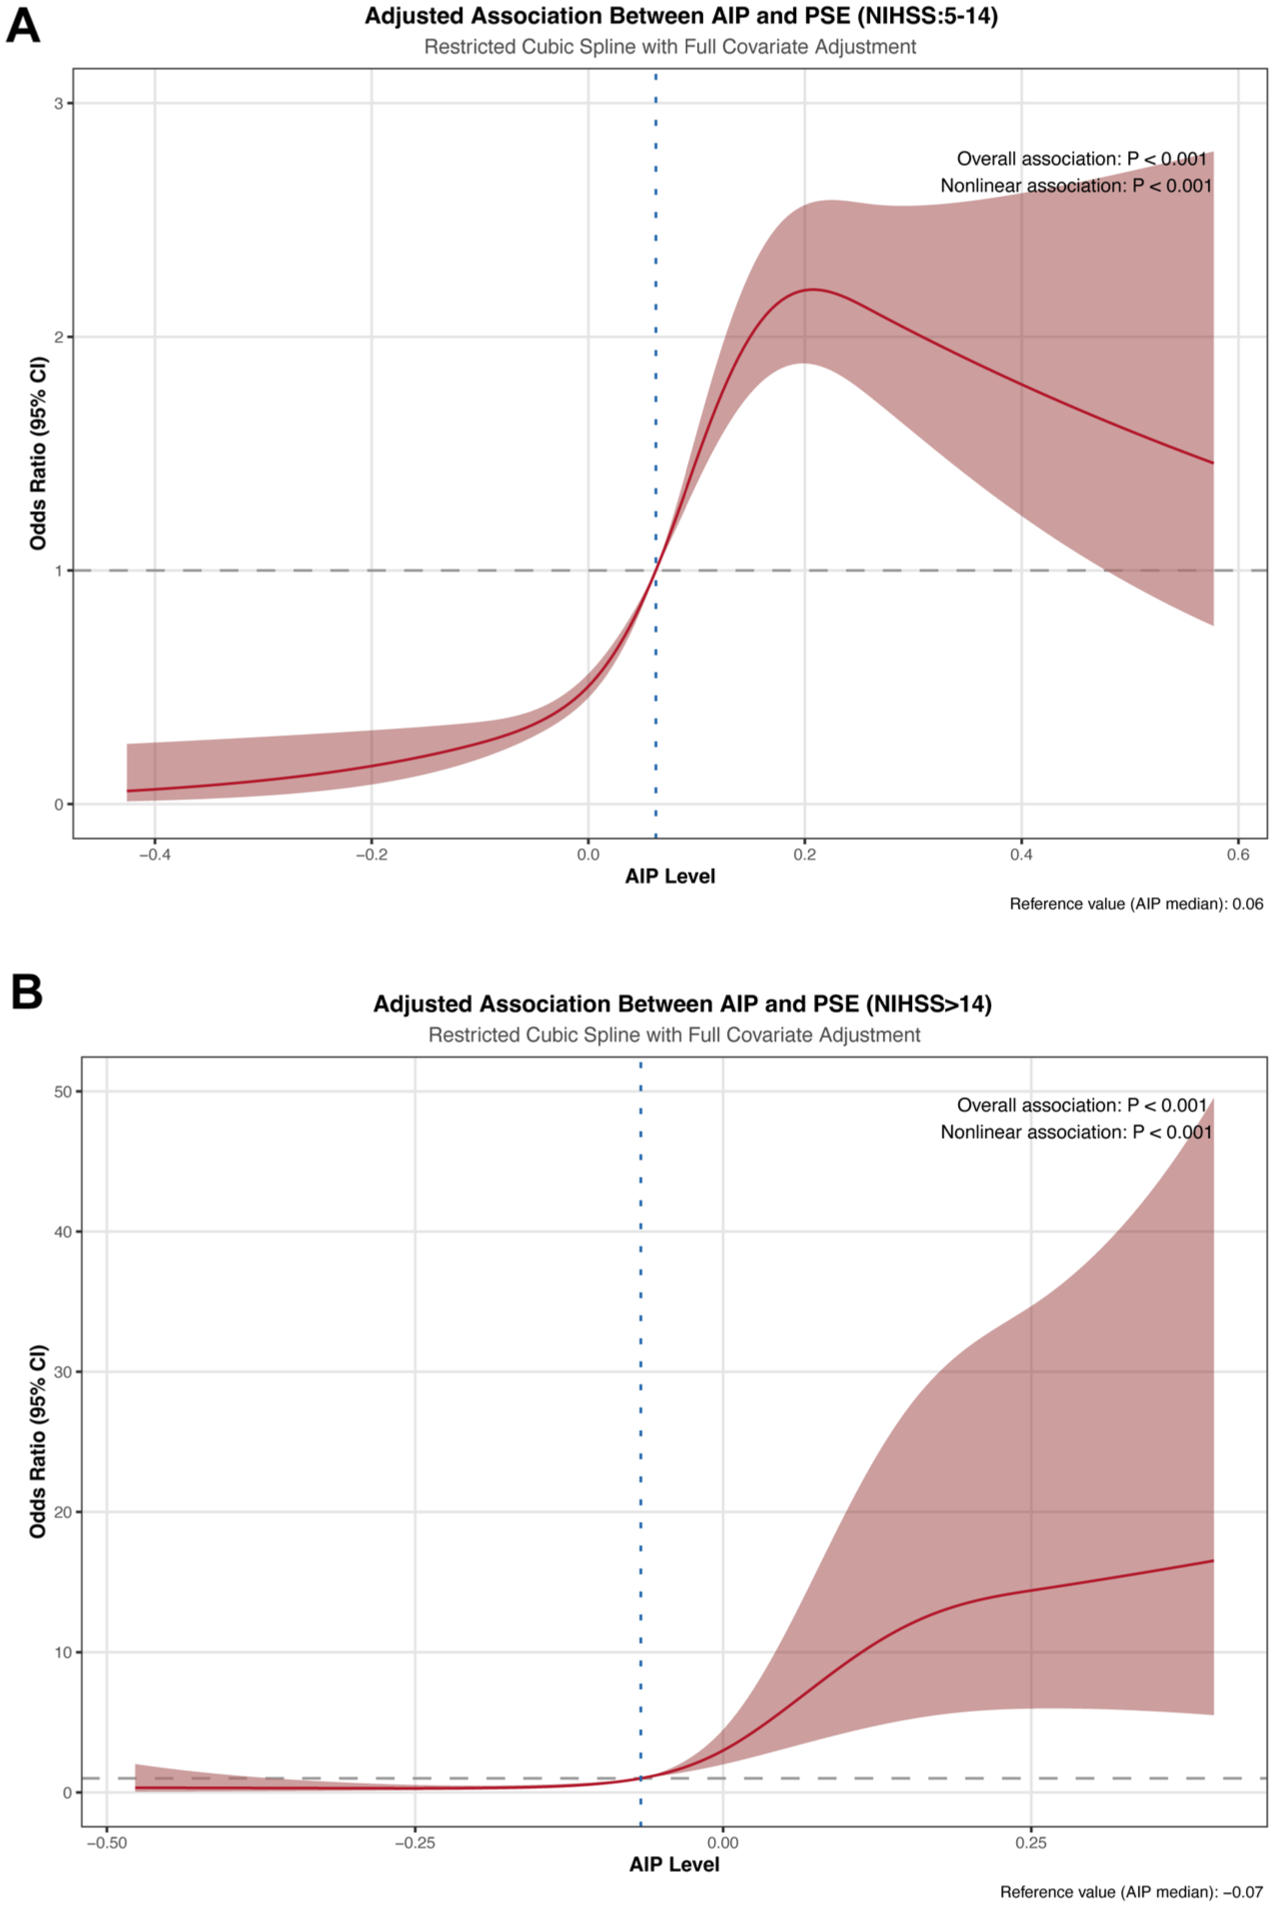
RCS analysis of AIP and PSE incidence in IS patients stratified by NIHSS score. (a) NIHSS score between 5 and 14. (b) NIHSS score greater than or equal to 14. Both models were adjusted for age, gender, uremia, DVT, hydrocephalus, hypoproteinemia, HbA1c, ALT, creatinine, albumin, LDL-c, hypertension, coronary artery disease, atrial fibrillation, fatty liver disease (steatosis), diabetes, cerebral herniation, anterior circulation involvement, and posterior circulation involvement.
Subgroup analysis
Subgroup analyses were performed to evaluate the relationship between AIP and PSE across various patient characteristics (Table S2). A significantly increased risk of PSE associated with higher AIP was evident in most subgroups. Particularly strong associations were observed in patients without pre-existing diabetes (OR, 84.46; 95% CI, 39.16–182.61; p < 0.001), without coronary artery disease (OR, 80.65; 95% CI, 39.30–166.21; p < 0.001), and without lesions in the basal ganglia (OR, 32.17; 95% CI, 17.65–58.49; p < 0.001) or subcortical lobe (OR, 52.94; 95% CI, 27.50–101.77; p < 0.001). In contrast, the association was markedly attenuated and non-significant in patients with diabetes (OR, 2.64; 95% CI, 0.95–7.37; p = 0.064) or coronary artery disease (OR, 2.72; 95% CI, 0.96–7.69; p = 0.059), as supported by significant interaction p-values (p-interaction <0.001 for both). Similarly, no significant positive association was found in patients with lesions specifically located in the basal ganglia (OR, 1.74; 95% CI, 0.20–15.28; p = 0.618; p-interaction = 0.014), subcortical lobe (OR, 1.86; 95% CI, 0.50–6.95; p = 0.357; p-interaction < 0.001), or anterior cerebral circulation (OR, 1.45; 95% CI, 0.24–8.78; p = 0.686; p-interaction = 0.037). A significant association persisted irrespective of DVT status, common carotid artery plaque presence, paraventricular or centrum semiovale lesion location, or posterior circulation involvement, though the magnitude of association varied. The significant interaction terms suggest that the effect of AIP on PSE risk meaningfully differs based on diabetes status, coronary artery disease status, and specific stroke lesion locations (basal ganglia, subcortical lobe, anterior cerebral circulation).
Sensitivity analysis
To evaluate the robustness of the findings, we conducted four sensitivity analyses. First, after excluding all participants with lesions located in the basal ganglia and reanalyzing the data, the conclusions remained unchanged (Table S3). Second, the results were not materially altered after excluding all participants with lesions in the internal capsule (Table S4). Third, upon removing all participants with brainstem lesions and reanalyzing the data, the conclusions were consistent (Table S5). Fourth, after excluding participants with epencephalic lesions and reanalyzing, no substantial changes in the results were observed (Table S6).
Discussion
To our knowledge, this study represents the first investigation into the association between AIP and PSE risk in individuals with acute IS within 1 year. The AIP levels demonstrated a robust association with an increased risk of PSE, including among patients irrespective of whether the stroke involved the cerebral cortex or not; moreover, this relationship persisted significantly even after comprehensive adjustment for covariates. Notably, AIP exhibited a nonlinear association with PSE occurrence. This observation underscores the complexity of AIP as a predictive measure for PSE risk, highlighting the necessity for more nuanced analyses tailored to individual IS conditions.
Population-based cohort studies have consistently linked PSE with worsened recovery outcomes, heightened neurological impairments, and increased risks of mortality, recurrent stroke, and dementia.22–24 In patients with PSE, persistent neurological deterioration has been correlated with the severity and frequency of late seizures following stroke. A recent study indicated that 69% of PSE patients experience mild to moderate cognitive impairment. 25 A meta-analysis encompassing 177,929 stroke survivors, with a mean follow-up of 4 years, identified PSE as an independent predictor of all-cause mortality after stroke. 26 This evidence emphasizes the urgent need for effective prognostic and diagnostic markers to enhance preventive care in high-risk populations. Although numerous cohort studies have assessed associations between various clinical and laboratory indicators and PSE risk, accurate predictive factors remain to be established. Currently, limited evidence supports the predictability of AIP for PSE risk in IS individuals. Consequently, we conducted a comprehensive analysis using this large-scale retrospective dataset.
Numerous investigations have established that atherosclerosis serves as a primary cause of stroke, with dyslipidemia acting as a key driving factor for atherosclerosis.27,28 AIP, which integrates TG and HDL-c, functions as a comprehensive indicator for evaluating stroke risk. 29 Elevated AIP typically reflects an increase in TG levels and/or a decrease in HDL-c levels. Previous research has demonstrated that statin use, particularly during the acute phase, may reduce the risk of post-stroke early-onset seizures. 30 Additionally, statin treatment might prevent the progression of initial post-stroke seizure-induced neurodegeneration into chronic epilepsy. 31 Interestingly, elevating HDL-c levels has been proposed as a therapeutic strategy to mitigate epilepsy risk. 32 These findings reinforce the relevance of therapeutic approaches aimed at reducing TG levels and/or increasing HDL-c levels to lower AIP, thereby contributing to PSE prevention and management. Our study, involving 21,459 Chinese participants with IS, revealed that individuals in the fourth quartile (Q4) of baseline AIP exhibited a 3.89-fold higher PSE risk compared to those in the first quartile (Q1). Furthermore, prior to covariate adjustment, each 1-SD increase in AIP was associated with a 1.32-fold elevation in PSE risk. After full adjustment for covariates, each 1-SD increase in AIP corresponded to a 1.56-fold rise in PSE incidence risk. This suggests that even a mild elevation in AIP could substantially influence PSE risk. Thus, this association underscores AIP’s potential as a predictive biomarker for PSE risk, especially for preventive strategies and management within 1 year in the IS population. Crucially, our study also identified a significant nonlinear relationship between AIP and PSE events, with a threshold value of 0.193; when baseline AIP was below this threshold, a pronounced positive correlation with PSE risk emerged. This underscores the critical importance of monitoring AIP levels for accurate PSE risk assessment.
Brain involvement in IS is considered closely associated with PSE.33,34 Multiple studies have indicated that cortical involvement stands out as one of the strongest predictors of PSE.11,33 In a case-control study focused on cortical strokes, De Reuck et al. 35 discovered that infarction in the temporal or parietal branches of the MCA was significantly more prevalent in patients experiencing late seizures compared to non-seizure counterparts. A retrospective IS study reported PSE incidence of 15.5% in the MCA group, compared to only 6.2% in the non-MCA group. 36 Involvement of the occipital lobe, 37 as well as temporal lobe or perirolandic cortex involvement, 38 were also identified as independent PSE risk factors. Hence, specific cortical locations in IS may contribute to epileptogenesis. However, subcortical locations may similarly influence epileptogenesis by activating specific brain networks integrated with the functional connectivity of basal ganglia and cerebellum. 39 In the current investigation, a significant nonlinear relationship was observed between AIP and PSE risk among participants with cerebral cortex involvement (p < 0.001 and p for nonlinear = 0.032). Yet, consistent results emerged in participants without cerebral cortex involvement (p < 0.001 and p for nonlinear < 0.001). Therefore, the predictive effect of AIP on PSE demonstrates high robustness, regardless of cortical cerebral infarction involvement.
The NIHSS score is a widely utilized tool for evaluating the severity, neurological deficits, and prognosis of patients with IS. It is well-established that the NIHSS score is correlated with an elevated risk of PSE in individuals with IS, with studies showing that a score >14 is an independent predictor of PSE development (HR, 2.98; 95% CI, 1.57–5.67). 40 This association is further supported by machine learning approaches identifying NIHSS as a positive predictor of epilepsy after IS. 41 In this study, a significant nonlinear relationship was observed between the AIP and the risk of PSE among participants with NIHSS scores ranging from 5 to 14 (p < 0.001; p for nonlinearity < 0.001). Similarly, consistent results were found in participants with NIHSS scores of 14 or higher (p < 0.001; p for nonlinearity < 0.001). These findings align with existing research showing stroke severity as a key determinant of PSE risk. Consequently, the predictive capacity of AIP for PSE risk exhibits considerable robustness across patients with varying NIHSS scores, suggesting that incorporating metabolic biomarkers like AIP with established clinical measures such as NIHSS may enhance risk stratification for PSE in IS patients.
Subgroup analyses yielded further insights into the complex relationship between AIP and PSE risk across diverse patient profiles. The consistently strong positive correlation observed in most subgroups—particularly among individuals without diabetes, coronary artery disease, or specific subcortical lesions—underscores AIP’s significant independent predictive value. Conversely, the markedly attenuated association in patients with pre-existing diabetes or coronary artery disease suggests that shared underlying pathophysiological mechanisms, such as chronic inflammation or metabolic dysregulation, may overshadow or modulate the lipid-specific risk conveyed by AIP. Similarly, the absence of a significant association in individuals with basal ganglia, subcortical, or anterior circulation lesions highlights the potential impact of lesion location on epileptogenesis, possibly involving distinct networks or mechanisms less reliant on lipid metabolism. These interaction effects reinforce that while AIP serves as a potent predictor, its efficacy may be context-dependent, necessitating integrated assessment with clinical comorbidities and neuroimaging findings to optimize PSE risk stratification.
Although the precise mechanism linking AIP to PSE in the IS population remains unclear, it might be explained by several interconnected pathways. A high AIP, indicative of atherogenic dyslipidemia, is intrinsically linked to a state of systemic inflammation, characterized by elevated pro-inflammatory cytokines such as IL-6, TNF-α, and CRP. 42 This peripheral inflammatory response can exacerbate post-stroke neuroinflammation and contribute to blood-brain barrier (BBB) dysfunction.43,44 A compromised BBB allows increased influx of serum components and peripheral immune cells into the brain parenchyma, which can activate microglia and promote a pro-epileptogenic inflammatory environment. 45 Within the central nervous system, these inflammatory mediators (e.g., IL-1β, TNF-α, high-mobility group box 1 protein) directly modulate neuronal excitability by altering synaptic transmission and impairing astrocytic glutamate uptake, thereby significantly lowering the seizure threshold.46,47 Furthermore, the dyslipidemia itself may directly impair endothelial function and weaken the BBB’s structural integrity. 48 Nevertheless, further studies are essential to clarify the specific role of AIP in these underlying mechanisms.
The primary innovation of this study lies in its systematic evaluation of the AIP-PSE relationship in IS patients from Southwest China, addressing a significant research gap. Unlike prior investigations focusing primarily on alternative biomarkers, our research provides novel insights using a simple, accessible indicator that could influence treatment outcomes. Second, we uncovered a dose-response relationship between AIP and PSE incidence across diverse brain involvement types in IS patients, offering a visual representation to aid clinicians in comprehending this association. Third, these findings carry substantial clinical implications for early identification of high-risk individuals and formulation of preventive strategies.
Despite these innovations, several limitations warrant acknowledgment. First, one primary constraint is the potential for selection bias inherent in the retrospective design, which may undermine the findings’ validity. Reliance on historical data can introduce data collection inaccuracies, as noted in previous studies emphasizing the challenges of retrospective analyses in capturing patient outcomes reliably. Second, the use of chronic medications (e.g., statins) prior to the stroke and other unmeasured confounding factors could influence the occurrence of PSE. 49 As these potential confounders were not adjusted for in our analysis, residual confounding may exist, potentially affecting the stability and internal validity of our results. Third, our study focused specifically on the relationship between AIP and PSE. While evidence suggests that other lipid profile indicators may also influence PSE, 50 we did not incorporate variables or ratios such as LDL/HDL in our analysis. Fourth, the sample size may lack representativeness of broader populations, limiting the results’ generalizability. Fifth, the data collection process could involve inherent inaccuracies, underscoring the importance of rigorous validation methods to mitigate such errors. Future research should prioritize larger, more diverse cohorts and prospective designs to strengthen robustness and applicability.
Conclusion
This large multicenter study demonstrates a significant and independent association between elevated AIP and increased PSE risk following IS, revealing a nonlinear relationship. The association endured after extensive covariate adjustment but was modulated by specific comorbidities and lesion locations. AIP serves as a practical biomarker for PSE risk stratification, potentially facilitating early identification and preventive management for high-risk stroke patients. Prospective studies are essential to confirm its clinical utility and elucidate the underlying mechanisms.
Supplemental Material
sj-docx-1-tan-10.1177_17562864261416789 – Supplemental material for Association of atherogenic index of plasma and post-stroke epilepsy in patients with ischemic stroke: a multicenter retrospective study in China
Supplemental material, sj-docx-1-tan-10.1177_17562864261416789 for Association of atherogenic index of plasma and post-stroke epilepsy in patients with ischemic stroke: a multicenter retrospective study in China by Xichen Wan, Ye Xiong, Peng Wang, Maoqi Wang, Lianghua Huang and Yunliang Tang in Therapeutic Advances in Neurological Disorders
Supplemental Material
sj-docx-2-tan-10.1177_17562864261416789 – Supplemental material for Association of atherogenic index of plasma and post-stroke epilepsy in patients with ischemic stroke: a multicenter retrospective study in China
Supplemental material, sj-docx-2-tan-10.1177_17562864261416789 for Association of atherogenic index of plasma and post-stroke epilepsy in patients with ischemic stroke: a multicenter retrospective study in China by Xichen Wan, Ye Xiong, Peng Wang, Maoqi Wang, Lianghua Huang and Yunliang Tang in Therapeutic Advances in Neurological Disorders
Footnotes
Acknowledgements
We extend our gratitude to Professor Yongbing Deng (Department of Neurosurgery, Chongqing Emergency Medical Center, Chongqing University Central Hospital, School of Medicine, Chongqing University, Chongqing, China), Dr Jinxin Liu (Department of Neurosurgery, Chongqing Emergency Medical Center, Chongqing University Central Hospital, School of Medicine, Chongqing University, Chongqing, China), and their colleagues for generously sharing their data.
Declarations
Supplemental material
Supplemental material for this article is available online.
References
Supplementary Material
Please find the following supplemental material available below.
For Open Access articles published under a Creative Commons License, all supplemental material carries the same license as the article it is associated with.
For non-Open Access articles published, all supplemental material carries a non-exclusive license, and permission requests for re-use of supplemental material or any part of supplemental material shall be sent directly to the copyright owner as specified in the copyright notice associated with the article.