
Abstract
Background
This study examined the relationship of patients’ sex, age, body mass index, history of hypertension, various lipid indices, atherogenic index of plasma, bilirubin–lipid composite index 1, and bilirubin–lipid composite index 2 with the degree of coronary artery stenosis. The study aim was to identify factors associated with coronary stenosis and provide new perspectives for the diagnosis and treatment of coronary artery disease.
Methods
A total of 175 patients who visited Qinghai Affiliated Hospital and underwent their first coronary angiography examination were included. Basic demographic information and laboratory measurements were collected. The atherogenic index of plasma and two bilirubin–lipid composite indices were calculated using biochemical indicators, and a correlation analysis of these data with post-imaging Gensini scores was performed using statistical analysis.
Results
Total bilirubin, triglycerides, high-density lipoprotein, atherogenic index of plasma, and both bilirubin–lipid composite indices showed statistically significant differences between the observation and control groups. Binary multivariate logistic regression showed that the atherogenic index of plasma and both bilirubin–lipid composite indices had statistically significant and independent positive effects on coronary heart disease risk. Single-factor Spearman linear regression indicated that the atherogenic index of plasma and both bilirubin–lipid composite indices were positively correlated with the Gensini score, while total bilirubin was negatively correlated with the Gensini score. Receiver operating characteristic curve analysis showed a diagnostic specificity of 83.7% and sensitivity of 57.9% for coronary heart disease.
Conclusions
Higher values of the atherogenic index of plasma and both bilirubin–lipid composite indices were associated with an increased risk of coronary heart disease and showed an independent positive correlation with the severity of coronary stenosis. Serum total bilirubin decreased with increasing severity of coronary stenosis, demonstrating an independent negative correlation. The diagnostic value of coronary heart disease was higher when the atherogenic index of plasma was >0.06, bilirubin–lipid composite index 1 was >1.89, or bilirubin–lipid composite index 2 was <3.69.
Keywords
Background
Atherosclerotic cardiovascular disease (ASCVD), a common pathological basis for coronary heart disease (CHD), stroke, and peripheral artery disease, poses a serious threat to global health. Although traditional risk factors such as hypertension, hyperlipidemia, diabetes, and smoking are well recognized, recent research has highlighted the important roles of genetic factors, inflammatory responses, and immune mechanisms in the pathogenesis of ASCVD. CHD, a major component of ASCVD, is the primary focus of this study. CHD is characterized by obstruction of the coronary arteries, leading to ischemic events such as angina pectoris and myocardial infarction. Its rising incidence is associated with various risk factors, including age, sex, hypertension, diabetes, and dyslipidemia, all of which contribute to the morbidity and mortality associated with the disease. Effective early detection and risk assessment strategies are therefore essential for improving the management and prognosis of CHD. Although current diagnostic approaches rely on traditional clinical risk factors and imaging techniques, these approaches often fail to identify high-risk individuals in a timely manner.1–3
Recent investigations have emphasized the role of novel biomarkers in improving risk stratification for patients with CHD. Among these markers, the atherogenic index of plasma (AIP) and bilirubin-related indices have garnered attention owing to their ability to reflect underlying pathophysiological processes related to atherosclerosis and inflammation. The AIP, defined as the logarithm of the ratio of triglycerides (TG) to high-density lipoprotein cholesterol (HDL-C), serves as a valuable indicator of dyslipidemia and cardiovascular risk.4–6 Elevated AIP levels are associated with a higher incidence of adverse cardiovascular events, suggesting its value as a prognostic indicator in patients with coronary artery disease. 5 This study aimed to address existing gaps by examining the associations between AIP, bilirubin indices, and the risk of CHD in a case–control cohort. By analyzing the correlations between these novel biomarkers and established clinical characteristics, the study sought to improve the predictive accuracy of current risk stratification tools and contribute to the development of more effective screening approaches. The findings may support new preventive strategies and therapeutic interventions tailored to individual risk profiles, ultimately improving clinical outcomes for patients with CHD.
Methods
General information
Patients who visited the Qinghai University Affiliated Hospital from November 2021 to November 2022 and underwent coronary angiography were enrolled in this study. General patient information, including age, sex, height, weight, history of smoking, history of alcohol consumption, history of hypertension, and other basic characteristics, was collected and recorded. All patient information was de-identified.
Inclusion criteria
Patients who visited the Qinghai University Affiliated Hospital and underwent coronary angiography during the study period and who had complete data on relevant laboratory tests and required examinations were included in the study.
Exclusion criteria
The exclusion criteria were as follows:
Patients with incomplete clinical information; Those with congenital cardiovascular disease; Those with severe cardiopulmonary dysfunction, malignant tumors, hematolymphatic diseases, or severe systemic infections; Those who experienced acute cerebral hemorrhage, gastrointestinal or other organ bleeding, or coagulation disorders within the past 3 months; Those with abnormal liver function caused by hepatitis B, cirrhosis, liver cancer, or other conditions; Those with hemolytic disorders causing elevated bilirubin or obstructive bile duct disorders of any cause; Those with a history of myocardial infarction or who had undergone coronary intervention or coronary artery bypass grafting; Those who had taken medications that significantly affect lipid metabolism or bilirubin metabolism or excretion.
Grouping of research participants
Patients who met the inclusion criteria were grouped according to the World Health Organization diagnostic criteria for coronary artery disease. Based on imaging results, those with coronary stenosis ≥50% were included in the observation group, and those with coronary stenosis <50% were included in the control group. According to the number of coronary artery branches involved, patients were categorized as having single-, double-, or triple-branch coronary stenosis lesions (anterior descending artery, circumflex artery, and right coronary artery). The lesion in the right coronary artery is considered a single-vessel disease, and the left main lesion was regarded as a double-branch lesion. A total of 49 cases were included in the control group, comprising 30 male and 19 female patients. The observation group consisted of 126 patients, comprising 88 male and 38 female patients. In the observation group, 42 patients had single-branch lesions, 39 had double-branch lesions, and 45 had triple-branch lesions.
Specimen collection and instrumentation
Measurement of blood indicators
To evaluate relevant biochemical parameters associated with CHD, the following blood indicators were measured and calculated:
Patients were informed that blood sample collection would begin at 6:00 a.m. Blood samples were sent to the hospital laboratory for biochemical testing, including total cholesterol (TC), TG, HDL-C, low-density lipoprotein cholesterol (LDL-C), high-density lipoprotein (HDL), low-density lipoprotein (LDL), and total bilirubin (TBIL). The bilirubin–lipid composite indices and AIP were calculated using the following formulas
7
:

Bilirubin–lipid composite index 1 =LDL-C/(TBIL + HDL-C)
Bilirubin–lipid composite index 2 = TC/(TBIL + HDL-C)
All biochemical variables (TG, TC, HDL-C, TBIL, and LDL) were standardized to mmol/L for the calculations.
Coronary angiography
Coronary angiography was performed by a senior physician certified to perform coronary interventions independently. The Gensini score, which quantifies the degree of coronary artery stenosis, was calculated based on the angiography results.
The scoring method was as follows. The most severe stenosis in a single vessel was identified and assigned a score, which was then multiplied by a weighting factor corresponding to the location of the stenosis. This yielded the Gensini score for a single affected vessel. For patients with multiple affected vessels, the scores for each vessel were summed to obtain the total Gensini score. Higher Gensini scores indicate more severe coronary stenosis.
Flow charts
The study methodology is summarized in a flow chart (Figure 1), which provides an overview of the experimental sequence, including the relevant experimental content, categories of experimental data selected, and statistical methods employed.

Methodology flow chart.
Statistical methods
Statistical analyses were performed using Statistical Package for the Social Sciences (SPSS) 25.0 (IBM Corp., Armonk, NY, USA). Continuous variables were assessed for normality using the Shapiro–Wilk test. Normally distributed data were presented as mean ± standard deviation and compared using Student’s t-test or one-way analysis of variance (ANOVA); non-normally distributed data were presented as median (interquartile range) and compared using the Mann–Whitney U or Kruskal–Wallis tests. Categorical variables were expressed as frequencies (percentages) and compared using the chi-squared or Fisher’s exact tests.
Binary logistic regression analysis was performed to identify independent risk factors for CHD, with variable selection conducted using the forward stepwise method. Multicollinearity was assessed using variance inflation factors (VIF), with VIF <5 considered acceptable. Spearman correlation analysis was used to examine relationships between biomarkers and Gensini scores. Receiver operating characteristic (ROC) curves were constructed to assess diagnostic performance. A two-tailed P-value <0.05 was considered statistically significant.
Results
Comparison of indicators between the observation and control groups
There were no statistically significant differences between the observation and control groups with respect to sex, history of smoking, history of alcohol consumption, or history of hypertension (P > 0.05) (Table 1).
Comparison of categorical variables between the observation and control groups n (%).
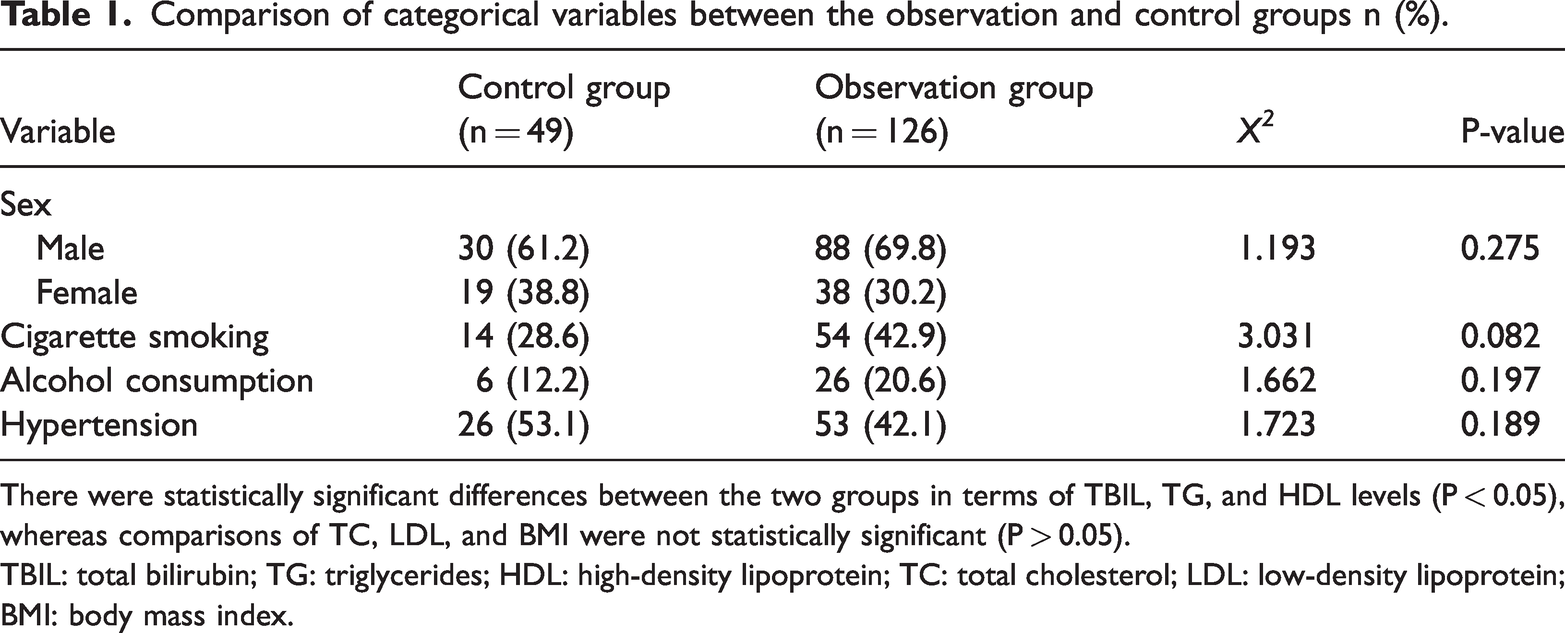
There were statistically significant differences between the two groups in terms of TBIL, TG, and HDL levels (P < 0.05), whereas comparisons of TC, LDL, and BMI were not statistically significant (P > 0.05).
TBIL: total bilirubin; TG: triglycerides; HDL: high-density lipoprotein; TC: total cholesterol; LDL: low-density lipoprotein; BMI: body mass index.
The two groups were statistically significant in terms of TBIL, TG, and HDL (P < 0.05), whereas the comparison in terms of TC, LDL, and body mass index (BMI) was not statistically significant (P > 0.05) (Table 2).
Comparison of continuous variables between the observation and control groups (X ± S)/M (P25, P75).
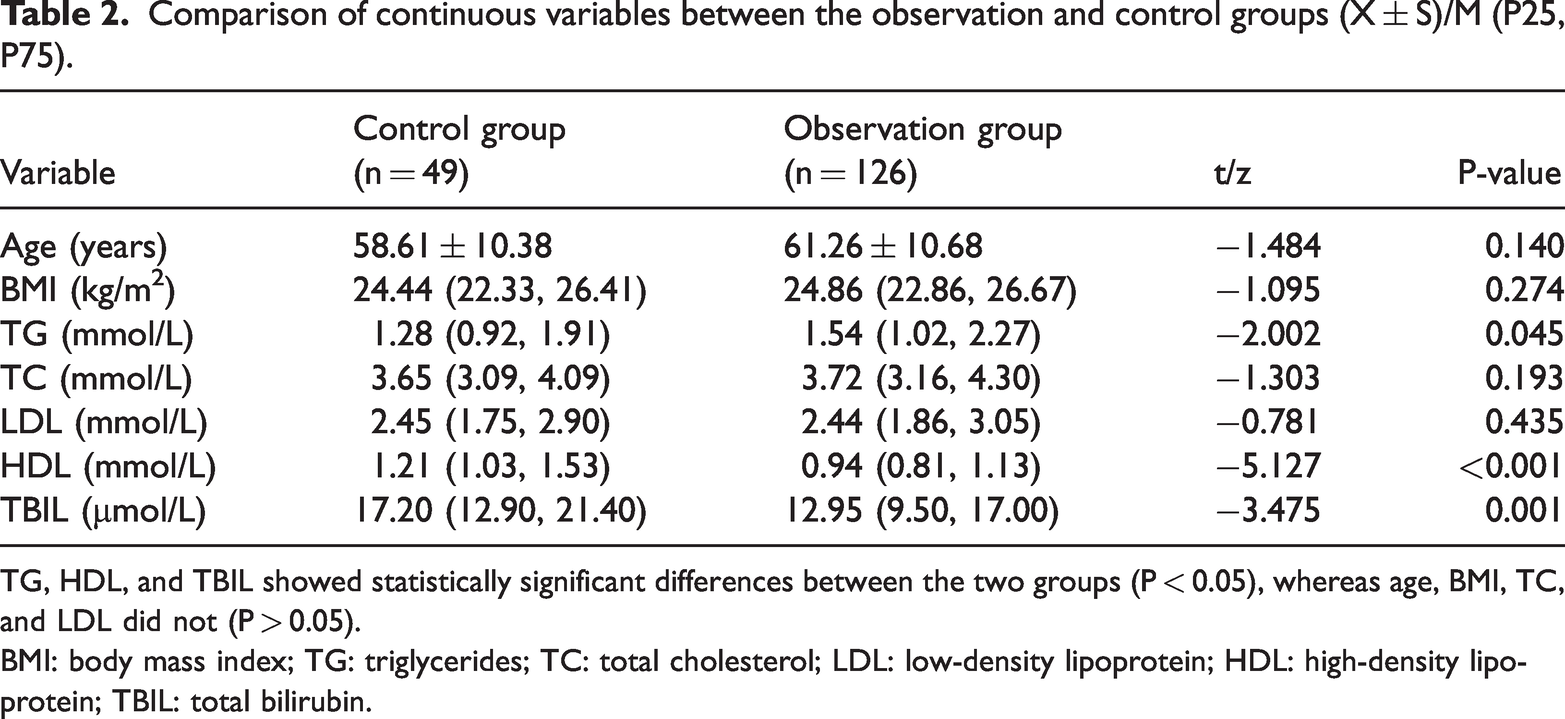
TG, HDL, and TBIL showed statistically significant differences between the two groups (P < 0.05), whereas age, BMI, TC, and LDL did not (P > 0.05).
BMI: body mass index; TG: triglycerides; TC: total cholesterol; LDL: low-density lipoprotein; HDL: high-density lipoprotein; TBIL: total bilirubin.
The levels of AIP, bilirubin lipid composite index 1, and bilirubin lipid composite index 2 were higher in the observation group, and the differences were statistically significant (P < 0.05) (Table 3).
Comparison of AIP and bilirubin–lipid composite indices between the observation and control groups.
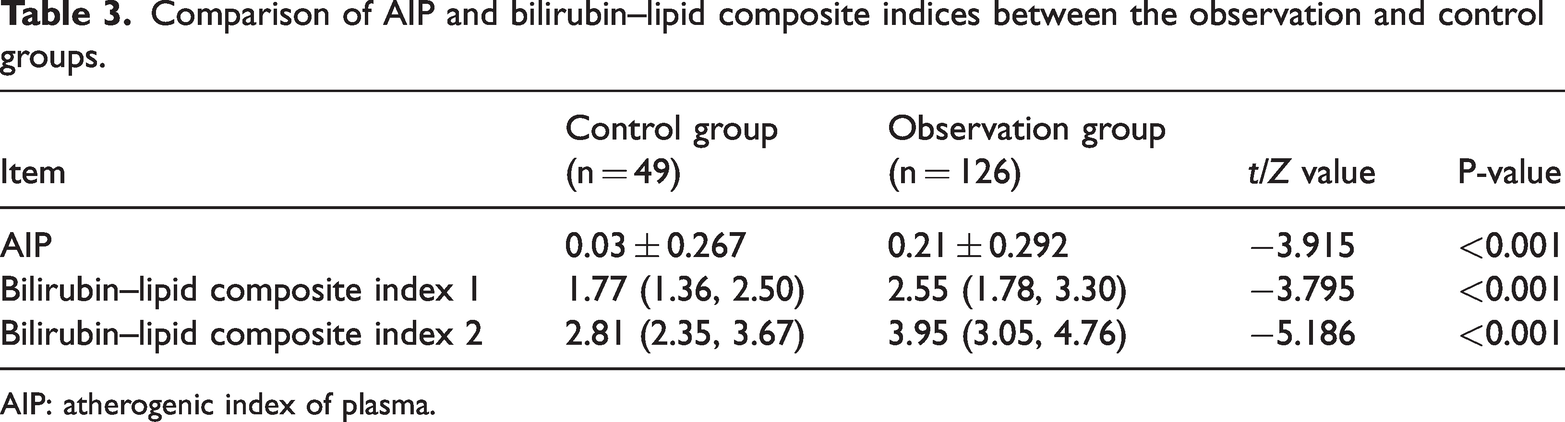
AIP: atherogenic index of plasma.
Binary multifactorial logistic regression analysis of significant indicators for the diagnosis of CHD
After controlling for confounding factors, the results are presented in Table 4. The AIP (odds ratio (OR) = 9.486, 95% confidence interval (CI): 1.988–45.25, P = 0.005), bilirubin–lipid composite index 1 (OR =1.605, 95% CI: 1.302–2.497, P = 0.036), and bilirubin–lipid composite index 2 (OR = 2.171, 95% CI: 1.355–3.530, P =0.002) were identified as independent risk factors for CHD. CHD was coded as 1 and the control as 0. No significant multicollinearity was detected among variables (all VIF <3).
Binary logistic regression analysis of risk factors for coronary heart disease.
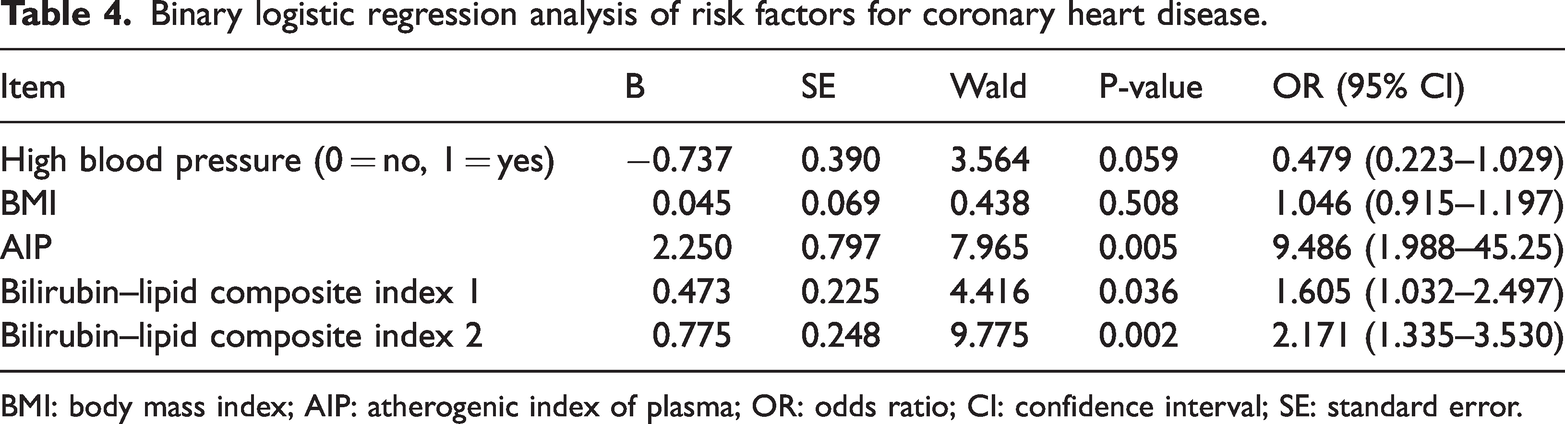
BMI: body mass index; AIP: atherogenic index of plasma; OR: odds ratio; CI: confidence interval; SE: standard error.
Comparison of indicators between single-, double-, and triple-branch coronary lesion subgroups
No statistically significant differences were observed among the single-, double-, and triple-branch coronary artery lesion subgroups with respect to sex, history of smoking, history of alcohol consumption, or history of hypertension (P > 0.05) (Table 5). Statistically significant differences were observed in HDL and TBIL among the three subgroups (P < 0.05) (Table 6). Additionally, the AIP, bilirubin–lipid composite index 1, and bilirubin–lipid composite index 2 showed statistically significant differences among the three subgroups (P < 0.05) (Table 7), with values tending to increase as the number of affected coronary branches increased.
Comparison of general count data in single-, double-, and triple-branch coronary lesion groups.

Comparison of general measures in single-, double-, and triple-branch coronary lesion groups (X ± S)/M (P25, P75).

indicates P < 0.05 compared with single-branch lesions; bindicates P < 0.05 compared with double-branch lesions.
BMI: body mass index; TG: triglycerides; TC: total cholesterol; LDL: low-density lipoprotein; HDL: high-density lipoprotein; TBIL: total bilirubin.
Comparison of AIP, bilirubin–lipid composite index 1 and 2 levels (X ± S)/M (P25, P75).

indicates P < 0.05 compared with single-branch lesions; b indicates P < 0.05 compared with double-branch lesions.
AIP: atherogenic index of plasma.
Correlation analysis of Gensini score with AIP and bilirubin–lipid composite indices
Statistical analysis showed that the AIP and both bilirubin–lipid composite indices were positively correlated with the Gensini score, whereas TBIL was negatively correlated with the Gensini score (Table 8) (Figures 2 to 5).
Correlation analysis of AIP, total bilirubin, bilirubin–lipid composite indices with Gensini score.
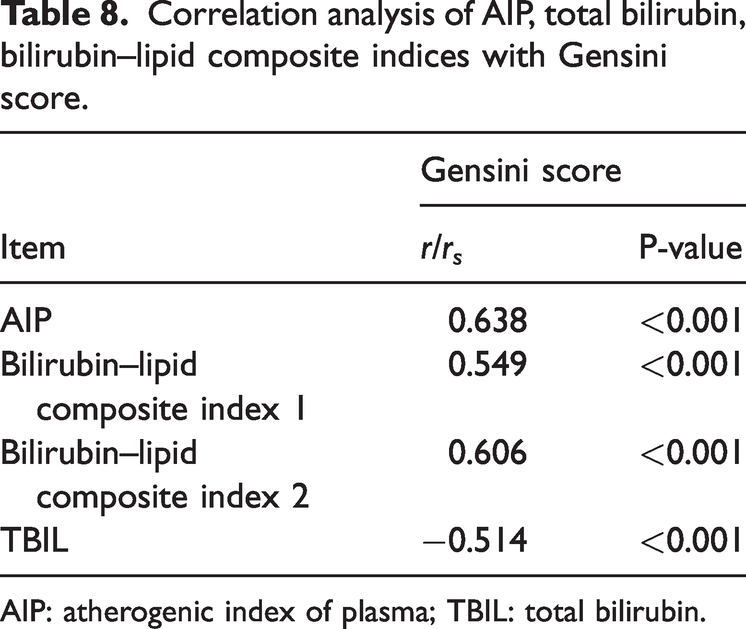
AIP: atherogenic index of plasma; TBIL: total bilirubin.

AIP correlation with Gensini score. AIP: atherogenic index of plasma.
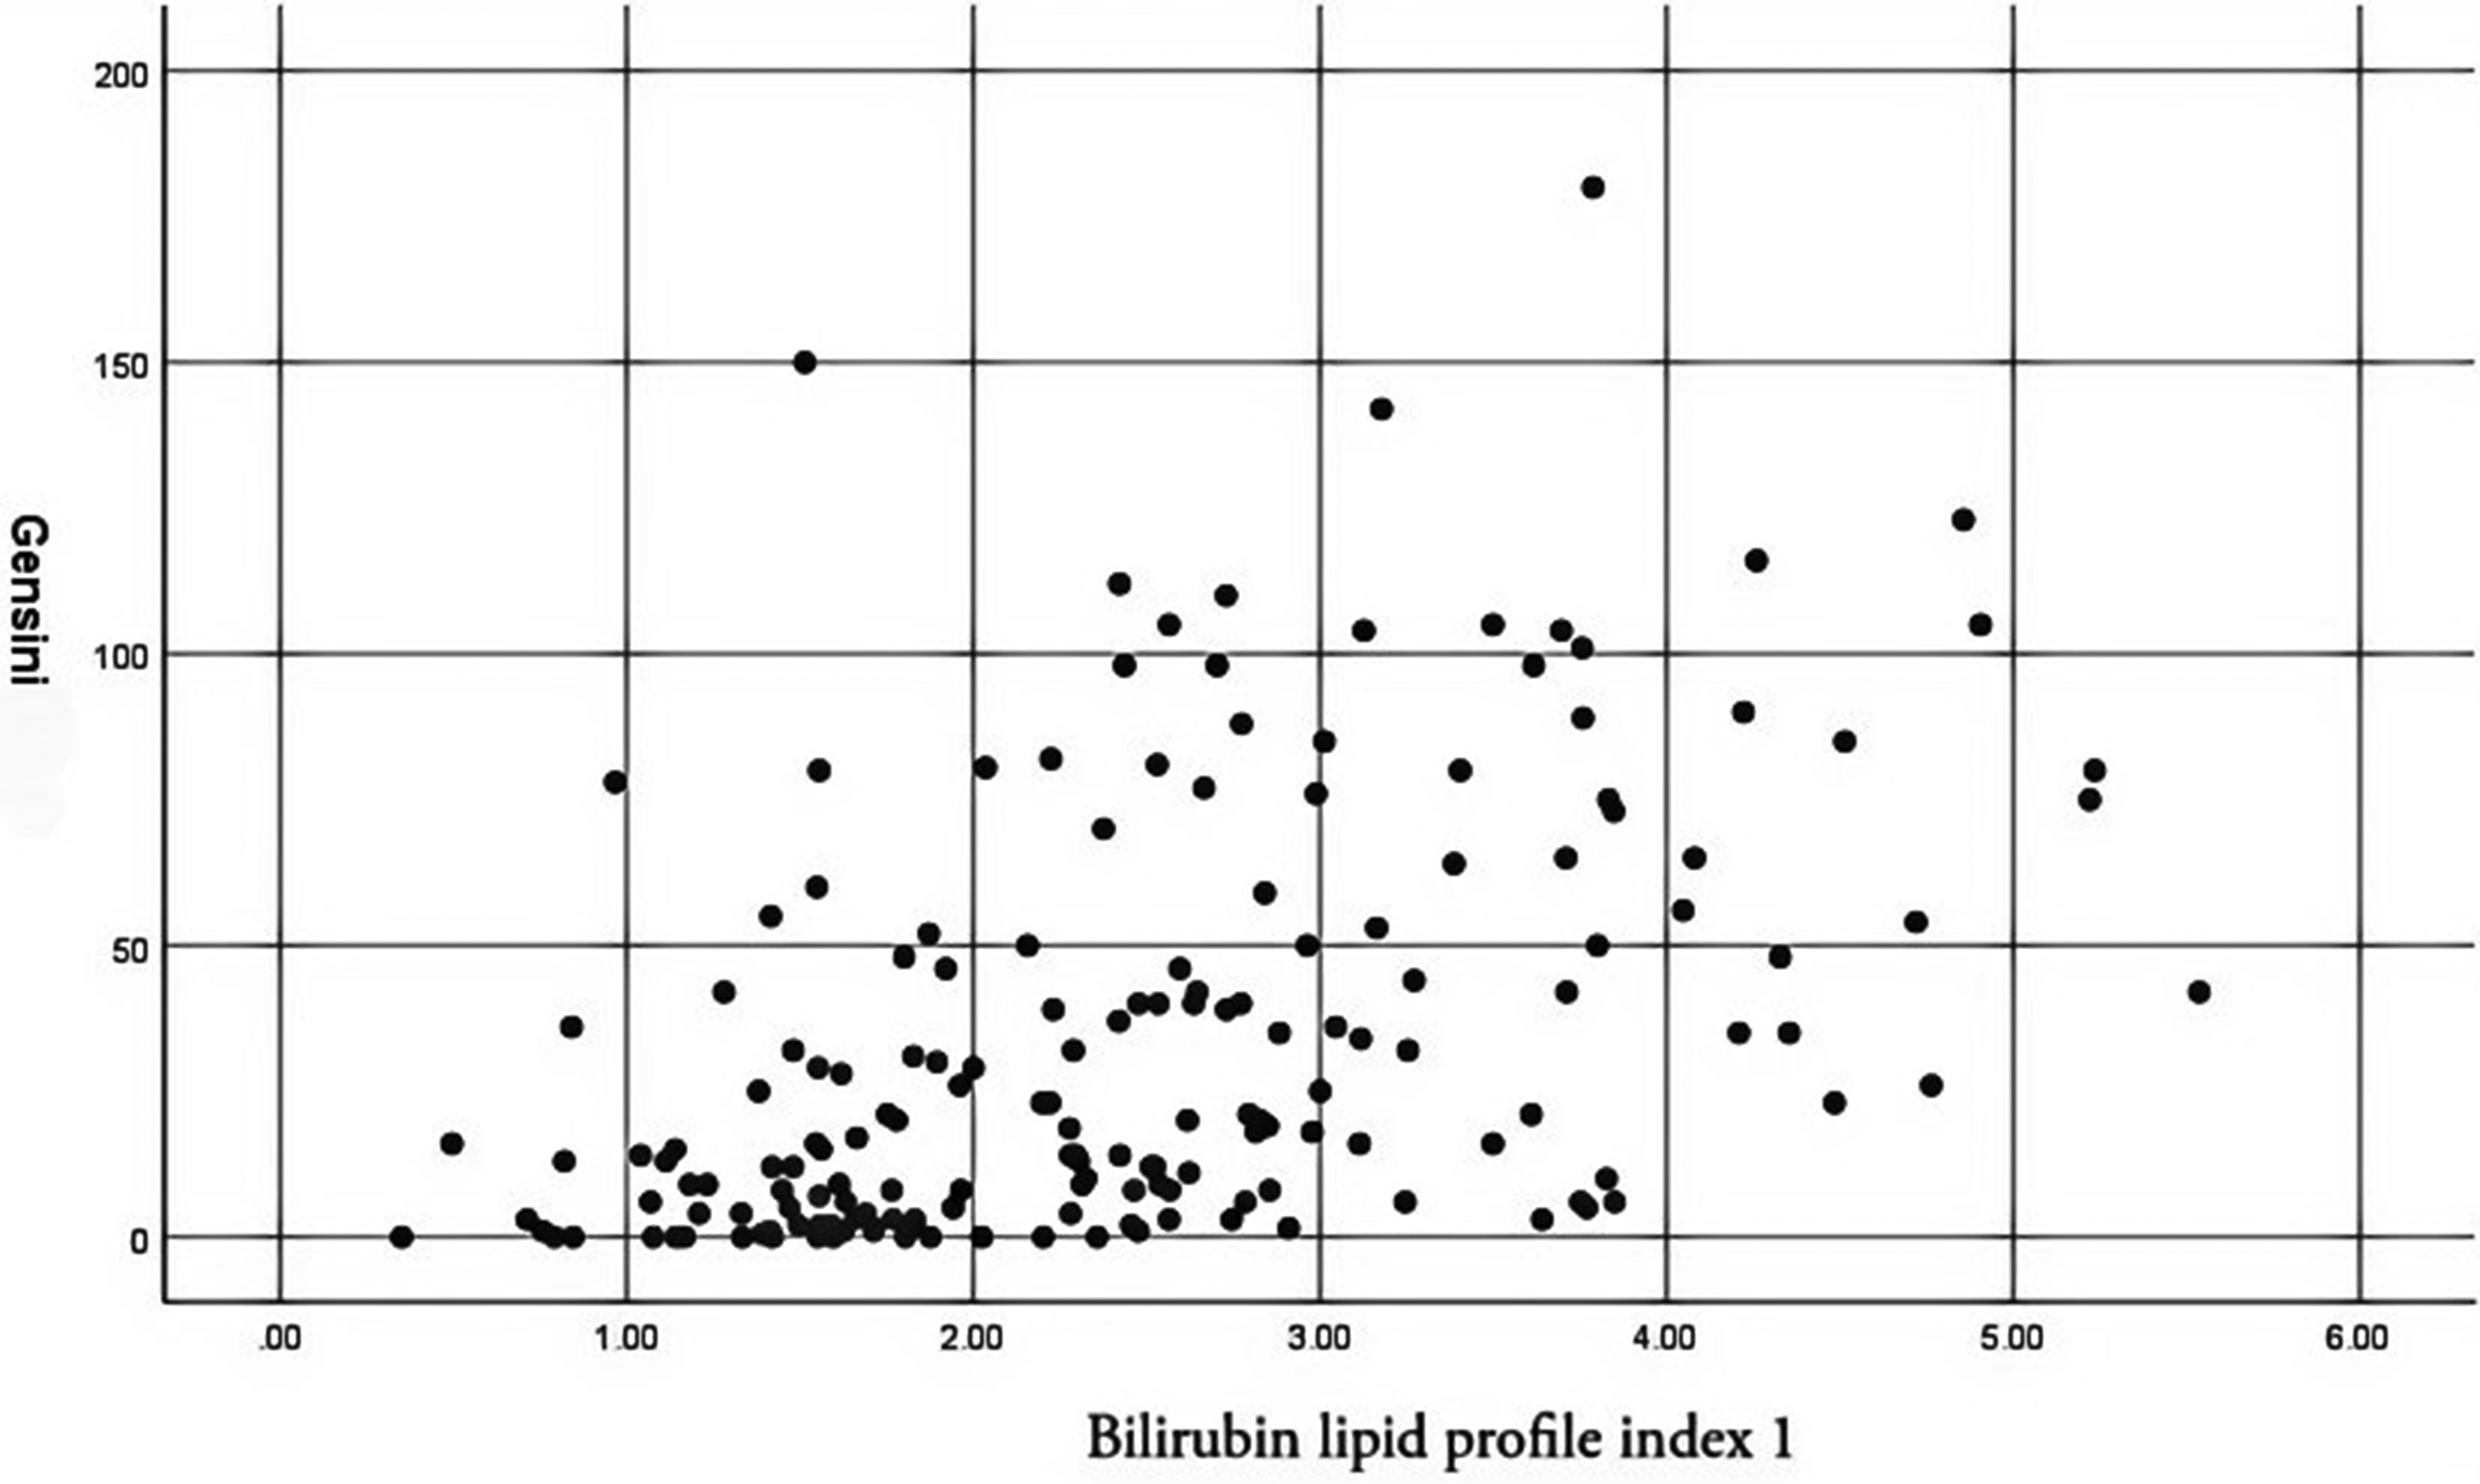
Correlation of bilirubin–lipid composite index 1 with Gensini score.

Correlation of bilirubin–lipid composite index 2 with Gensini score.

Correlation of total bilirubin with Gensini score.
ROC curve analysis of AIP and bilirubin–lipid composite indices for predicting CHD risk
ROC curves were plotted to evaluate the predictive value of the AIP and bilirubin–lipid composite index 1 for CHD risk, with CHD coded as 1 and non-CHD coded as 0. Regarding AIP, the area under the curve (AUC) was 0.681 (95% CI: 0.594–0.768), with a cutoff value of 0.06. The specificity and sensitivity for predicting CHD risk were 55.1% and 73.0%, respectively (Figure 6).

Predictive value of AIP, bilirubin–lipid composite index 1, and bilirubin–lipid composite index 2 for the development of coronary heart disease (ROC curves). AIP: atherogenic index of plasma; ROC: receiver operating characteristic.
Regarding bilirubin–lipid composite index 1, the AUC was 0.685 (95% CI: 0.599–0.771), with a cutoff value of 1.89. The specificity and sensitivity for predicting CHD risk were 59.2% and 72.2%, respectively (Figure 6).
Regarding bilirubin–lipid composite index 2, the AUC was 0.753 (95% CI: 0.673–0.832), with a cutoff value of 3.69. The specificity and sensitivity for predicting CHD risk were 83.7% and 57.9%, respectively (Table 9) (Figure 6).
Predictive value of AIP and bilirubin–lipid composite indices for the development of coronary heart disease.

AIP: atherogenic index of plasma; AUC: area under the curve; CI: confidence interval.
Discussion
Bilirubin, a heme catabolism product, has emerged as a potent endogenous antioxidant with important roles in protecting cells from oxidative damage by scavenging reactive oxygen species (ROS) and free radicals. Its antioxidant effects are primarily attributed to its ability to neutralize lipid peroxyl radicals, thereby preventing lipid peroxidation and maintaining cellular membrane integrity. Experimental studies have shown that bilirubin can effectively trap lipid peroxyl radicals, exhibiting activity comparable to that of α-tocopherol in liposomal systems at physiological pH, which highlights its strong radical-trapping capacity. 8 This pH-dependent antioxidant activity suggests that bilirubin’s efficacy may vary in different tissue microenvironments, particularly in pathological conditions with altered pH, such as ischemia or inflammation. Clinically, elevated serum bilirubin levels have been associated with increased total antioxidant status (TAS), reflecting enhanced systemic antioxidant capacity. For instance, in patients with atherosclerosis, higher bilirubin concentrations have been positively correlated with TAS and inversely correlated with markers of oxidative stress and inflammation, suggesting a protective role against oxidative damage in vascular tissues. 9 Similarly, neonatal studies have shown that mildly elevated bilirubin levels increase TAS and reduce the levels of oxidative stress markers, highlighting bilirubin’s physiological antioxidant function at moderate concentrations. 10 However, excessive bilirubin may exert toxic effects, underscoring the importance of maintaining bilirubin within a beneficial range. Mechanistically, bilirubin not only directly scavenges ROS but also modulates antioxidant pathways, such as the nuclear factor erythroid 2-related factor 2/heme oxygenase-1 (Nrf2/HO-1) axis, thereby enhancing endogenous antioxidant defenses in various cell types, including pulmonary epithelial cells and chondrocytes.10,11 Nanomedicine strategies leveraging bilirubin’s antioxidant properties have shown therapeutic potential in oxidative stress-related conditions, such as acute lung injury, renal ischemia–reperfusion injury, and osteoarthritis, through targeted delivery and sustained release of bilirubin to affected tissues.11–13 Additionally, bilirubin’s antioxidant effects extend to metabolic regulation, where it reduces oxidative stress–induced insulin resistance and inflammation, thereby improving metabolic outcomes. 14 Epidemiological evidence further supports an inverse relationship between serum bilirubin levels and oxidative stress-related diseases, including cardiovascular diseases and nonalcoholic fatty liver disease, reinforcing bilirubin’s role as a systemic antioxidant.15,16 In summary, bilirubin exerts antioxidant effects through direct radical scavenging, enhancement of endogenous antioxidant pathways, and modulation of inflammatory responses, thereby protecting cells from oxidative damage and contributing to the prevention and mitigation of diseases characterized by oxidative stress, such as atherosclerosis. These multifaceted antioxidant actions establish bilirubin as a crucial endogenous molecule with potential therapeutic applications in oxidative stress–mediated pathologies.17–19
Some studies have shown that bilirubin reduces intracellular ROS generation, thereby mitigating oxidative stress, preserving cellular function, and alleviating damage associated with cellular senescence. 20 Additionally, bilirubin can upregulate the expression of antioxidant enzymes, activate cellular antioxidant enzyme activity, and enhance cellular resistance to oxidative stress in various disease models, including diabetes mellitus and cardiovascular diseases.21,22 Beyond its antioxidant role, bilirubin is closely associated with the inflammatory response. In diverse experimental models, physiological concentrations of bilirubin have been shown to suppress the release of inflammatory mediators and reduce cytokine-induced inflammation. 20 Furthermore, bilirubin’s antioxidant properties are closely linked to modulation of inflammation. It can inhibit inflammation by suppressing the nuclear factor kappa B (NF-κB) signaling pathway or inhibiting inflammasome activation and other mechanisms. 23
In this study, we investigated the relationship between specific biochemical markers—namely, AIP and bilirubin–lipid composite index—and the risk of CHD. The results indicated a substantial association between elevated levels of these biomarkers and the occurrence of coronary artery disease.24,25 These findings suggest that AIP and bilirubin–lipid composite index can serve as effective indicators for early clinical screening and risk stratification, thereby supporting preventive strategies and therapeutic interventions in patients with high-risk coronary artery disease. 26 This study contributes to a better understanding of the relationship between biochemical indicators and CHD risk, highlighting the roles of AIP and bilirubin–lipid composite index as independent risk factors. Although prior studies have explored various associations between lipid profiles and cardiovascular diseases, the specific contributions of AIP and bilirubin–lipid composite index have often been overlooked.
Our results indicate that elevated AIP is closely related to the occurrence of CHD, consistent with previous studies showing that AIP is a predictive biomarker of cardiovascular disease in various populations.26,27 Importantly, our study identifies AIP as an independent risk factor, reinforcing its utility in clinical risk stratification and screening for CHD. These findings suggest that AIP should be measured routinely, particularly in patients with cardiovascular disease–related risk factors.
Furthermore, the results of this study underscore the importance of early detection and intervention in patients at high risk of CHD. Significant differences were observed in biochemical indices—particularly TBIL, TG, and HDL—between the CHD group and control group, suggesting that these markers serve as early indicators of disease progression.28,29 This is especially important because traditional risk assessment methods may not fully capture the nuances of an individual patient’s risk profile. Recent evidence indicates that combining traditional risk factors with novel biomarkers, such as AIP, can provide a more comprehensive understanding of cardiovascular risks, enabling personalized treatment strategies and improved prognosis.
Several limitations of this study should be acknowledged. First, the relatively small sample size, particularly in subgroup analyses, may limit statistical power and generalizability. Second, the single-center retrospective design introduces potential selection bias and restricts causal inference. Third, we did not adjust for certain potential confounders, such as glycemic control, renal function, and specific medication use, which might have influenced both biomarker levels and CHD risk. Fourth, the high-altitude population in this study may have unique physiological adaptations, limiting the applicability of the findings to other populations.
Future research should aim to validate these findings in larger, multicenter prospective cohorts, incorporating additional clinical variables to develop integrated prediction models. Further investigation into the molecular mechanisms underlying the relationship between bilirubin–lipid interactions and atherosclerosis progression would enhance our understanding of the pathophysiological significance of these biomarkers.
Conclusion
This study demonstrates a significant association between the AIP index and bilirubin–lipid composite index and the risk factors for CHD, highlighting their potential roles in clinical risk assessment. Elevations in these biochemical indices were correlated with the severity of coronary stenosis, providing valuable insights into early detection and intervention strategies.
However, this study has limitations, including a relatively small sample size and the absence of longitudinal follow-up data, which may have affected the generalizability of the findings. Additionally, as a single-center study, potential selection bias may limit the applicability of the results to broader populations. Future research should focus on multicenter studies involving diverse populations to validate these findings and investigate the mechanisms by which these biomarkers influence the pathophysiology of coronary artery disease. Moreover, integrating advanced imaging techniques with longitudinal assessments will be essential to clarify the prognostic value of AIP and bilirubin indices in the management of coronary artery disease.
To accurately interpret the results, it is important to acknowledge the limitations of this study. Concerns exist regarding the temporal validity of the observed associations between biochemical markers and CHD risk due to the absence of long-term follow-up data. The reliance on retrospective data collection may have introduced potential biases that could influence the statistical outcomes. Furthermore, the lack of validation through complementary experimental studies may have affected the robustness of the findings. These limitations warrant caution in interpreting the results and underscore the need for further research to confirm the observed correlations.
Future studies should aim to validate these findings in different populations and further investigate their potential clinical applications.
Footnotes
Acknowledgments
We would like to thank our supervisor for his guidance throughout the thesis process as well as our classmates and other teachers for their valuable feedback. Their dedication, patience, and support were instrumental in the successful completion of this work.
Authors’ contributions
YS and MR designed the study. YZ and RX collated the data, designed and developed the database, performed data analyses, and prepared the initial draft of the manuscript. All authors have read and approved the final submitted manuscript.
Availability of data and materials
All data generated or analyzed during this study are included in this published article (and its supplementary information files).
Consent for publication
Not applicable.
Declaration of conflicting interests
The authors declare that they have no competing interests.
Ethics approval and consent to participate
This retrospective clinical study investigated the AIP, bilirubin–lipid composite index, and coronary stenosis in highland populations by analyzing available medical records, imaging data, and laboratory results. The study was reviewed and approved by the Ethics Committee of the School of Clinical Medicine, Qinghai University (Approval Number: P-SL-2025-018). All procedures adhered to international and national ethical guidelines, including the Declaration of Helsinki and the Measures for Ethical Review of Biomedical Research Involving Human Beings. Data collection and analysis complied with the Personal Information Protection Act and the Code for the Safe Management of Medical Data. Informed consent was obtained directly from participants.
Funding
This research was supported by a specific grant from the Qinghai Provincial Clinical Medical Research Center for Cardiovascular Diseases under the “Kun Lun Talents - High-level Health Talents” Program (“Provincial Health Demonstration Team”).