
Abstract
Background:
Acute ischemic stroke (AIS) is a leading cause of mortality and disability worldwide. Intravenous thrombolysis (IVT) improves recovery, but predicting outcomes remains challenging. Machine learning (ML) and biomarkers like ubiquitin carboxyl-terminal hydrolase L1 (UCH-L1), S100 calcium-binding protein β (S100β), and neuron-specific enolase (NSE) may enhance prognostic accuracy.
Objectives:
We aimed to assess the predictive value of serum brain injury biomarkers for 3-month outcomes in AIS patients treated with IVT, using an ML-based model.
Design:
A multicenter prospective cohort study was conducted, enrolling AIS patients treated with recombinant tissue plasminogen activator from 16 hospitals.
Methods:
Of 1580 patients, 1028 were included and divided into training (n = 571), testing (n = 243), and external validation (n = 214) cohorts. Thirty-three variables, including demographics, clinical data, and biomarkers (UCH-L1, S100β, NSE), were analyzed. Least Absolute Shrinkage and Selection Operator regression was used for feature selection, and six ML algorithms were tested. Model performance was evaluated using the area under the receiver operating characteristic curve (AUC), F1-score, calibration curve, and decision curve analysis.
Results:
The light gradient boosting machines (LightGBM) model achieved the best performance in the training dataset (AUC: 0.846; F1-score: 0.789) and external validation dataset (AUC: 0.714). Eight critical predictors, including age, admission National Institutes of Health Stroke Scale (NIHSS) score, Trial of Org 10172 in Acute Stroke Treatment, white blood cell, finger blood glucose, UCH-L1, S100β, and NSE, were identified and incorporated into an ML model for clinical application. Shapley additive interpretation analysis enhances the interpretability of the model, with NIHSS score and NSE as top contributors. External validation confirmed good calibration and consistent net benefit across threshold probabilities (0.1–0.8).
Conclusion:
Integrating serum biomarkers (UCH-L1, S100β, NSE) with ML significantly improves 3-month outcome prediction in AIS patients. The LightGBM model offers robust performance and clinical interpretability for individualized treatment planning.
Introduction
Acute ischemic stroke (AIS) is a common type of stroke, which constitutes a significant global contributor to mortality and disability, resulting in substantial economic ramifications for patients, families, and society.1–3 Intravenous thrombolysis (IVT), particularly with alteplase, is a standard treatment to improve recovery and reduce disability and mortality by dissolving clots and restoring blood flow.4,5
Using predictive models for early prediction of outcomes in patients following a stroke is crucial for guiding clinical decision-making and improving treatment effectiveness. 6 Several methods, such as stroke prognostic scores and machine learning (ML) algorithms, have been proposed to predict clinical outcomes in post-thrombolysis stroke patients.7,8 The traditional models for predicting the prognosis of cerebral infarction have mainly focused on conventional risk factors. 6 However, recent studies have identified certain biomarkers in peripheral blood that reflect brain injury, such as glial fibrillary acidic protein (GFAP), ubiquitin carboxyl-terminal hydrolase L1 (UCH-L1), S100 calcium-binding protein β (S100β), and neuron-specific enolase (NSE).9–12 These biomarkers are associated with the prognosis of cerebral infarction and may serve as prognostic predictors.
In this study, our objective was to leverage ML methods to construct a comprehensive predictive model that integrates the patient’s brain injury biomarkers, aiming to predict the prognosis of thrombolysis at 3 months for clinical thrombolysis decision-making. To achieve this, we developed and validated a comprehensive predictive model by integrating demographic characteristics, routine laboratory tests, novel serum biomarkers, and National Institutes of Health Stroke Scale (NIHSS) scores. 13 Furthermore, we compared the performance of models with and without the inclusion of biomarkers.
Materials and methods
Study population and data collection
This was a multicenter, prospective observational study and followed the Strengthening the Reporting of Observational Studies in Epidemiology guidelines. 14
Individuals diagnosed with AIS who received IVT utilizing recombinant tissue-type plasminogen activator (r-tPA) were analyzed. Our inclusion criteria were patients with ischemic stroke aged over 18 years, with a pre-stroke modified Rankin Scale (mRS) score of 1 or lower. This investigation was based on a prospectively gathered database from the First Hospital of Jilin University and 15 hospitals, located in northeast China. Patients from the First Hospital of Jilin University were recruited from September 2016 to April 2023. Patients from other hospitals recruited patients between September 2021 and February 2022 (Table S1). Patients who received endovascular interventions were excluded from the study.
The study encompassed 33 predictors related to demographic factors (gender, age), lifestyle habits (history of alcohol consumption, history of cigarette smoking), medical history (diabetes, hypertension, dyslipidemia, previous ischemic stroke, coronary heart disease, hyperhomocysteinemia), symbolic blood pressure, diastolic blood pressure, heart rate, onset-to- rt-PA bolus time, Trial of Org 10172 in Acute Stroke Treatment classification (TOAST), admission NIHSS score, infarct location (included cortex, subcortex, thalamus, cerebellum, brainstem, multiple), anterior or posterior circulation, white blood cell (WBC), red blood cell, hemoglobin, platelet count, finger blood glucose, prothrombin time, thrombin time, activated partial thromboplastin time, fibrinogen, creatinine, urea, uric acid, and homocysteine, serum biomarkers (GFAP, UCH-L1, S100β, NSE).
Justification of the sample size
Although the sample size for this study was not formally calculated a priori, we retrospectively assessed its adequacy based on the 10 Events Per Variable (EPV) Rule, 15 a widely accepted guideline for ensuring robust statistical power in predictive modeling studies. Our model included 8 predictors, and the incidence rate of adverse outcomes (e.g., poor functional outcome at 3 months, defined as mRS ⩾2) was approximately 58.5% (100%–41.5%, where 41.5% was the proportion of favorable outcomes) in the training cohort. Using the formula:
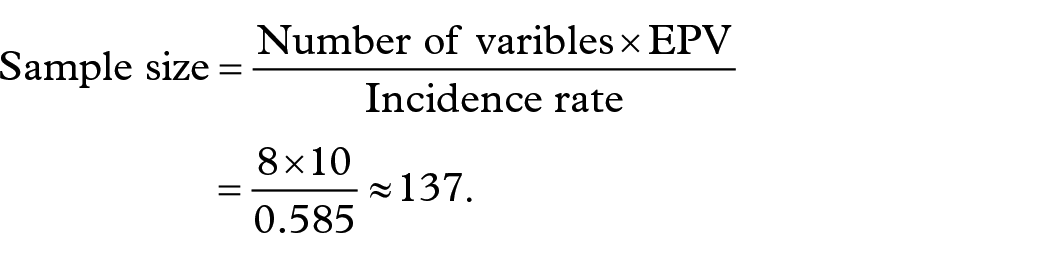
We determined that the minimum required sample size was 137. Our study included a total of 571 patient cases in the training cohort, significantly exceeding this requirement.
Biomarker measurement
Venous blood was drawn from the patient’s median cubital vein at 24 ± 2 h after IVT. The blood was centrifuged at 3000 rpm for 10 min within 2 h to obtain serum, which was then transferred into cryotubes. All serum samples were stored in a −80°C freezer at the Biobank of the Clinical Research Department, the First Hospital of Jilin University, for further analysis. Detection of brain injury biomarkers was conducted at the Stroke Center of the First Hospital of Jilin University using an automated magnetic particle-based chemiluminescence immunoassay system (MS-Fast/Aceso 80A; Sophonix, Beijing, China). The detection kits were provided by Sophonix.
The lower limit of quantification (LLOQ) for GFAP is 5 pg/mL, while for S100β, the LLOQ is 0.05 ng/mL with an upper limit of quantification (ULOQ) of 10 ng/mL. For UCH-L1, the LLOQ is 50 pg/mL; for NSE, the LLOQ is 0.5 ng/mL with a ULOQ of 350 ng/mL. Test results below the LLOQ are handled as the LLOQ value, and results above the ULOQ are handled as the ULOQ value. In detail, GFAP results <5 pg/mL are treated as 5 pg/mL. S100β results <0.05 ng/mL are treated as 0.05 ng/mL, and those >10 ng/mL are treated as 10 ng/mL. UCH-L1 results <50 pg/mL are treated as 50 pg/mL. NSE results <0.5 ng/mL are treated as 0.5 ng/mL, and those >350 ng/mL are treated as 350 ng/mL. The coefficient of variation for the assays is <8.0%.
Outcome definition
The long-term prognosis was assessed with the mRS 90 days after stroke onset. A favorable outcome was defined as an mRS of 1 or less, while an unfavorable outcome was defined as an mRS greater than 1 at 90 days post-stroke.
Statistical analysis
Continuous variables are presented as median with interquartile range and compared using the Mann–Whitney U test. Categorical variables are reported as frequencies (percentages, %) and analyzed using Spearman’s test or Fisher’s exact test. Correlations between quantitative variables are assessed using Pearson correlation analysis. All statistical analyses were performed using R software (version 4.4.2).
Six ML algorithms, including Logistics, support vector machine, gradient boosting machines, Neural Network, Adaboost, and light gradient boosting machines (LightGBM), were used to develop models on the training set. These models were refined by applying a 10-fold cross-validation methodology on the training set to prevent overfitting and then tested on the test set. Model performance was assessed using the area under the receiver operating characteristic curve (AUC) and the precision-recall curve to address data imbalance. In addition, accuracy, sensitivity, specificity, precision, F1-score, calibration curves, and confusion matrix were calculated for each model.
To evaluate the impact of incorporating the three biomarkers (UCH-L1, S100β, and NSE) on model performance, we compared two models: Model 1 (with biomarkers) and Model 2 (without biomarkers). The performance of the two models was compared using the following metrics: (1) the AUC, assessed using the DeLong test to determine the statistical significance of differences in discriminatory ability; (2) the Net Reclassification Improvement (NRI), to evaluate improvements in risk reclassification; and (3) the Integrated Discrimination Improvement (IDI), to assess overall improvements in discrimination ability. A two-sided p-value <0.05 is considered statistically significant. Statistical significance for NRI and IDI was determined using the Bootstrap method (1000 replicates) to calculate 95% confidence intervals (CIs) and p-values. Shapley additive interpretation (SHAP) plots were used to enhance the transparency and interpretability of the model.
Results
Baseline characteristics of the study population
Among the 1580 patients who received IVT, blood samples were collected from 1131 patients to measure levels of GFAP, UCH-L1, S100β, and NSE. After excluding 44 patients who underwent endovascular intervention following IVT, 22 patients who declined follow-up, and 37 patients who lost to follow-up, a total of 1028 patients were included in the final analysis.
The primary training and testing cohorts were composed of 814 patients from our stroke center. Seventy percent of the cases (n = 571) were randomly selected for the training group, while the remaining 30% (n = 243) were used for testing. The external validation cohort consisted of 214 patients from 15 additional participating centers. Baseline characteristics are summarized in Table 1.
Baseline characteristics of patients in the different cohorts.

APTT, activated partial thromboplastin time; BUN, blood urea nitrogen; DBP, diastolic blood pressure; FIB, fibrinogen; GFAP, glial fibrillary acidic protein; HGB, hemoglobin; HR, heart rate; LAA, large artery atherosclerosis; NIHSS, National Institutes of Health Stroke Scale; No-LAA, no large artery atherosclerosis (including small artery occlusion, cardioembolism, other determined cause, and undetermined etiology); NSE, neuron-specific enolase; PLT, platelet count; PT, prothrombin time; RBC, red blood cell; rt-PA, recombinant tissue plasminogen activator; S100β, S100 protein β; SBP, systolic blood pressure; SCR, serum creatinine; TOAST, Trial of Org 10172 in Acute Stroke Treatment classification; TT, thrombin time; UCH-L1, ubiquitin C-terminal hydrolase-L1; WBC, white blood cell.
Feature selection
Among the 33 variables included in the study, univariate logistic regression analysis (Table 2) identified several factors significantly associated with 3-month outcomes, including history of previous stroke, age, admission NIHSS score, finger blood glucose, TOAST classification, WBC, platelet count, GFAP, UCH-L1, S100β, and NSE.
Comparison of baseline characteristics between patients with favorable and unfavorable outcomes in the training cohort.

APTT, activated partial thromboplastin time; BUN, blood urea nitrogen; DBP, diastolic blood pressure; FIB, fibrinogen; GFAP, glial fibrillary acidic protein; HGB, hemoglobin; HR, heart rate; LAA, large artery atherosclerosis; NIHSS, National Institutes of Health Stroke Scale; No-LAA, no large artery atherosclerosis (including small artery occlusion, cardioembolism, other determined cause, and undetermined etiology); NSE, neuron-specific enolase; PLT, platelet count; PT, prothrombin time; RBC, red blood cell; rt-PA, recombinant tissue plasminogen activator; S100β, S100 protein β; SBP, systolic blood pressure; SCR, serum creatinine; TOAST, Trial of Org 10172 in Acute Stroke Treatment classification; TT, thrombin time; UCH-L1, ubiquitin C-terminal hydrolase-L1; WBC, white blood cell.
To refine the predictors, we performed Least Absolute Shrinkage and Selection Operator (LASSO) regression analysis (Figure 1) with 10-fold cross-validation. Using the lasso.1se criterion, eight predictors were selected as the most robust indicators for the model: TOAST, age, admission NIHSS score, finger blood glucose, WBC, UCH-L1, S100β, and NSE. These eight predictors were incorporated into a model to predict 3-month outcomes.

Feature selection of the models. (a) Variable selection trajectories in the LASSO regression model. (b) Factor screening using LASSO regression: The left dashed line represents the optimal lambda (lambda.min), and the right dashed line represents the lambda (lambda.1se) within one standard error of the optimal evaluation metrics.
Model performance
In the training dataset, the LightGBM model demonstrated the best predictive performance compared with other models (Figure 2(a) and (b)), achieving an AUC of 0.846 (95% CI: 0.815−0.877). The F1 scores for these models are shown in Table S2.
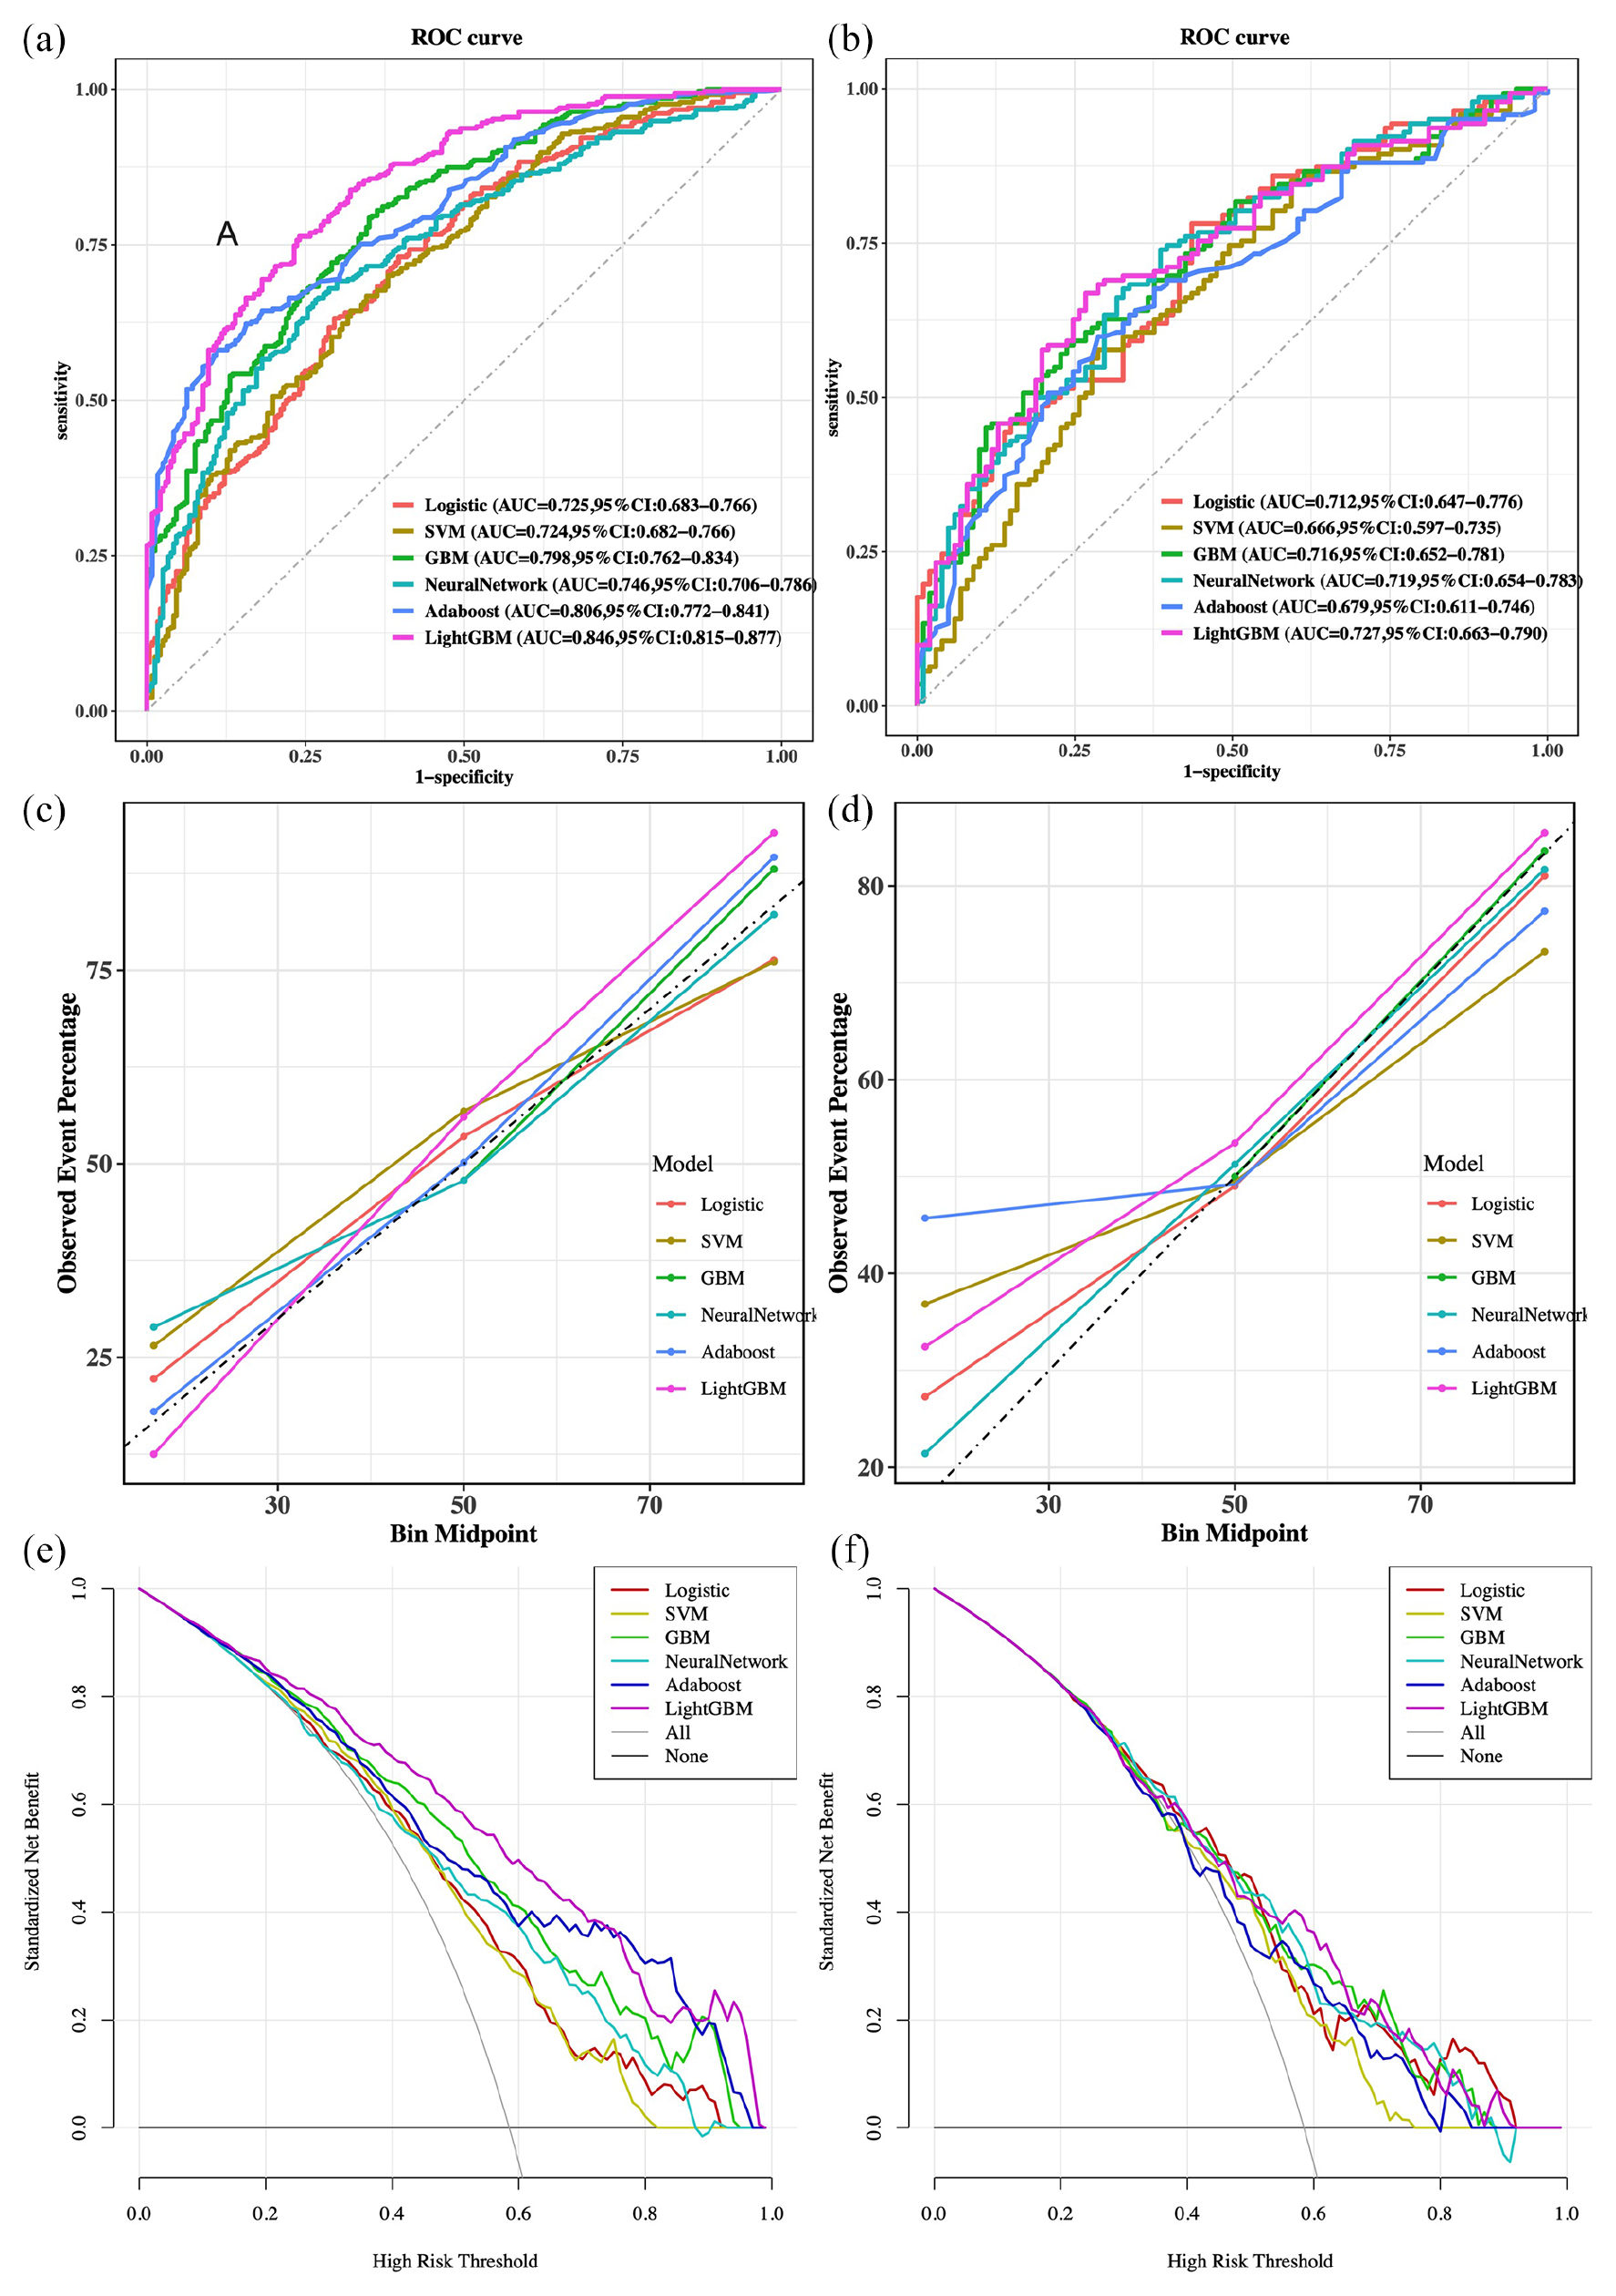
Model performance in the training and testing sets. (a, b) The ROC curves, (c, d) calibration curves, and (e, f) decision curves were compared for the models. Training sets: (a), (c), and (e). Testing sets: (b), (d), and (f).
The calibration curves were used to evaluate the prognostic risk prediction nomogram (Figure 2(c) and (d)). The y-axis represents the actual number of patients with poor outcomes, while the x-axis represents the predicted risk. The diagonal dashed line indicates a perfect prediction from an ideal model, and the solid lines show the performance. The closer the solid line is to the diagonal, the better the predictive performance. Adaboost performed better in the training set, while the Neural Network aligned more closely with the diagonal line in the validation set.
The decision curve analysis further validated the superiority of the LightGBM model. In the training dataset, the decision curve showed that the model provided a substantial net benefit over the baseline strategy when the probability threshold ranged from 0.1 to 0.9 (Figure 2(e)). Similarly, in the testing dataset, the LightGBM model maintained a consistently high net benefit, particularly within the 0.2–0.9 threshold probability range (Figure 2(f)).
Comprehensive comparisons of accuracy, sensitivity, specificity, predictive values, and F1 scores are presented in Figure 3 and Table S2. These results confirm the robustness and clinical utility of the LightGBM model in predicting 3-month outcomes of IVT patients. Considering its outstanding performance in predictive accuracy, interpretability, and clinical decision-making, the LightGBM model was selected as the final predictive model for this study.

The performance and comparison of six different predictive models. (a) Evaluation metrics for the training set. (b) Evaluation metrics for the testing set.
Model comparison
To evaluate the impact of the three biomarkers on predictive performance, we compared Model 1 (with biomarkers) and Model 2 (without biomarkers). The results demonstrated that Model 1 achieved a significantly higher AUC in both the training cohort and testing cohort (Figure 4). Based on the DeLong test, Model 1 demonstrated significantly better performance than Model 2 in the training cohort (p < 0.001). In the testing cohort, however, the difference between Model 1 and Model 2 was not marginally significant (p = 0.0519; Table 3).

The ROC curves comparison of two models. (a) Training sets. (b) Testing sets.
Delong test results of training cohort and testing cohort.

Model 1 includes eight predictive variables: TOAST, age, admission NIHSS score, finger blood glucose, WBC, UCH-L1, S100β, and NSE.
Model 2 includes five predictive variables: TOAST, age, admission NIHSS score, finger blood glucose, and WBC.
The DeLong test was used to compare the AUC between Model 1 and Model 2.
AUC, area under the ROC curve; CI, confidence interval; NIHSS, National Institutes of Health Stroke Scale; NSE, neuron-specific enolase; S100β, S100 protein β; TOAST, Trial of Org 10172 in Acute Stroke Treatment classification; UCH-L1, ubiquitin C-terminal hydrolase-L1; WBC, white blood cell.
To further assess the difference between the two models, we conducted NRI and IDI tests. In the testing cohort, the NRI results showed that Model 1 improved classification ability by 21.9% compared to Model 2. Specifically, NRI+ tests indicated that Model 1 improved classification for positive cases (poor outcomes) by 28.9%. Similarly, IDI tests (IDI = 0.085, 95% CI: 0.057−0.113; p < 0.001) suggested that Model 1 had better discrimination ability than Model 2 (Table 4). In the training cohort, both NRI and IDI showed even more pronounced improvements (NRI = 0.311, 95% CI: 0.261–0.364; IDI = 0.152, 95% CI: 0.135–0.170). Therefore, incorporating these three biomarkers can enhance the model’s ability to predict poor outcomes.
NRI and IDI results of training cohort and testing cohort in two models.

Model 1 includes eight predictive variables: TOAST, age, admission NIHSS score, finger blood glucose, WBC, UCH-L1, S100β, and NSE.
Model 2 includes five predictive variables: TOAST, age, admission NIHSS score, finger blood glucose, and WBC.
CI, confidence interval; IDI, integrated discrimination improvement; NIHSS, National Institutes of Health Stroke Scale; NRI, net reclassification improvement; NRI−, net reclassification improvement for non-events; NRI+, net reclassification improvement for events; NSE, neuron-specific enolase; S100β, S100 protein β; TOAST, Trial of Org 10172 in Acute Stroke Treatment classification; UCH-L1, ubiquitin C-terminal hydrolase-L1; WBC, white blood cell.
Interpretability analysis of models based on SHAP
To better understand the relationship between the model and the data, we used SHAP to demonstrate how these variables influence the 3-month prognosis in the model. In the model, NIHSS was the most important variable, while the three biomarkers NSE, S100β, and UCHL-1 ranked 2nd, 5th, and 7th in importance, respectively (Figure 5(a)). To investigate the impact of the top features on predictive outcomes, their contributions to the model’s prediction were analyzed (Figure 5(b)). We also used SHAP to interpret how the model makes personalized predictions for a single patient (Figure 5(c)). E[f(x)] indicated the base value of the shake of the overall sample. This patient presented a higher value (f(x) = 0.819), indicating a worse outcome. The broader the distribution of SHAP values, the greater the impact of the feature on the model’s prediction. For this patient, NIHSS = 11 and NSE = 23.3 pg/mL made the most significant contribution to the worst outcome. This visualizing analysis provides deeper insights into the interplay between individual features and their contributions to model outputs, highlighting the clinical interpretability and utility of the LightGBM model.
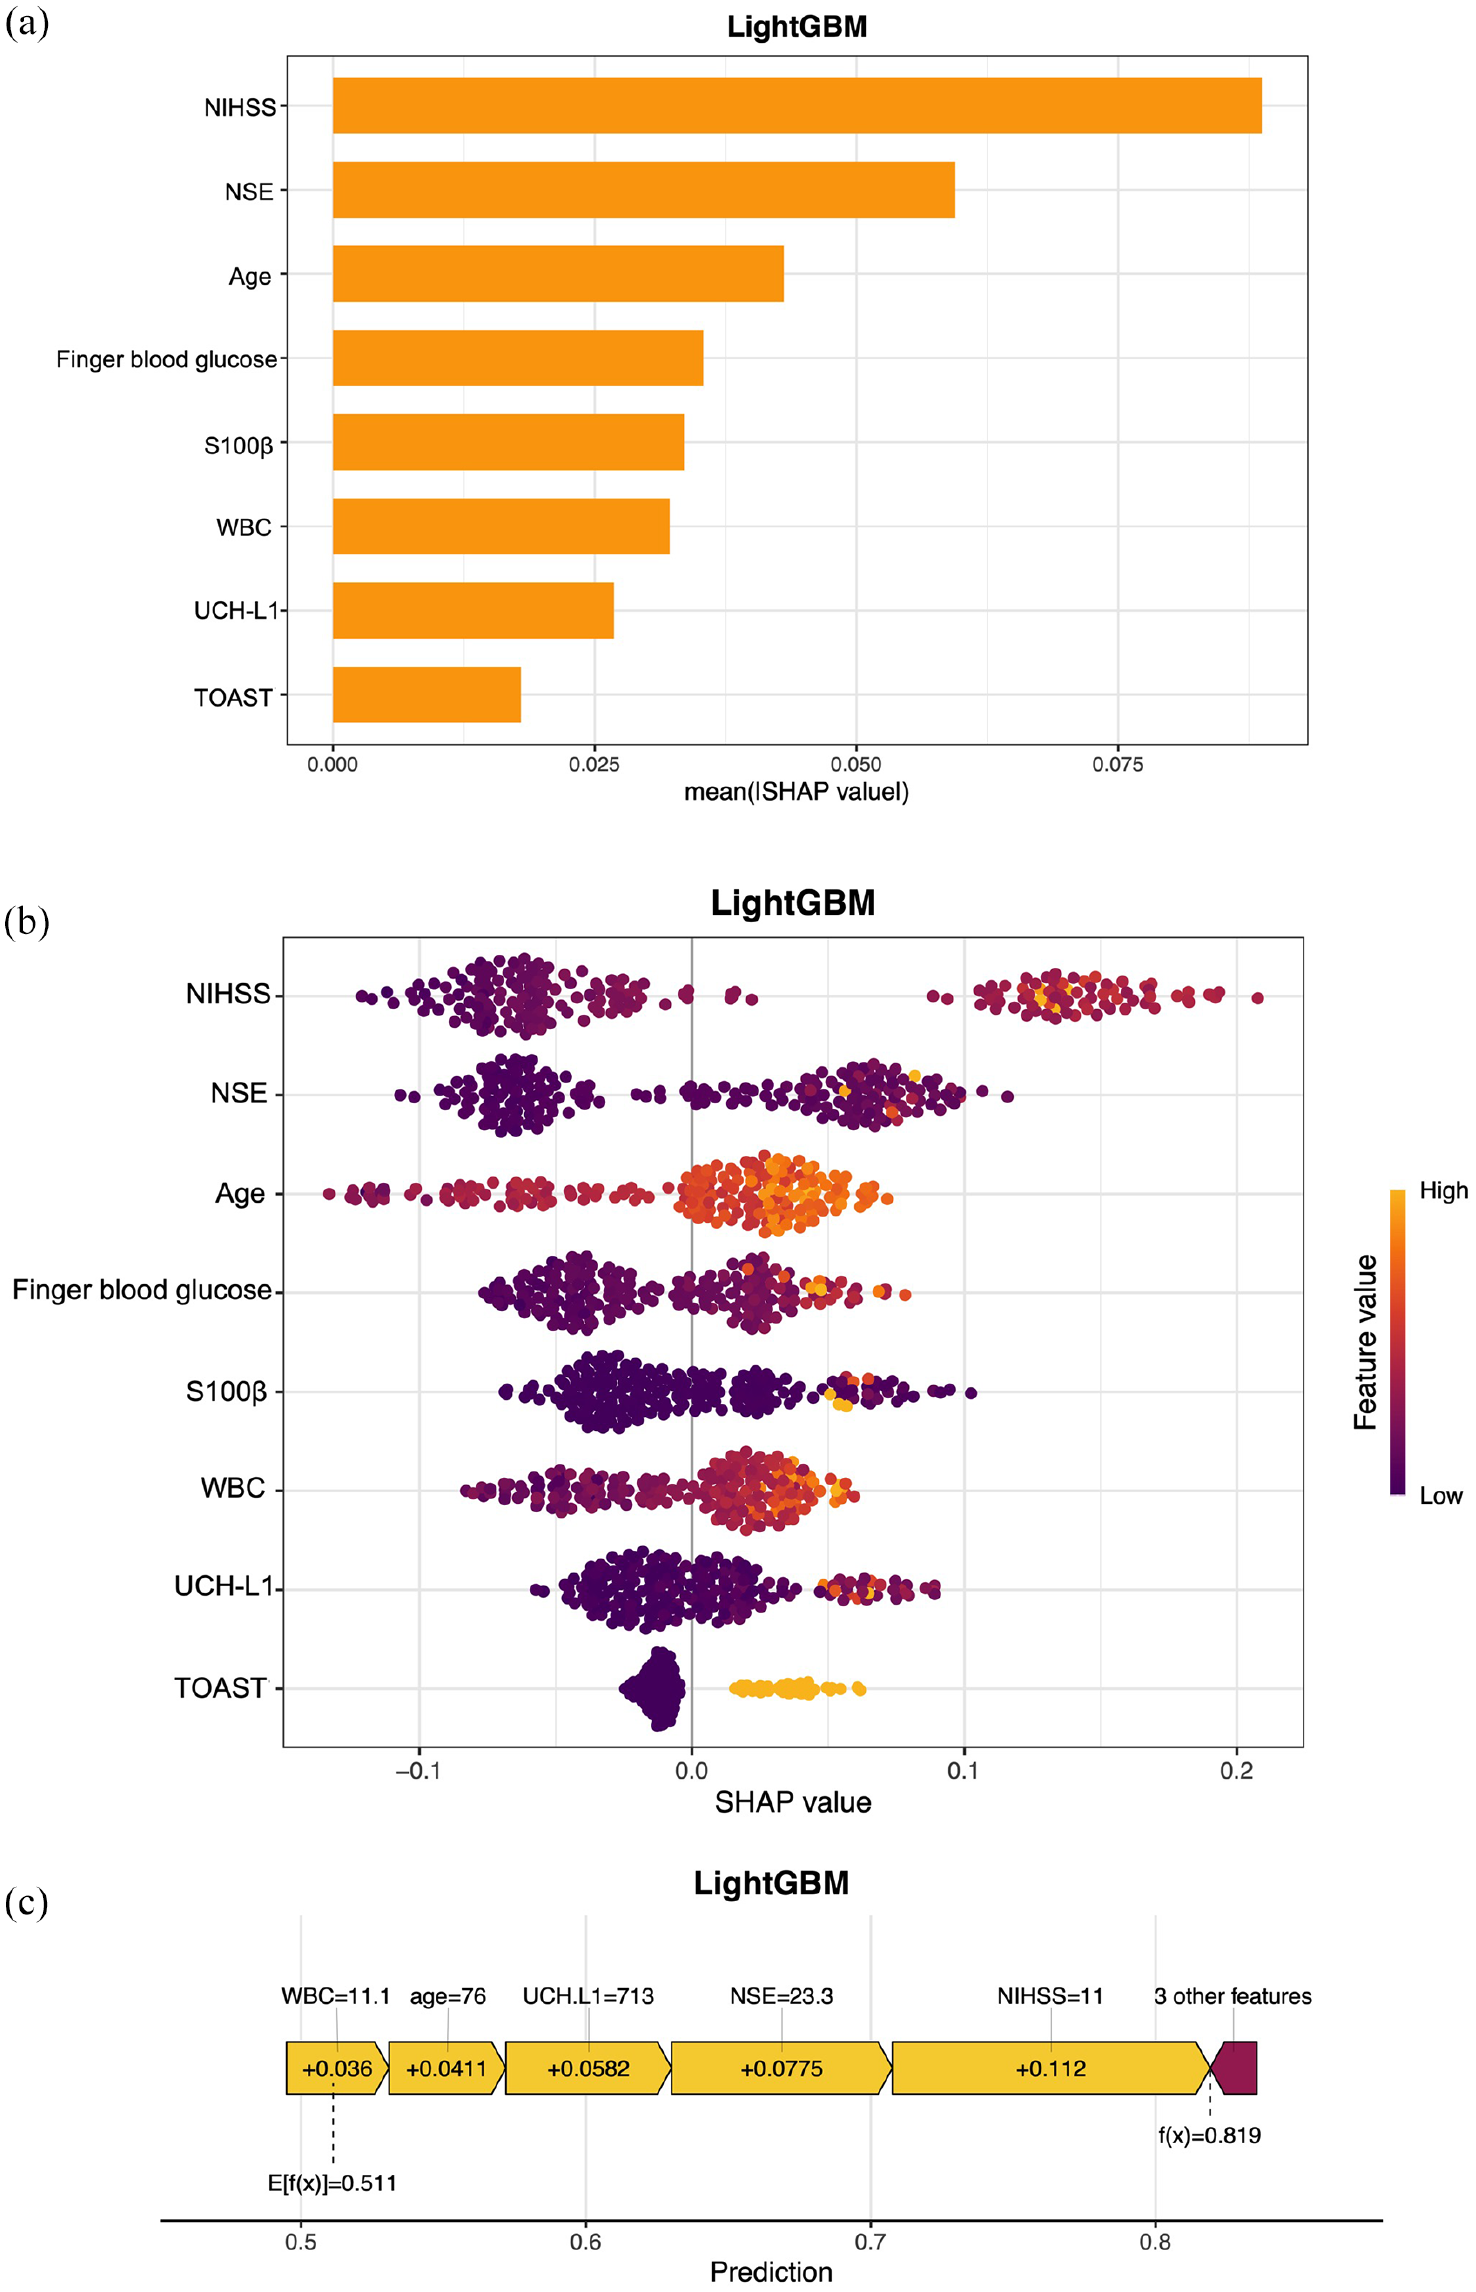
Model interpretation based on SHAP. (a) Visual representation of the ranked risk factors contributing to the outcome. The ranking of these features is as follows: admission NIHSS score, NSE, age, finger blood glucose, S100β, WBC, UCH-L1, and TOAST. (b) The impact of the top 8 features on predictive outcomes in the LightGBM model. Each dot represents the SHAP value of a sample, with the color gradient (purple to yellow) indicating the magnitude of the feature values. The vertical axis displays the ranking of feature importance, while the SHAP values show the correlation and distribution of each feature with the predicted outcome. (c) SHAP Force Plot for a single patient. The values of important features are shown at the top. E[f(x)] = 0.511 indicates the base value of shake of the overall sample. The SHAP value for this patient is 0.819 (high possibility of poor outcome).
External validation
To evaluate the generalizability and robustness of the model, external validation was performed using data from 214 patients recruited from 15 additional hospitals. The LightGBM model demonstrated good predictive performance on the external dataset, achieving an AUC of 0.714 (Figure 6(a)). The decision curve analysis for the external validation cohort also indicated a favorable net benefit across a threshold probability range of 0.1–0.8 (Figure 6(b)). LightGBM model retained its clinical utility and provided meaningful predictions across a wide range of decision-making thresholds. The calibration slope for the external validation cohort demonstrated good agreement between predicted and observed probabilities (Figure 6(c)), suggesting that the model’s predictions were well-calibrated and that the predicted probabilities closely matched the actual outcomes, further supporting the reliability of the model.

External validation of the model. (a) ROC curve for the external validation cohort. (b) Calibration curve for the external validation cohort. (c) Decision curve for the external validation cohort.
Discussion
This study aimed to develop a predictive model for 3-month post-thrombolysis outcomes using demographic, clinical, and biomarker data. The LightGBM model emerged as the best-performing algorithm, showcasing its ability to balance accuracy, sensitivity, and clinical interpretability. This model demonstrated superior predictive performance with an AUC of 0.846 in the training dataset and 0.714 during external validation. Other metrics, such as the F1-score (0.789) and the decision curve analysis, supported its clinical utility, particularly for probability thresholds between 0.1 and 0.9.
In our study, eight critical predictors were identified using LASSO regression: TOAST, age, admission NIHSS score, WBC, finger blood glucose, UCH-L1, S100β, and NSE. TOAST, age, admission NIHSS score, WBC, and finger blood glucose are commonly used prognostic factors for stroke. Three serum biomarkers, UCH-L1, S100β, and NSE, are all elevated in AIS and demonstrate predictive value in stroke prognosis.16,17 UCH-L1 is a neuronal cytoplasmic deubiquitinase that is highly expressed in neurons and is associated with synaptic plasticity and self-repair mechanisms following injury.18,19 We previously found that UCH-L1 was closely related to hemorrhagic transformation after thrombolysis. 20 S100β plays a role in neural inflammation and significantly regulates immune responses and the inflammatory cascade. 21 It also correlates with stroke severity and outcomes. 22 NSE reflects neuronal injury and is closely associated with clinical outcomes in stroke.17,23 However, their standalone diagnostic value is limited, and they are often used in combination with other markers for better predictive accuracy.18,24 Following a comparison with a model that did not incorporate biomarkers, we demonstrate that the integration of biomarkers UCH-L1, S100β, and NSE into predictive models enhances the precision of risk stratification in thrombolysis patients. This can guide clinicians in tailoring treatment strategies and counseling families about prognosis.
Outcome prediction has considerable influence on decision-making and treatment strategies in the post-thrombolysis management of stroke patients. Several studies have utilized ML methods for prognostic research on cerebrovascular diseases.7,25,26 Our LightGBM model achieved balanced sensitivity (0.763) and specificity (0.759) in predicting 3-month post-stroke outcomes and demonstrated good performance in external validation, confirming its strong generalizability.
There are several limitations in our study. First, the study population was primarily derived from a single stroke center. Although external validation was conducted using data from 15 additional hospitals, the model’s performance needs validation in more diverse cohorts. Second, the model relies on a limited set of biomarkers and clinical features might overlook other potential factors that could influence outcomes. Additionally, while the SHAP analysis provided insights into feature importance, further studies are needed to assess the model’s clinical utility in real-world settings.
Conclusion
The study demonstrated the utility of integrating serum brain injury biomarkers with ML to predict 3-month thrombolysis outcomes in AIS. The LightGBM model stands out for its clinical applicability, interpretability, and robust predictive performance. Future studies should explore broader applications of ML methods in diverse populations and clinical settings.
Supplemental Material
sj-docx-1-tan-10.1177_17562864251342429 – Supplemental material for Prediction of outcomes following intravenous thrombolysis in patients with acute ischemic stroke using serum UCH-L1, S100β, and NSE: a multicenter prospective cohort study employing machine learning methods
Supplemental material, sj-docx-1-tan-10.1177_17562864251342429 for Prediction of outcomes following intravenous thrombolysis in patients with acute ischemic stroke using serum UCH-L1, S100β, and NSE: a multicenter prospective cohort study employing machine learning methods by Ming-Ya Luo, Yang Qu, Peng Zhang, Reziya Abuduxukuer, Li-Juan Wang, Li-Chong Yang, Zhi-Guo Li, Xiao-Dong Liu, Ce Han, Dan Li, Wei-Jia Wang, Dian-Ping Lv, Ming Liu, Jian Gao, Jing Xu, Yongfei Jiang, Hai-Nan Chen, Fu-Jin Li, Li-Ming Sun, Qi-Dong Sun, Yingbin Qi, Si-Yin Sun, Yu Zhang, Zhen-Ni Guo and Yi Yang in Therapeutic Advances in Neurological Disorders
Supplemental Material
sj-docx-2-tan-10.1177_17562864251342429 – Supplemental material for Prediction of outcomes following intravenous thrombolysis in patients with acute ischemic stroke using serum UCH-L1, S100β, and NSE: a multicenter prospective cohort study employing machine learning methods
Supplemental material, sj-docx-2-tan-10.1177_17562864251342429 for Prediction of outcomes following intravenous thrombolysis in patients with acute ischemic stroke using serum UCH-L1, S100β, and NSE: a multicenter prospective cohort study employing machine learning methods by Ming-Ya Luo, Yang Qu, Peng Zhang, Reziya Abuduxukuer, Li-Juan Wang, Li-Chong Yang, Zhi-Guo Li, Xiao-Dong Liu, Ce Han, Dan Li, Wei-Jia Wang, Dian-Ping Lv, Ming Liu, Jian Gao, Jing Xu, Yongfei Jiang, Hai-Nan Chen, Fu-Jin Li, Li-Ming Sun, Qi-Dong Sun, Yingbin Qi, Si-Yin Sun, Yu Zhang, Zhen-Ni Guo and Yi Yang in Therapeutic Advances in Neurological Disorders
Supplemental Material
sj-docx-3-tan-10.1177_17562864251342429 – Supplemental material for Prediction of outcomes following intravenous thrombolysis in patients with acute ischemic stroke using serum UCH-L1, S100β, and NSE: a multicenter prospective cohort study employing machine learning methods
Supplemental material, sj-docx-3-tan-10.1177_17562864251342429 for Prediction of outcomes following intravenous thrombolysis in patients with acute ischemic stroke using serum UCH-L1, S100β, and NSE: a multicenter prospective cohort study employing machine learning methods by Ming-Ya Luo, Yang Qu, Peng Zhang, Reziya Abuduxukuer, Li-Juan Wang, Li-Chong Yang, Zhi-Guo Li, Xiao-Dong Liu, Ce Han, Dan Li, Wei-Jia Wang, Dian-Ping Lv, Ming Liu, Jian Gao, Jing Xu, Yongfei Jiang, Hai-Nan Chen, Fu-Jin Li, Li-Ming Sun, Qi-Dong Sun, Yingbin Qi, Si-Yin Sun, Yu Zhang, Zhen-Ni Guo and Yi Yang in Therapeutic Advances in Neurological Disorders
Supplemental Material
sj-docx-4-tan-10.1177_17562864251342429 – Supplemental material for Prediction of outcomes following intravenous thrombolysis in patients with acute ischemic stroke using serum UCH-L1, S100β, and NSE: a multicenter prospective cohort study employing machine learning methods
Supplemental material, sj-docx-4-tan-10.1177_17562864251342429 for Prediction of outcomes following intravenous thrombolysis in patients with acute ischemic stroke using serum UCH-L1, S100β, and NSE: a multicenter prospective cohort study employing machine learning methods by Ming-Ya Luo, Yang Qu, Peng Zhang, Reziya Abuduxukuer, Li-Juan Wang, Li-Chong Yang, Zhi-Guo Li, Xiao-Dong Liu, Ce Han, Dan Li, Wei-Jia Wang, Dian-Ping Lv, Ming Liu, Jian Gao, Jing Xu, Yongfei Jiang, Hai-Nan Chen, Fu-Jin Li, Li-Ming Sun, Qi-Dong Sun, Yingbin Qi, Si-Yin Sun, Yu Zhang, Zhen-Ni Guo and Yi Yang in Therapeutic Advances in Neurological Disorders
Footnotes
Appendix
Acknowledgements
We thank the Department of Biobank, Division of Clinical Research, and the First Hospital of Jilin University for providing human tissues.
Declarations
Supplemental material
Supplemental material for this article is available online.
References
Supplementary Material
Please find the following supplemental material available below.
For Open Access articles published under a Creative Commons License, all supplemental material carries the same license as the article it is associated with.
For non-Open Access articles published, all supplemental material carries a non-exclusive license, and permission requests for re-use of supplemental material or any part of supplemental material shall be sent directly to the copyright owner as specified in the copyright notice associated with the article.