
Abstract
Background:
The aim of this study was to establish a nomogram model for individualized early prediction of the 3-month prognosis in patients with acute ischemic stroke (AIS) who were treated with intravenous recombinant tissue plasminogen activator (rt-PA) thrombolysis.
Methods:
A total of 691 patients were included in this study; 564 patients were included in the training cohort, while 127 patients were included in the test cohort. The main outcome measure was a 3-month unfavorable outcome (modified Rankin Scale 3–6). To construct the nomogram model, stepwise logistic regression analysis was applied to select the significant predictors of the outcome. The discriminative performance of the model was assessed by calculating the area under the receiver operating characteristic curve (AUC-ROC). A decision curve analysis was used to evaluate prognostic value of the model.
Results:
The initial National Institutes of Health Stroke Scale [NIHSS, odds ratio (OR), 1.35; 95% confidence interval (CI), 1.28–1.44; p < 0.001], delta NIHSS (changes in the NIHSS score from baseline to 24 h, OR, 0.75; 95% CI, 0.70–0.79; p < 0.001), hypertension (OR, 2.07; 95% CI, 1.32–3.31; p = 0.002), hyperhomocysteinemia (Hhcy, OR, 2.18; 95% CI, 1.20–4.11; p = 0.013), and the ratio of high-density lipoprotein cholesterol (HDL-C) to low-density lipoprotein cholesterol (LDL-C) (HDL-C/LDL-C, OR, 3.29; 95% CI, 1.00–10.89; p = 0.049) (N2H3) were found to be independent predictors of a 3-month unfavorable outcome from multivariate logistic regression analysis and were incorporated in the N2H3 nomogram model. The AUC-ROC of the training cohort was 0.872 (95% CI, 0.841–0.902), and the AUC-ROC of the test cohort was 0.900 (95% CI, 0.848–0.953).
Conclusion:
The study presented the N2H3 nomogram model, with initial NIHSS score, delta NIHSS, hypertension, Hhcy, and HDL-C/LDL-C as predictors. It therefore provides an individualized early prediction of the 3-month unfavorable outcome in AIS patients treated with intravenous rt-PA thrombolysis.
Introduction
Ischemic stroke is highly prevalent worldwide. As one of the leading causes of disability and mortality, ischemic stroke places a significant burden on patients and caregivers. Thrombolysis has been found to be the most effective medical treatment for acute ischemic stroke (AIS) patients. The primary thrombolytic agent, recombinant tissue plasminogen activator (rt-PA), is the most widely used thrombolytic drug worldwide.1 –4 Unfortunately, some patients still experience functional deficits after rt-PA thrombolysis. Accurate and early prediction of the clinical outcome for individual AIS patients who receive rt-PA treatment is needed to provide a reasonable approach to patient management. 5
A series of prognostic models established using various statistical methods have been reported in the past few decades with the aim of predicting long-term patient outcome after intravenous thrombolysis.6 –11 As a graphical statistical instrument, nomograms make it possible to individually predict outcomes by calculating the scores of each individual based on their own characteristics. The nomogram has been used widely for clinical decision making in multiple clinical conditions, including ischemic stroke, myocardial infarction, and cancer.5,12 –16 Nomograms have also been used to predict outcome of patients receiving thrombolysis, including the START (National Institutes of Health Stroke Scale score, age, pre-stroke mRS score, onset-to-treatment time) nomogram for prediction of unfavorable outcome and the STARTING-SICH (systolic blood pressure, age, onset-to-treatment time for thrombolysis, National Institutes of Health Stroke Scale score, glucose, aspirin alone, aspirin plus clopidogrel, anticoagulant with INR ⩽1.7, current infarction sign, hyperdense artery sign) nomogram for prediction of symptomatic intracerebral hemorrhage.5,17
The aim of this present study was to develop and validate a simple and reliable nomogram model for early and individual prediction of 3-month prognosis in AIS patients who treated with intravenous thrombolysis. To obtain a stronger power of prediction, we use both clinical characteristics and laboratory tests as variables.
Methods
Study design and participants
The study was conducted according to the principles of the Declaration of Helsinki, and was approved by the Ethics Committee of the First Hospital of Jilin University (approval code: 2015-156). This retrospective study, based on a prospective database, included consecutive patients with AIS who received intravenous thrombolysis with rt-PA at the China National Comprehensive Stroke Center between January 2016 and June 2019. Patients who were treated from January 2016 to December 2018 were included in the training cohort, while those who were treated from January 2019 to June 2019 were included in the test cohort. Intravenous thrombolysis was administrated within 4.5 h of onset for each patient according to the recommendations of current guidelines and the decision of the treating physicians.18 –20 All patients received standard medical treatment after thrombolysis. Patients with a pre-stroke mRS (modified Rankin Scale) >2, who were treated with endovascular procedure after intravenous thrombolysis, who died within 24 h, who were diagnosed with conditions mimicking stroke or hematopathy, had incomplete data, or who were lost to follow up were excluded from this study. The process of patient inclusion is shown in Figure 1.

Study flowchart.
Data collection
Demographic features, vascular risk factors, laboratory test, as well as clinical and follow-up information of patients were collected from the database. Vascular risk factors included hypertension [defined as taking oral antihypertensive drugs, systolic blood pressure (SBP) ⩾140 mm Hg or diastolic blood pressure (DBP) ⩾90 mm Hg at discharge], diabetes mellitus (defined as previous use of glucose-lowering medication or having a clinical diagnosis of diabetes mellitus during hospitalization), hyperlipidemia (defined as previous use of lipid-lowering medication, total cholesterol ⩾5.18 mmol/l, triglycerides ⩾1.70 mmol/l, low-density lipoprotein cholesterol ⩾3.37 mmol/l, or high-density lipoprotein cholesterol <1.04 mmol/l), smoking (current or ex-smoker), hyperhomocysteinemia (Hhcy, defined as total homocysteine level ⩾10 μmol/l at discharge), and atrial fibrillation.21,22 Clinical information included initial National Institutes of Health Stroke Scale (NIHSS) score (NIHSS score before thrombolysis), delta NIHSS (changes in the NIHSS score from baseline to 24 h), admission SBP, admission DBP, and onset to rt-PA bolus time. Laboratory information collected on admission included serum glucose level, white blood cell (WBC) count, neutrophil to lymphocyte ratio (NLR), platelet to neutrophil ratio (PNR), platelet count, international normalized ratio (INR), prothrombin time (PT), and prothrombin time activity (PTA). Laboratory information collected after thrombolysis included homocysteine level, total cholesterol level, triglyceride level, the ratio of high-density lipoprotein cholesterol to low-density lipoprotein cholesterol (HDL-C/LDL-C), and serum uric acid level, all of which were collected in the morning following admission after overnight fasting.
Outcomes
The clinical outcome was assessed at 3 months using the mRS. While mRS scores of 3–6 were defined as an unfavorable outcome, mRS scores of 0–2 were defined as a favorable outcome.
Statistical analysis
Statistical analysis was performed using R statistical software (version 4.0.0; R Foundation for Statistical Computing, Vienna, Austria). Continuous variables were expressed as means [standard deviation (SD)] or medians [interquartile range (IQR)], while categorical variables were expressed as n (%), as appropriate. Normality of distribution for continuous variables was evaluated using the Kolmogorov–Smirnov goodness-of-fit test.
To construct the nomogram, binary logistic regression analysis was applied to select the significant predictors of outcome. Variables with a p < 0.1 in the univariate analysis were included in multivariate logistic regression analysis using a backward-selection method. The variables with a p < 0.05 in the binary logistic regression analysis were considered statistically significant. The nomogram was developed based on the results obtained using the binary logistic regression model. The nomogram was externally validated using the test cohort. The model was also internally validated using all data of the training and test cohorts by preforming 10-fold cross-validation. Discriminative performance was measured by calculation of the area under the receiver operating characteristic curve (AUC-ROC). Calibration was tested using a calibration plot with bootstraps of 1000 resamples, which described the degree of fit between actual and nomogram-predicted outcome. Decision curve analysis was used to evaluate the validity of the nomogram.
Results
In total, 691 patients were included in this study, 564 patients (median age, 63 years; 72.52% male) were included in the training cohort, while 127 patients (median age, 62 years; 71.65% male) were included in the test cohort. The proportion of patients with 3-month unfavorable outcome was 36.17% (n = 204) in the training cohort and 30.71% (n = 39) in the test cohort.
Table 1 shows the comparison of baseline characteristics between patients with favorable outcome and unfavorable outcome in the training cohort. Variables with p < 0.1 were considered potential predictors of outcome and were included in the multivariate logistic regression analysis. These included age, hypertension, atrial fibrillation, Hhcy, admission SBP, admission DBP, initial NIHSS score, delta NIHSS, serum glucose level, WBC count, PNR, INR, PT, PTA, triglyceride level, HDL-C/LDL-C, and serum uric acid level. According to multivariate logistic regression analysis, the initial NIHSS score [odds ratio (OR), 1.35; 95% confidence interval (CI), 1.28–1.44; p < 0.001], delta NIHSS (OR, 0.75; 95% CI, 0.70–0.79; p < 0.001), hypertension (OR, 2.07; 95% CI, 1.32–3.31; p = 0.002), Hhcy (OR, 2.18; 95% CI, 1.20–4.11; p = 0.013) and HDL-C/LDL-C level (OR, 3.29; 95% CI, 1.00–10.89; p = 0.049) (N2H3) were independent predictors of unfavorable outcome. The results of multivariable analyses for the 3-month outcome in the training cohort are shown in Table 2.
Comparison of baseline characteristics between patients with 3-month favorable outcome and unfavorable outcome in the training cohort.

DBP, diastolic blood pressure; Delta NIHSS, changes in the NIHSS score from baseline to 24 h; HDL-C/LDL-C, the ratio of high-density lipoprotein cholesterol to low-density lipoprotein cholesterol; Hhcy, hyperhomocysteinemia (defined as total homocysteine level ⩾10 μmol/l); INR, international normalized ratio; NIHSS, National Institutes of Health Stroke Scale; NLR, neutrophil to lymphocyte ratio; PNR, platelet to neutrophil ratio; PT, prothrombin time; PTA, prothrombin time activity; rt-PA, recombinant tissue-type plasminogen activator; SBP, systolic blood pressure; WBC, white blood cell.
Independent risk factors associated with the 3-month outcome after intravenous thrombolysis in the training cohort.

Delta NIHSS, changes in the NIHSS score from baseline to 24 h; HDL-C/LDL-C, the ratio of high-density lipoprotein cholesterol to low-density lipoprotein cholesterol; Hhcy, hyperhomocysteinemia (defined as total homocysteine level ⩾10 μmol/l); NIHSS, National Institutes of Health Stroke Scale.
Figure 2 shows the N2H3 nomogram established based on the variables that enabled researchers to predict outcome independently after the multivariable analyses. The total points calculated from the sum of points of the 5 predictors in N2H3 nomogram were found to be positively correlated with the risk of unfavorable outcome.

The N2H3 Nomogram for predicting the 3-month outcome. Points were assigned for initial NIHSS score, delta NIHSS, hypertension, Hhcy, and HDL-C/LDL-C by drawing a line upward from the corresponding values to the “points line.” The “total points” are calculated as the sum of the individual score of each of the five variables included in the nomogram.
The discriminative performance of the model was assessed by calculating the AUC-ROC of the training cohort (AUC, 0.872; 95% CI, 0.841–0.902). The model was validated externally using the AUC-ROC of the test cohort (AUC, 0.900; 95% CI, 0.848–0.953). After 10-fold cross-validation was performed on all data of the training and test cohorts, the max AUC value was found to be 0.944 (95% CI, 0.894–0.993) (Figure 3).

Receiver operating characteristic (ROC) curve of the training cohort (A), test cohort (B), and the 10-fold cross-validation (C).
Figure 4 shows the calibration plot of the nomogram, which compares the prediction of unfavorable outcome between the nomogram prediction and actual observation. The calibration plot suggested good predictive accuracy of the nomogram in both training cohort (A) and test cohort (B).
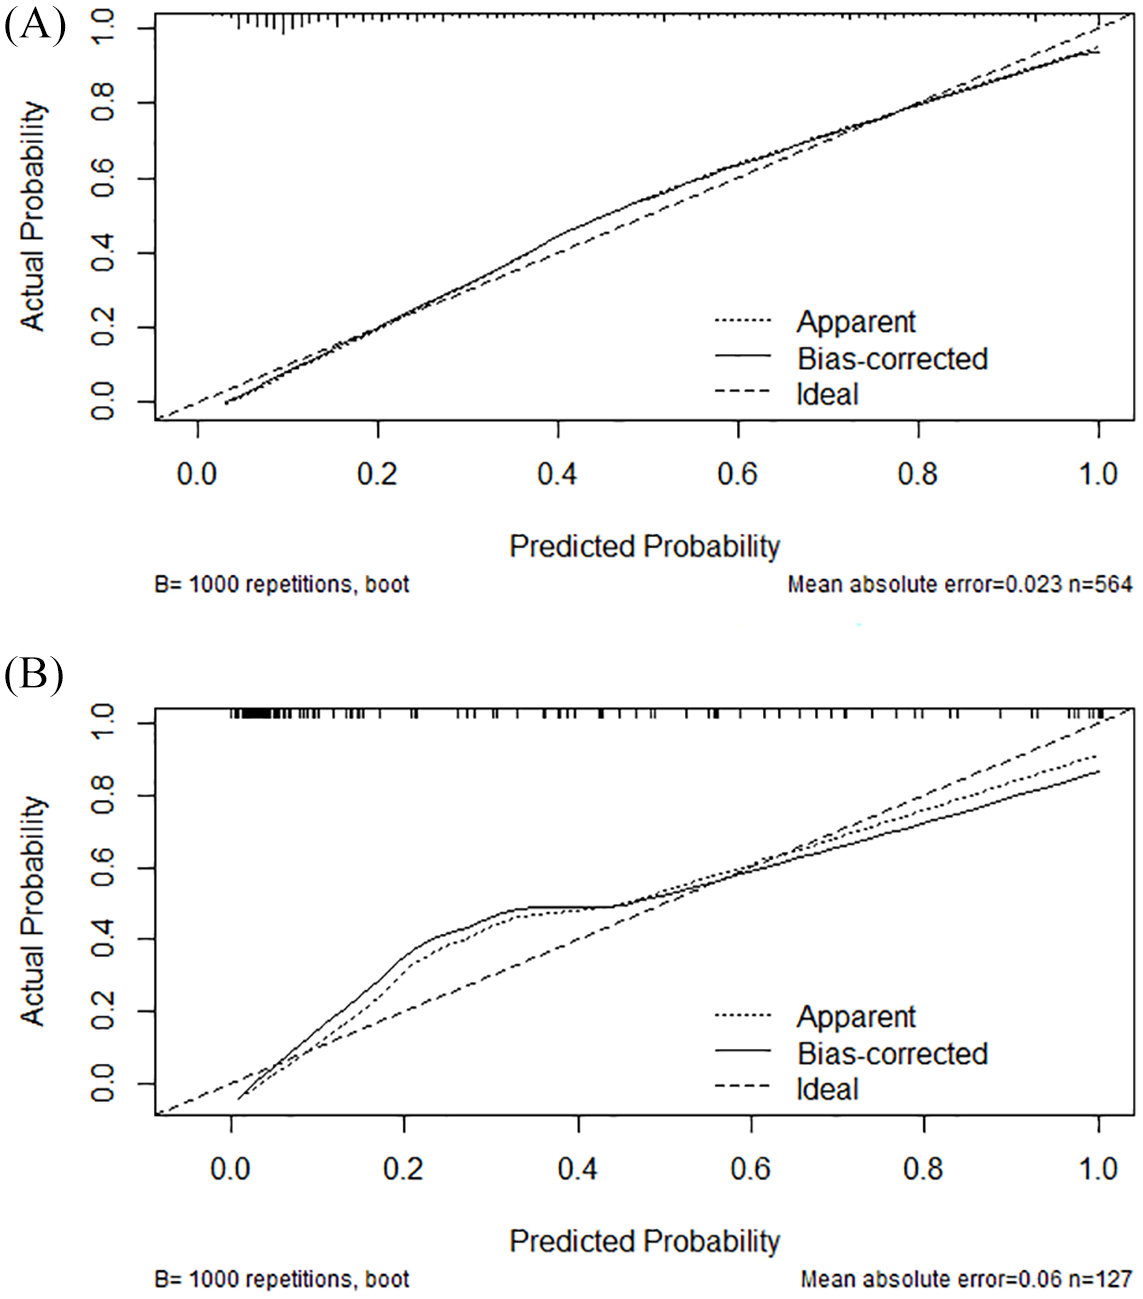
Calibration plot of the N2H3 nomogram in the training (A) and test cohorts (B). The dotted line represents the performance of the nomogram; the solid line corrects for any bias in the nomogram; and the dashed line represents the reference line where an ideal nomogram would lie.
A decision curve analysis (DCA) was performed to evaluate prognostic value of the current prediction model. DCA estimates the net benefit of a model based on the difference between the number of true and false-positive results. As shown in Figure 5, using the N2H3 nomogram for outcome prediction processed greater net benefit than baseline NIHSS score alone.

Decision curve analysis of the N2H3 nomogram of training cohort (A) and test cohort (B). The red line displays the net benefit of the prediction of NIHSS score only. The blue line displays the net benefit of the prediction of the full nomogram model. The gray line assures that all patients develop unfavorable outcome. The black line assures that no patients develop unfavorable outcome.
Discussion
The study found that initial NIHSS score, delta NIHSS, hypertension, Hhcy, and HDL-C/LDL-C were independent predictors of 3-month unfavorable outcome in AIS patients treated with intravenous rt-PA thrombolysis from multivariate logistic regression analysis. Using these five predictive factors, the N2H3 nomogram was developed to assess the probability of 3-month unfavorable outcome in these patients.
The predictors involved in this model are all routine and easy to obtain; moreover, most of them have previously been reported to be linked with unfavorable outcomes in AIS patients. Initial stroke severity evaluated using the NIHSS score on admission is a primary determinant of clinical outcome among patients with AIS and often be used in prognosis prediction models. Early response after thrombolysis may explain much of the long-term outcomes. Post-treatment markers of stroke severity that included changes in NIHSS and 24-h NIHSS have been shown to be better predictors of subjects’ clinical and functional outcomes than the initial NIHSS score.23 –27 Changes in post-treatment NIHSS over the first 24 h may be a reflection of reperfusion, partly distinguishing patients with clinically effective reperfusion from those with futile or no reperfusion. 26 Since we did not collect vascular examination data before and after treatment, the relation between reperfusion status and NIHSS score changes could not be analyzed. Nevertheless, delta NIHSS is the strongest predictor of outcome in our model, which is in accordance with the results of previous studies.
In addition to stroke severity, age is one of the major determinants of stroke outcomes.11,28 Elderly patients were prone to have poorer outcomes compared with young patients after rt-PA thrombolysis treatment in early clinical trials.29,30 However, recent studies have provided inconsistent findings.31 –33 Recently, a pooled analysis of seven randomized clinical trials by Bluhmki and colleagues showed that the odds of a good outcome following rt-PA treatment in AIS patients were independent of age. 34 The differences in the measurement of outcome could be an explanation of those inconsistent results. Besides, elderly patients were more likely to have complications such as atrial fibrillation and hypertension, as well as higher NIHSS score, all of which may influence stroke outcomes. 30 In the present study, although patients with an unfavorable outcome had a higher median age than those with a favorable outcome, the effect of age on outcome was not significant after adjusting for confounding variables.
Higher LDL-C level is a risk factor of ischemic stroke; this has been proven in previous studies to be associated with patient outcomes. 35 HDL-C level is also attributed to the prognosis in AIS patients treated with thrombolysis. 36 The ratio of the two variables was found to be an even better predictor of cardiovascular events and atherosclerotic burden.37,38 Given the fact that both higher LDL-C and lower HDL-C levels are related with unfavorable outcomes in patients with ischemic stroke, the HDL-C/LDL-C may be a stronger predictor. In the present study, we found that a higher HDL-C/LDL-C was independently associated with 3-month unfavorable outcome, which was opposite from the result of previous studies. In fact, evidence of relation between serum cholesterol level and stroke outcome is inconsistent. Several studies have reported lipid paradox, that is, elevated cholesterol levels improved short-term functional outcome and long-term survival,39 –41 while lower cholesterol levels contributed to short-term mortality. 42 However, the potential mechanism of this paradox observation remains unknown. The observation of the HDL-C/LDL-C paradox has not been reported yet. Considering the small sample of our study, this result needs further study to be verified.
In our study, hypertension, rather than the level of blood pressure, was found to be an independent predictor of outcome. Blood pressure values vary considerably during the whole process. Previous studies have revealed that both high and low blood pressure were independent prognostic factors for poor outcome in ischemic stroke patients.43,44 Hypertension has been included in previous AIS prognostic models, such as the THRIVE score. 10 Another variable of our nomogram, Hhcy, is also a proved predictor of outcome in ischemic stroke. 45 A higher level of homocysteine was reported to be associated with an increased risk of poor outcome after thrombolysis in AIS patients.46 –48 Although found to be independent predictors after multivariable logistic analysis, hypertension and Hhcy are only a small proportion of our model.
The AUC value of the N2H3 nomogram was 0.872 (95% CI, 0.841–0.902), which is higher than the value of the START nomogram (AUC, 0.766; 95% CI, 0.707–0.826). 5 The variables of the START nomogram could be collected before thrombolysis. Patients in whom a high probability of unfavorable outcome were predicted should be considered for further treatment, especially endovascular thrombectomy. In our nomogram, although several variables were derived from clinical examination and laboratory test results after thrombolysis, it is still possible to select patients with a high risk of unfavorable outcome. Further neuroprotective drugs such as edaravone and n-butylphthalide,49,50 and intensive rehabilitation, should be considered for these patients. Of course, patients with a calculated prediction of a positive outcome should by no means withdraw from beneficial treatments. The most noteworthy strength of a nomogram is to serve as a useful tool for individualized prediction of the probability of unfavorable outcomes. From the clinicians’ perspective, as a quantitative indicator, using a nomogram can make things easy when explaining the prognosis to patients and their families.
DCA is a method used to assess the prediction value and clinical usefulness of a model (like a nomogram).51,52 Distinguishing patients with high and low risk of unfavorable outcome is the main purpose of this nomogram. For any given probability threshold, the nomogram with the greatest net benefit would be the most preferred model. In the present study, DCA showed that using the N2H3 nomogram with limited variables for outcome prediction was better than using the initial NIHSS score alone. The N2H3 nomogram was found to be clinically useful in predicting outcome and could facilitate the early identification of patients who are candidates for further therapy.
There are several limitations that need to be addressed in this study. First, the clinical data was collected retrospectively. Second, this is a single-center study with a relatively small sample size, some variables (like serum glucose and onset to rt-PA bolus time) that were reported in previous studies to be associated with AIS outcomes were not observed in our study.6,53 In addition, the test cohort comes from the same stroke center from where the training cohort was derived. This nomogram needs to be tested in other centers in future studies.
Conclusion
Our study developed and validated a reliable N2H3 nomogram model, which is composed of history of initial NIHSS, delta NIHSS, hypertension, Hhcy, and HDL-C/LDL-C. The N2H3 nomogram could provide individualized early prediction of the 3-month unfavorable outcome in AIS patients who were treated with intravenous rt-PA thrombolysis, and thus facilitate the early identification of patients who are candidates for further therapy.
Supplemental Material
Main_document-_Version_2_Referred_and_not-referred_to_CLP – Supplemental material for Early prediction of the 3-month outcome for individual acute ischemic stroke patients who received intravenous thrombolysis using the N2H3 nomogram model
Supplemental material, Main_document-_Version_2_Referred_and_not-referred_to_CLP for Early prediction of the 3-month outcome for individual acute ischemic stroke patients who received intravenous thrombolysis using the N2H3 nomogram model by Shan Lv, Yu Song, Fu-Liang Zhang, Xiu-Li Yan, Jie Chen, Liang Gao, Zhen-Ni Guo and Yi Yang in Therapeutic Advances in Neurological Disorders
Footnotes
Acknowledgements
We gratefully thank all the patients and their families, and all the staff associated with this study.
Declaration of conflicting interests
The author(s) declared no potential conflicts of interest with respect to the research, authorship, and/or publication of this article.
Funding
The author(s) disclosed receipt of the following financial support for the research, authorship, and/or publication of this article: This work was supported by the National Natural Science Foundation of China (81771243), the Program for JLUSTIRT (2017TD-12), and the Jilin Provincial Key Laboratory (20190901005JC) to Yi Yang.
Supplemental material
Supplemental material for this article is available online.
References
Supplementary Material
Please find the following supplemental material available below.
For Open Access articles published under a Creative Commons License, all supplemental material carries the same license as the article it is associated with.
For non-Open Access articles published, all supplemental material carries a non-exclusive license, and permission requests for re-use of supplemental material or any part of supplemental material shall be sent directly to the copyright owner as specified in the copyright notice associated with the article.