
Abstract
Background:
Posterior cortex epilepsy (PCE) primarily comprises seizures originating from the occipital, parietal, and/or posterior edge of the temporal lobe. Electroclinical dissociation and subtle imaging representation render the diagnosis of PCE challenging. Improved methods for accurately identifying patients with PCE are necessary.
Objectives:
To develop a novel voxel-based image postprocessing method for better visual identification of the neuroimaging abnormalities associated with PCE.
Design:
Multicenter, retrospective study.
Methods:
Clinical and imaging features of 165 patients with PCE were retrospectively reviewed and collected from five epilepsy centers. A total of 37 patients (32.4% female, 20.2 ± 8.9 years old) with magnetic resonance imaging (MRI)-negative PCE were finally included for analysis. Image postprocessing features were calculated over a neighborhood for each voxel in the multimodality data. The postprocessed maps comprised structural deformation, hyperintense signal, and hypometabolism. Five raters from three different centers were blinded to the clinical diagnosis and determined the neuroimaging abnormalities in the postprocessed maps.
Results:
The average accuracy of correct identification was 55.7% (range from 43.2 to 62.2%) and correct lateralization was 74.1% (range from 64.9 to 81.1%). The Cronbach’s alpha was 0.766 for the correct identification and 0.683 for the correct lateralization with similar results of the interclass correlation coefficient, thus indicating reliable agreement between the raters.
Conclusion:
The image postprocessing method developed in this study can potentially improve the visual detection of MRI-negative PCE. The technique could lead to an increase in the number of patients with PCE who could benefit from the surgery.
Introduction
Posterior cortical epilepsy (PCE) is a type of epilepsy that is characterized by seizures that primarily originate from the occipital, parietal, and/or posterior temporal lobes of the brain. 1 PCE accounts for only 10% of all the reported epilepsy surgeries. 2 The identification of PCE is particularly challenging in the presurgical evaluation as the ambiguous electroclinical information and subtle neuroimaging representations are usually insufficient to localize the epileptogenic area. 3
The poor lateralizing and localizing value of scalp electroencephalography (EEG) in PCE has been previously observed. The rapid spread of the seizures originating from the posterior cortex to other regions, such as the unilateral or bilateral temporal lobe and frontal lobe, along with the epileptogenic zone (EZ) buried in the posterior cortex, make precise identification of discharges extremely difficult.4,5 The varied ictal semiology of PCE serves as the major source of diagnostic error, resulting from propagating widely via multiple fascicular pathways to other regions of the brain and thus representing typical clinical features of the propagation zone, such as the temporolimbic seizure or the frontal lobe seizures (e.g. tonic, versive, hypermotor) and spasm. 6 A non-specific electroclinical pattern might be associated with a false localizing ‘pseudo-focus’. 7 Although the visual or somatosensory aura is conducive to the diagnosis of PCE, 23.3–75.0% of patients showed non-specific or failed to report auras.8,9 Moreover, it was also noted that no particular subtype of aura was specifically indicative of any particular cortical area in PCE. 10
Considering the indistinct electroclinical manifestations of PCE, neuroimaging undoubtedly can act as a potential tool for the localization of EZ in PCE. 11 Morphological and glucose metabolism abnormalities play an important role to localize the EZ and guide surgical strategy. 12 However, the data on the proportion of negative neuroimaging representation in PCE can vary, ranging from 5.3 to 37.5%.2,13–16 Overall, the subtle neuroimaging representation, combing unclear anatomic and neurophysiologic distinctions, can render the diagnosis of PCE challenging and reduce the advantages of surgical treatment. High-field magnetic resonance imaging (MRI), optimized MRI sequences, and sophisticated postprocessing analysis are currently employed to assist in delineating the EZ. However, the MRI representation of PCE typically exhibits blurred grey/white matter junctions, subtle increases in T2-weighted signal, and minor alterations in cerebral metabolism. While each representation provides valuable information, none on its own is sufficient for clear EZ identification, thereby posing challenges for diagnosis. 17 To improve the detection ability, several postprocessing approaches have been developed to enhance visualization, including voxel- and surface-based morphometry on structural images18–20 and signal intensity analysis of T2-weighted images. 21 For example, morphometric analysis program (MAP) was implemented based on modeling the characteristic MRI features of suspicious brain regions. The dysplastic abnormalities were characterized by subtle blurring of the grey-white junction, abnormal cortical gyration, or abnormal cortical thickness, thereby augmenting clinicians’ capacity to detect subtle cortical malformations with higher sensitivity of 90%. 22 However, these methods depending on subjective threshold to the processed images for visual diagnosis may affect the generalization in clinical settings. We therefore introduced computational voxel-wised bioinformatics approaches with the advantage of highlighting the characteristics of epileptogenic lesions. These approaches were expected to assist in localizing the epileptogenic tissue in the brain and provide quantitative information about the structural abnormalities, spatial signal intensity, and metabolism variation. 22 Considering the structural alterations, deformation-based morphometry (DBM) is an optimal approach to quantitatively evaluate the local volume changes between brains. 23
We hypothesize the measurements of structural deformation, signal intensity, and cerebral metabolism could be effectively utilized as a diagnostic tool to markedly increase the sensitivity for MRI-negative PCE.
Methods
Study population
Between January 2015 and December 2020, a total of 165 patients diagnosed with PCE after multidisciplinary evaluation from five epilepsy centers were screened for study eligibility (Figure 1). The inclusion criteria used were as follows: (a) underwent presurgical evaluation and the surgery; (b) postoperative pathology confirmed to suffer from epileptogenic lesions or seizure release after surgery; (c) negative (non-lesional) MRI based on definitions: no epileptogenic abnormalities findings assessed by the dedicated epilepsy neuroradiologists in the medical reports, as well as by epileptologists, neurosurgeons, and epilepsy neuroradiologists after further review during presurgical evaluation, taking into account the results of comprehensive noninvasive testing. The exclusion criteria used were (a) poor quality neuroimaging data, such as motion artifacts or aliasing or rippling related to eye movement (visual evaluation by W.H. with 10 years of experience and X.S. with 15 years of experience); (b) reoperation; (c) immature myelination at less than the age of 2 that might affect the signal intensity calculation; (d) lesions were not limited to the posterior cortex. A detailed medical history with electroclinical, neuroimaging, and, wherever indicated, invasive presurgical stereoelectroencephalography (SEEG) information was collected from these selected patients.

Flowchart depicting identification process for 165 consecutive patients who underwent presurgical evaluations at five epilepsy centers and diagnosed as MRI-negative posterior cortex epilepsy. A total of 125 patients were excluded based on exclusion criteria. Finally, this study consisted of 37 patients.
Each patient underwent preoperative multidisciplinary assessment, considering encephalitis history and concordant anatomo-electroclinical correlation for precise EZ localization. Subsequently, for cases presenting challenges in EZ localization or delineation for surgical resection, SEEG was conducted based on non-invasive approaches. Interpretation of SEEG data and postoperative pathology were used as adjunctive information to support the diagnosis.
Multimodal imaging dataset
All patients had the same neuroimaging protocol in presurgical evaluation, including three-dimensional (3D) T1-weighted magnetization prepared rapid acquisition gradient echo (T1WI MPGAGE), 3D T2-weighted fluid attenuated inversion recovery (T2WI FLAIR), and were subjected to 2-[
18
F] fluoro-2-deoxy-
Image preparation
T1WI MPRAGE images were reoriented to the anterior commissure-posterior commissure line by using the Display tool of statistical parametric mapping 12 (SPM12) software (Wellcome Department of Cognitive Neurology, University College, London, UK) running on Matlab 2021a (The MathWorks Inc, MA, USA). Image data preprocessing included (a) bias field inhomogeneity correction that was performed to remove radiofrequency inhomogeneity; (b) usage of a classical unified segmentation approach to segment the images into the grey matter (GM) and white matter (WM); (c) creation of an explicit mask by binarizing GM and WM images at the threshold of 0.4; 24 (d) The intracranial part of all images was extracted based on the mask; (e) intensity standardization to zero-mean and unit variance.25,26
Images postprocessing
Image-processing features were calculated for each individual voxel within the T1WI MPRAGE, T2WI FLAIR, and 18 FDG-PET modalities, thus resulting in a three-dimensional map for each feature. To calculate the structural deformation, DBM was performed by using CAT12 software. 27 DBM is based on the application of non-linear registration procedures to spatially normalize one brain to a template and then carry out the quantification of the local volume changes by a mathematical property of Jacobian determinant. The map of deformation was then mapped back to the native space. Thereafter, the FLAIR intensity signal and PET metabolic value were directly extracted from the preprocessing. Finally, in order to enhance the visibility of epileptogenic lesions, we generated a postprocessed map that integrates information from structural deformation, FLAIR intensity, and PET metabolism. The map is calculated by multiplying the values obtained from these compressive modalities, maximizing the representation of relevant abnormalities (Figure 2).

Processing pipeline for the calculated map. The main steps included inter-multimodal neuroimaging coregistration, bias correction, brain segmentation of the structural images, intensity normalization, deformation calculation, and generation of the calculated map. The asymmetric lower value in the left temporal temporo-occipital lobe of the postprocessed image indicated the potential EZ. The postoperative pathology of the example patient with MRI-negative PCE was gliosis.
Assessment of the performance of diagnostic tests and inter-rater agreement
Only the postprocessed maps were presented in random order to five readers from three different centers on their own devices. All readers were blinded to patient information and independently identified the most abnormal brain regions. The independent determination was classified as correct (descriptions were fully concordant with presurgical evaluations), lateralization (descriptions were only concordant with the side of the epileptogenic area but not with the brain lobes), and error (descriptions were not concordant with presurgical evaluations). To assess the performance of the postprocessed maps as diagnostic tests, we recorded the diagnostic information of localization and laterality from each reader and compared it with the actual location of the potential EZ.
Statistical analysis
Categorical variables were described using frequencies and percentages, whereas continuous variables were described using means and standard deviations (for normally distributed data) or medians and quartiles (for nonnormal distributions). Assessment of diagnostic tests in the present study was performed by using a spreadsheet for the calculation of the rate of accurate localization and lateralization from each reader. Inter-rater agreement between five readers was assessed using Cronbach’s Alpha and Interclass correlation using a two-way random effects model and consistency type. Cronbach’s alpha, a measure of internal consistency, was calculated to evaluate the agreement among the raters. It assesses how well the raters’ assessments align with each other. The values of Cronbach’s alpha <0.5 indicated a poor and unacceptable agreement, values between 0.6 and 0.9 indicated a reliable agreement, and values greater than 0.9 denote an unnecessary outcome. The extremely high value of alpha might suggest that some items could be redundant, therefore the maximum alpha value of 0.9 has been recommended.28,29 The comprehensive statistics were performed using SPSS Statistics 26.0 software (SPSS Inc. Chicago, IL, USA).
Results
Patient demographics and clinical data
A consecutive cohort of 37 patients diagnosed with MRI-negative PCE was included in this study which consisted of 12 females [32.4%], 20 with a left-sided focus [54.1%], and 27 with SEEG implantation [73.0%]. The average age at surgery was 20.2 ± 8.9 years (range = 3.0–39.0 years), epilepsy duration was 10.2 ± 6.1 years (range = 2.0–29.0 years), and the follow-up period was 48.7 ± 25.9 months (range = 5.0–89.0 months). Among the included patients, 8 (21.6%) received partial parietal resection (pP), 2 (5.4%) partial occipital resection (pO), 2 (5.4%) temporo-parietal resection (T-P), 8 (21.6%) temporo-occipital resection (T-O), and 12 (32.4%) parietal-occipital resection (P-O). In addition, 3 (8.1%) were given temporo-parietal resection with preservation of the primary sensory area for the upper and lower extremity, partial occipital resection (T-P-O), and 2 (5.4%) subtotal hemispherectomy (T-P-O resection posterior from the postcentral sulcus plus frontal resection without motor area) (sHem). In terms of postoperative pathology, 18 patients (48.6%) were reported as focal cortical dysplasia (FCD) type 1, 9 (24.3%) were FCD Type 2, and 10 (27.0%) were gliosis (Table 1).
Participant characteristics.
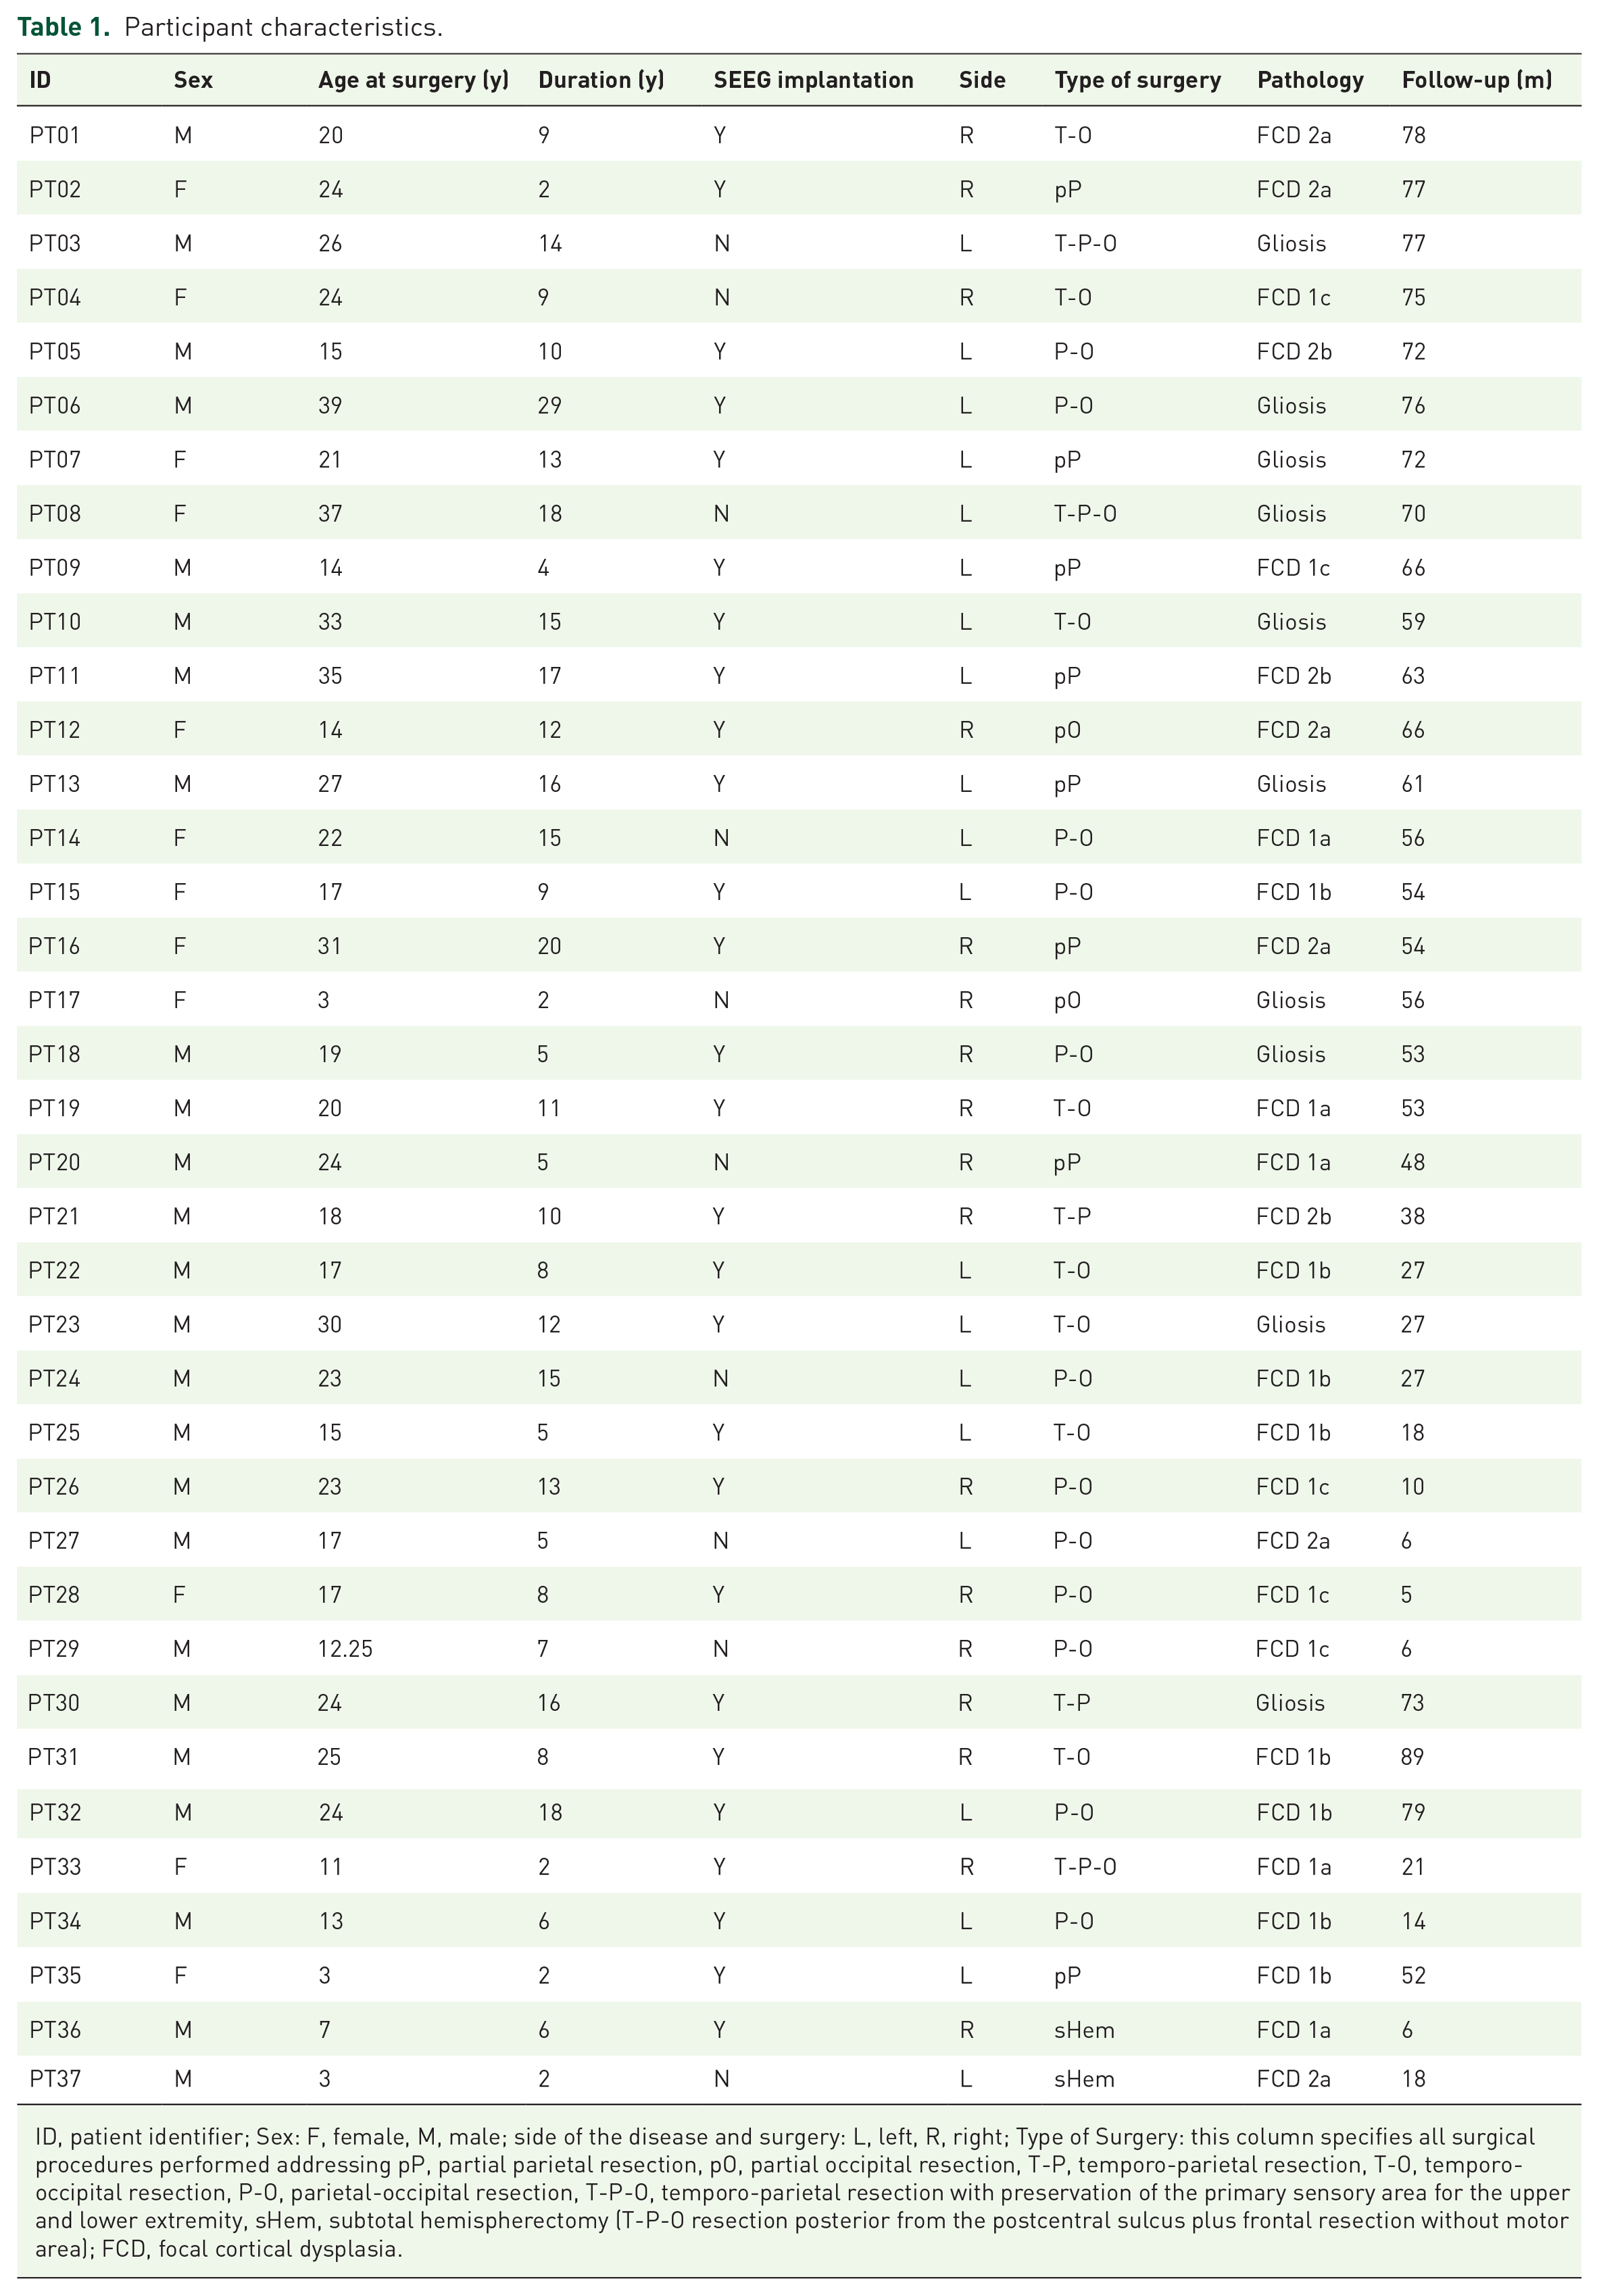
ID, patient identifier; Sex: F, female, M, male; side of the disease and surgery: L, left, R, right; Type of Surgery: this column specifies all surgical procedures performed addressing pP, partial parietal resection, pO, partial occipital resection, T-P, temporo-parietal resection, T-O, temporo-occipital resection, P-O, parietal-occipital resection, T-P-O, temporo-parietal resection with preservation of the primary sensory area for the upper and lower extremity, sHem, subtotal hemispherectomy (T-P-O resection posterior from the postcentral sulcus plus frontal resection without motor area); FCD, focal cortical dysplasia.
Inter-rater evaluations for the MRI-negative PCE
The generation of the postprocessed maps for the entire procedure occurs within 20 min per dataset. The users approximately spent 3 min moving through the volumes to determine the abnormalities from the postprocessed maps.
Figure 3 showed the diagnostic results. The average accuracy of the correct (correctly classified/total cases) was 55.7% (range = 43.2–62.2%) and lateralization (correctly lateralized/total cases) was 74.1% (range = 64.9–81.1%) for postprocessed maps. Cronbach’s alpha was 0.766 for the correct identification and 0.683 for the correct lateralization, thus indicating reliable agreement between the five readers. Furthermore, the interclass correlation coefficient was 0.760 [95% confidence interval (95% CI) = 0.613–0.863] for the correct identification and 0.635 (95% CI = 0.411) for the correct lateralization, thus indicating a similar inter-rater agreement.

Summary of blinded expert rater based on calculated map for the detection of the epileptogenic zone in the patients with posterior cortex epilepsy. (a) The bar plot displayed the accuracy of each reader. (b) Calculation of inter-rater agreement using Cronbach’s Alpha and Interclass correlation. Grey background indicated the reliable range. The error bar displayed the interclass correlation coefficient with a 95% confidence interval. (c) The matrix plot details revealed the evaluation of each patient across all the readers. In detail, PT12 and PT17 were selected for case illustration.
Cases representation
Figure 4 showed two representative examples of the clinical value of this method. Both patients showed no obvious abnormalities in the presurgical evaluation images. The postprocessed map of patient PT17 exhibited a decreased signal in the right parietal lobe and all the blinded readers could accurately detect the area and showed a high inter-rater agreement (all five readers accurately localized the EZ). However, another patient (PT12) exhibited subtle alterations in the postprocessed map. Three readers failed to detect the abnormal area and showed a low inter-rater agreement (One reader correctly localized the EZ, while another correctly determined the lateralization, but the remaining three readers made incorrect diagnoses). Both patients demonstrated confirmation of the EZ through postoperative pathology and their satisfied seizure outcomes.

Case illustration of actual multimodalities images and the postprocessed maps. The conventional presurgical evaluation comprised T1WI MPGAGE, T2WI FLAIR, 18 FDG-PET, and MRI-PET coregistration images. (a) A 3-year-old female (PT17) with right parietal epilepsy. There were no positive findings observed in presurgical evaluation images, whereas the postprocessed map indicated a significantly decreased signal in the right parietal. All the readers correctly detected the abnormal area and (b) Another 14-year-old female (PT12) with right parietal epilepsy. There were also no positive findings found in the presurgical evaluation images, and indistinct representation was observed in the postprocessed map. Finally, three of five readers failed to detect the abnormal areas.
Discussion
The advanced methodologies are conducive to improving the diagnosis of PCE and patient management. We thus applied a novel voxel-based image postprocessing method on patients with PCE to detect the epileptogenic areas on neuroimaging that were unrecognized by the previously standard visual radiological interpretation. By using the postprocessed map based on the structural deformation, intensity signal, and metabolic value, we were able to increase the accuracy rate to 55.7% and correct lateralization of 74.1% from negative cases over conventional visual analysis, as well as maintain a high degree of consistency. Taken together with the time efficiency and optimal performance, this approach could serve as a clinically viable and useful tool for the presurgical diagnostic routine for PCE.
Patients with MRI-negative PCE still constitute the most challenging group undergoing presurgical evaluation because of the unclear electroclinical relationship. For instance, a previous study has reported that parietal lobe epilepsy could function as an imitator among the different focal epilepsies because of its extensive association with other brain regions, which are mainly responsible for inaccurate localization in clinical practice. 9 Considering the low frequency of this form of epilepsy, difficulty in localization of EZ, and concerns about cortical dysfunction, surgical treatment for PCE is relatively less common and associated with poorer prognosis. 30 In another study, Yu et al. reported a seizure-freedom rate of 60.5% (26/43) and an incidence rate of long-term visual field deficits of 18.6% (8/43) in their cohort and also found no available diagnostic modalities to predict the favorable surgical outcome. 8 In addition, another scholar also reported a similar prognosis (60%, n = 50), and considered that the left-sided and parietal EZs were the independent predictors of seizure recurrence. 31 A previous study consisting of 208 patients with PCE from Cladio Munari Centre confirmed that MRI-positive representation could potentially avoid the invasive SEEG implantation and was associated with a better seizure outcome. 32
A large-scale study retrospectively reviewed the histopathological specimens from MRI-negative epilepsy and found that FCD (43/95, 45%) is the most common pathology, followed by gliosis (21/95, 22%) and the majority of FCD diagnosed was International League Against Epilepsy (ILAE) Type 1 (n = 37). 33 It has been reported that FCD Type 1 is usually localized in the posterior half of the cerebral cortex. 17 The proportion of FCD pathology in our study was observed to be similar to this cohort. Unlike FCD Type 2 which is relatively well-known for its neuroimaging features, such as the cortical thickening, blurring of GM/WM junction, and increased T2WI/FLAIR signal,12,34 Type 1 FCD is characterized by the lack of prominent neuroimaging alterations and requires further investigations. 35 Concerning imaging, the majority of FCD 1 patients without discrete MRI-identifiable lesions as a pathologically abnormal arrangement of cortical neurons rather than cellular density. 36 The histopathological description of lesions FCD Type 1 consists of dyslaminated and disrupted organization of the tissue architecture, but with morphologically normal neurons and glial cells. 37 These mild alterations in the histopathology are conducive to explaining the subtle neuroimaging representation of FCD Type 1 in MRI-negative epilepsy as the rearrangement of the tissue architecture with normal neurons, with rather sufficient alterations in overall cellularity or density of the GM to substantially affect the imaging signal. 37 In 2021, Holthausen et al. introduced a specific epilepsy phenotype: Multilobar Unilateral Hypoplasia with Severe Epilepsy in Children (MUHSEC) with drug resistance from seizure onset, which included multifocal EEG with posterior emphasis, lack of any focal neurological deficits but severe cognitive impairment, subtle hypoplasia of the epileptogenic area on MRI. 38 This was histopathologically defined and molecularly confirmed by deoxyribonucleic acid methylation analysis as FCD ILAE Type 1A. This study showed an interesting finding that the posterior quadrant was always affected, with the involvement of temporo-parieto-occipital junctions in MUHSEC. 38
In recent years, enormous progress in bioinformatics and computational technology has increased hopes for the better management of epilepsy patients. Several advanced image processing strategies have been investigated to improve the detection of the subtle cortical abnormalities in the EZ that might escape the conventional visual analysis. These technologies consist of texture analysis,24,39 voxel-based intensity analysis, 40 surface-based analysis,20,41,42 MAP, 43 etc. The advantages associated with voxel-based analysis include more time saving and easier, better performance, which could be beneficial for the multicenter application and validation in the future. Voxel-based morphometry (VBM) is one of the most popular methods, which can effectively extract both GM and WM maps from individuals to facilitate statistical comparisons with a healthy cohort. Several previous VBM studies related to T1WI MRI have shown that the computational findings were concordant with the lesion in 63–86% of MRI-visible cases. 44 Moreover, other researchers have endeavored to construct computer-based models to extract morphological characteristics of FCD on different images, such as cortical cortex, blurring in GM/WM boundary. For instance, a study investigated the value of MAP in 150 patients with no lesions and found a 43% positive rate. 22 In this study, we also included patients with MRI-negative PCE, in which lack of distinct electroclinical correlations rendered the clinical diagnosis more difficult than the seizures arising from other brain regions. The methodology employed in this study produced satisfactory results with an average accuracy of 55.7% for correct localization and 74.1% for correct lateralization. The results of this study could hopefully render clinical procedures more efficient and beneficial for surgical decisions. Diverging from previous investigations that predominantly concentrated on abnormal structural alteration, the current study undertook a comprehensive computation encompassing structural deformation, FLAIR signal intensity, and PET metabolism. These attributes were amalgamated to formulate a postprocessed map aimed at the identification of the epileptogenic region in patients afflicted by PCE. The selection of these calculation parameters was guided by clinical observations encompassing WM reduction, cortical dyslamination, gliosis, and functional deficit, collectively striving to encapsulate the distinctive attributes emblematic of PCE. It is expected that through quantifying and combing these important features, we would be able to make the subtle abnormalities in epileptogenic areas more prominent.
Limitations
First, despite the inclusion of a relatively large cohort of 37 patients with MRI-negative PCE, it is important to acknowledge that our study’s sample size remains modest. Conducting future studies with larger sample sizes will be crucial to further validate and generalize the findings observed in our study. Second, while the accuracy rate of 55.7% and lateralization rate of 74% may not appear impressive in isolation, it is important to consider the context. Our method significantly improves the detection of MRI-negative PCE, transitioning previously undetected cases from a negative to a partially positive status. Third, we acknowledged the subtle MRI presentation nature of PCE. However, our study was not contradicted to quantify structural abnormalities to identify the EZ as our intention was to combine abnormalities across multiple imaging modalities to enhance the detection of suspected lesions.
Conclusion
The image postprocessing method developed in this study can aid to improve the visual detection of MRI-negative PCE, a challenging disease phenotype in epilepsy. The technique can potentially increase the number of patients with PCE who could significantly benefit from the surgery.