
Abstract
Background:
Cladribine is a highly effective immunotherapy that is applied in two short-term courses over 2 years and reduces relapse rate and disease progression in patients with relapsing multiple sclerosis (MS). Despite the short treatment period, cladribine has a long-lasting effect on disease activity even after recovery of lymphocyte counts, suggesting a yet undefined long-term immune modulating effect.
Objectives:
Our aim was to provide a more profound understanding of the detailed effects of cladribine, also with regard to the patients’ therapy response.
Design:
We performed an open-labeled, explorative, prospective, single-arm study, in which we examined the detailed lymphocyte subset development of MS patients who received cladribine treatment over 2 years.
Methods:
We performed in-depth profiling of the effects of cladribine on peripheral blood lymphocytes by flow cytometry, bulk RNA sequencing of sorted CD4+ T cells, CD8+ T cells, and CD19+ B cells as well as single-cell RNA sequencing of peripheral blood mononuclear cells in a total of 23 MS patients before and at different time points up to 24 months after cladribine treatment. Data were correlated with clinical and cranial magnetic resonance imaging (MRI) disease activity.
Results:
Flow cytometry revealed a predominant and sustained reduction of memory B cells compared to other B cell subsets after cladribine treatment, whereas T cell subsets were slightly reduced in a more uniform pattern. The overall transcriptional profile of total blood B cells exhibited reduced expression of proinflammatory and T cell activating genes, while single-cell transcriptomics revealed that gene expression within each B cell cluster did not change over time. Stable patients displayed stronger reductions of selected memory B cell clusters as compared to patients with clinical or cerebral MRI disease activity.
Conclusion:
We describe a pronounced and sustained effect of cladribine on the memory B cell compartment, and the resulting change in B cell subset composition causes a significant alteration of B cell transcriptional profiles resulting in reduced proinflammatory and T cell activating capacities. The extent of reduction in selected memory B cell clusters by cladribine may predict treatment response.
Introduction
Multiple sclerosis (MS) is a chronic inflammatory disease of the central nervous system (CNS) characterized by immune cell-mediated destruction of the myelin sheath and subsequent axonal loss. 1 Although many aspects of disease pathogenesis are still not fully elucidated a key role of T cells in CNS autoimmunity has been established.2,3 This is true for the MS animal model of experimental autoimmune encephalomyelitis as well as for in-depth characterization of CD4+ and CD8+ T cells within MS lesions, in the cerebrospinal fluid or peripheral blood of MS patients.2,3 These T cell alterations in MS patients are at least partly corrected by distinct immune-modulatory treatments of MS. 4 In contrast, the precise relevance of B cells in MS pathophysiology still remains unknown, albeit several studies described alterations of B cell phenotypes and function in MS. 4 One mechanistic conundrum is that anti-CD20+ B cell depleting therapies are highly efficacious but do not affect antibody-producing plasma cells and plasma blasts. This has fueled the hypothesis that B cell depletion indirectly modulates autoreactive T cell responses by interfering with antigen-presenting functions of B cells as well as by correction of disturbed B cell cytokine networks. 4
Cladribine is a disease-modulating therapy approved for treatment of active relapsing MS (RMS). Mechanistically, cladribine serves as an adenosine deaminase-resistant deoxyadenosine analogue that is incorporated into the DNA of dividing cells, causing DNA damage and subsequent cell death. 5 Due to its unique enzymatic configuration, the prodrug cladribine becomes activated preferentially in B and T lymphocytes by phosphorylation, and thereby preferentially affects these subsets. 6 In clinical practice, cladribine is applied in two short-term courses of oral treatment cycles of 5 days per annual course over 2 years with no subsequent treatment cycle in years 3 and 4. 6 In the placebo-controlled CLARITY study, cladribine was shown to effectively reduce relapse rate and disease progression. 6 Data from the subsequent extension trial of the CLARITY study illustrated that cladribine induced a long-lasting effect on disease activity. This long-term effect was maintained despite recovery of lymphocyte counts, suggesting a restoration of immune regulatory network function; potentially due to distinct depletion and repopulation kinetics. 7 Recent publications revealed a profound effect of cladribine on B cells, in particular memory B cells. However, an in-depth profiling of the effects of cladribine on lymphocyte subset changes over time and their transcriptional profiles is lacking.8,9
Employing an open-label, explorative, in-depth immune-profiling study in patients receiving cladribine according to the EU label, we aimed to evaluate the long-term effects of cladribine treatment on lymphocyte subset composition by multi-dimensional profiling of the T and B cell compartment.
Methods
Study design and participants
We performed an open-labeled, explorative, prospective, single-arm study, in which we examined the detailed lymphocyte subset development of MS patients who received cladribine tablets 3.5 mg/kg cumulative dose with 2 weeks of active treatment per annual course over 2 years.
Adult patients (18–60 years old) were included with diagnosed relapsing-remitting MS (RRMS) according to the McDonald criteria 2017 and an expanded disability status scale (EDSS) score ⩽ 6.5. Patients were excluded in case of contraindication for cladribine or conditions that compromise the understanding of patient information, to give informed consent, or to complete the study.
Whole blood samples were collected from 23 patients at baseline (n = 23), 6 months (n = 16), 12 months (n = 23), and 24 months (n = 13) after cladribine treatment onset. Demographic data are displayed in Table 1. At every visit, relapse rate and EDSS were documented, cerebral magnetic resonance imaging (cMRI) data were assessed at least once per year. Detailed data about clinical activity are displayed in Supplemental Table 1. Peripheral blood mononuclear cells (PBMC) were isolated by Lymphoprep™ (Stemcell Technologies, Canada) density gradient centrifugation and stored in liquid nitrogen until usage [Supplemental Figure 1]. An overview, which patient participated in which experiment is provided in Supplemental Figure 1 and Table 2.
Demographics and disease characteristics for cladribine-treated patients with RRMS.

Mean age relates to time point of taking of blood sample. Platform includes the following disease modifying therapies (DMT): teriflunomide, glatiramer acetate, dimethyl fumarate and interferon beta formulation. Highly active includes fingolimod, natalizumab and alemtuzumab.
Time after cladribine treatment onset.
DMT, disease modifying therapies; EDSS, expanded disability status scale; max, maximum; min, minimum; MS, multiple sclerosis; n, number; RRMS, relapsing-remitting MS; SD, standard deviation.
From our cohort, 19 patients (82.6%) previously received other disease modifying therapies (DMT). These included the platform therapies teriflunomide (n = 3), glatiramer acetate (n = 1), dimethyl fumarate (n = 3), and interferon beta formulation (n = 1), as well as highly active immunotherapies such as fingolimod (n = 5), natalizumab (n = 5), and alemtuzumab (n = 1, Supplemental Table 3).
Multiparameter flow cytometry
We performed an in-depth immunophenotyping using multiparameter flow cytometry. For the first analysis set, we used PBMC from 22 patients at baseline and after 6 (n = 14) and 12 (n = 21) months after cladribine initiation. For the second set, we used PBMC from 11 patients at baseline and after 12 and 24 months (each n = 11) of cladribine therapy onset. The corresponding demographic data and details about clinical parameters of these cohorts are displayed in Supplemental Tables 4 and 5.
Freshly thawed PBMC were stained with fluorochrome-conjugated antibodies and measured using specialized flow cytometry panels as previously described.10,11 Detailed protocols for experiment procedure are provided in the Supplemental Data, including the full list of used antibodies [Supplemental Table 6], fluorochromes, working concentrations and company names as well as all investigated immune cell populations with corresponding gating strategies per population and experiment. We have already shown in previous studies that the freezing time does not impact the stability of flow cytometry assessments within the time frame of this study.12,13 Immune cells were acquired by CytoFlex (Beckman Coulter) and analyzed using Kaluza Analysis 2.1 (Beckman Coulter, California, USA) and OMIQ (Omiq, Inc., Boston, USA) software.
Bulk RNA sequencing
For bulk RNA sequencing, PBMC samples from 12 patients with RRMS at baseline, after 6 and 12 months of cladribine treatment were thawed and CD4+ and CD8+ T cells as well as CD19+ B cells isolated by FACSAria III Cell Sorter (BD Biosciences, USA). The corresponding demographic data and details about clinical parameters of these cohorts are displayed in Supplemental Table 7. RNA was isolated (see Supplemental Data) and quality of total RNA was determined. Bulk RNA sequencing was performed as described in Supplemental Data. 14 Two patients had to be excluded, one because of a missing 12 months timepoint and the other because of not sufficient sample quality. Genes with a false discovery rate (FDR)-corrected p-value < 0.05 were considered as significantly differentially expressed and a gene set enrichment analysis was done. Subsequently, gene ontology (GO) term enrichments and pathway analyses for all differentially expressed gene lists were conducted. Detailed protocols are provided in Supplemental Data.
Single-cell RNA sequencing and data processing
For single-cell RNA (scRNA) sequencing, 500.000 cells from PBMC samples from 11 patients at baseline, after 12 and 24 months after cladribine therapy onset were used. The corresponding demographic data and details about clinical parameters of these cohorts are displayed in Supplemental Table 5. Single-cell sequencing was carried out according to manufacturer’s instructions using the Evercode Whole Transcriptome v1 kit (Parse Biosciences, Seattle, USA). Sequencing was performed on a local Illumina NextSeq 2000 with a 74-6-0-86 read setup, and fastq files were then generated using the bcl2fastq pipeline. Subsequent read alignments were mapped to the human (hg38) genome and transcript counting was done using the Parse Biosciences split-pipe pipeline (v0.9.6p). The scRNA data were then analyzed with R v4.0.5 and the Seurat package version 4.0.5). 15 Additionally, all identified B cell and plasma-cell clusters were clustered separately to explore these populations in more detail. Dot plots were created with native Seurat functions, whereas heatmaps and stacked boxplots were visualized with R’s pheatmap 16 and ggplot2 packages, 17 respectively. Detailed protocols are provided in Supplemental Data.
Statistical analysis
Statistical significance of flow cytometry results was, if not elsewhere marked, evaluated using GraphPad Prism version 8.0.0 for windows, GraphPad Software (San Diego, California, USA). For multiple comparisons with Gaussian distribution, one-way ANOVA was used, for nonparametric multiple comparisons, the mixed-effects model was used. To correct for multiple comparisons, Tukey’s multiple comparisons test was used. Outliers were detected using ROUT (Q = 1%) method. All results illustrated in box-and-whisker plots are shown as the median, the 25th and 75th percentile ± inter quartile range (IQR, box) and minimum and maximum (whiskers).
Scripts generated in R version 4.0.2 (“Taking Off Again”) 21 and RStudio version 1.3.959 were used for network representations and heatmap representations of dimensionality reduction maps. Statistical analysis therefore was conducted by Wilcoxon signed rank test followed by correction for multiple testing using FDR.
Statistical analysis of bulk RNA sequencing data was conducted by likelihood ratio test in DESeq2 followed by a correction for multiple testing using FDR.
For continuous variables, the independent-sample t test or Mann–Whitney U test and analysis of variance with post hoc Bonferroni testing were conducted as appropriate.
Statistical significance was defined as *p ⩽ 0.05, **p ⩽ 0.01, ***p ⩽ 0.001, and ****p ⩽ 0.0001.
The statistical test used in the corresponding experiment is indicated in the figure legend.
If possible, investigators were blinded throughout data acquisition and analysis. Clinical scoring was independent of experiments.
Results
Flow cytometric analysis of changes of T and B cell subsets up to 12 months after cladribine treatment initiation
In a first step, we evaluated the effects of cladribine treatment on lymphocyte subset composition in the peripheral blood during the first year of cladribine treatment in RMS patients using multi-dimensional flow cytometry. We recruited patients (baseline n = 22, 6 months n = 14, 12 months n = 21), which were prospectively followed and (para-)clinically evaluated before, 6 and 12 months after cladribine treatment initiation (Supplemental Figure 1). In line with the drug’s known mechanism of action, absolute lymphocyte counts transiently decreased after cladribine treatment, and this was due to a reduction in absolute B and T cell counts [Figure 1(a); Supplemental Figure 2(A)]. Overall, our flow cytometric analysis revealed numerous alterations affecting both the T and B cell compartment [Figure 1(a) –(c); Supplemental Figures 2 and 3]. All T cell subsets were rather uniformly affected with a significant reduction in naïve and memory CD4+ and CD8+ T cell counts at month 6 with partial recovery at month 12 [Figure 1(a) and (b); Supplemental Figures 2(C) and (D) and 3(C)–(G)]. In contrast, in the B cell compartment, memory (CD19+, CD20+, CD27+) B cell numbers were profoundly reduced at both 6 and 12 months, whereas naïve (CD19+, CD20+, CD27−) and unusual (CD19+, CD20+, IgM+, IgD+, CD38−, CD21−) B cells were only transiently decreased and transitional (CD19+, CD20+, IgM+, IgD+, CD38+, CD21+, CD24+) and regulatory (CD19+, CD20+, CD27+, CD38+, CD24+) B cell counts even increased 12 months after cladribine treatment [Figure 1(a) and (c); Supplemental Figure 2(E) and (F)]. The differential effect of cladribine treatment on the B cell compartment was also reflected by unsupervised cluster analysis of the data set, which revealed a profound and significant reduction in several distinct memory B cell clusters and a concomitant increase in naïve B cell clusters [Figure 1(d); Supplemental Figure 4]. Taken together, our analysis reveals that cladribine exerts differential effects on B cell subsets as opposed to rather uniform effects on T cell subsets over time.

Immune cell subset composition in the peripheral blood of patients with RRMS under cladribine therapy at BL, after 6 (6M) and 12 months (12M) assessed by flow cytometry. (a) Network representation showing up- and downregulation of immune cell subsets comparing the time points 12M to BL (n = 21 patients). Statistical analysis was conducted by Wilcoxon signed rank test followed by correction for multiple testing using FDR. Significant changes are shown as dotted lines (*p ⩽ 0.05), dashed lines (**p ⩽ 0.01), long-dashed lines (***p ⩽ 0.001), and solid lines (****p ⩽ 0.0001) at the node borders. The color of the nodes signifies the LFC in up- (red) or downregulation (blue) of median-cell subset percentage abundances (left) or of absolute cell subset counts (right) after cladribine treatment as compared to baseline. (b and c) Corresponding box plots illustrating absolute counts of naïve and memory CD4+, CD8+, and regulatory CD4+ T cells (b), as well as naïve, memory, transitional, unusual, and regulatory B cells (c) before (BL, n = 22), after 6M (n = 14) and 12M (n = 21) of cladribine therapy initiation. (d) t-SNE representations obtained from concatenated samples per time point as in (c) consisting of CD19+ CD20+ B cells. Unsupervised clustering by PhenoGraph identified cell clusters is indicated by colors/numbers, encirclements depict B cell subsets as defined by differential marker expression based on single marker plots (Supplemental Figure 4). Statistical significance of changes after 6M and 12M compared to BL were assessed by Dunn’s test with FDR-correction for multiple comparisons as depicted by asterisks on clusters.
Evaluation of T and B cell transcriptomic alterations 6 and 12 months after cladribine treatment initiation
We next compared the transcriptomic profiles of flow cytometry-sorted CD19+ B cells, CD4+ and CD8+ T cells from the peripheral blood of our patients 6 and 12 months after cladribine treatment onset compared to their baseline profiles [Supplemental Figure 5(A) and Supplemental Table 8]. At month 12, the transcriptomic profile of CD19+ B cells was profoundly altered with 13.4% of all genes differentially regulated as a consequence of cladribine treatment, whereas CD4+ and CD8+ T cell transcriptomic profiles showed 1.1% and 2.4% differentially regulated genes, respectively [Figure 2(a)]. In B cells, many immune-relevant genes were downmodulated, including CD27+ and CD70+, components of the inflammasome, cytokine receptors as well as molecules involved in T cell activation, whereas relatively few genes were found to be upregulated [Figure 2(a)]. Quantification of the molecular degree of molecular perturbation further illustrated that cladribine treatment causes significant changes in the gene expression patterns at both timepoints and for all three subsets investigated, with the most profound effects within the B cell compartment [Figure 2(b)].
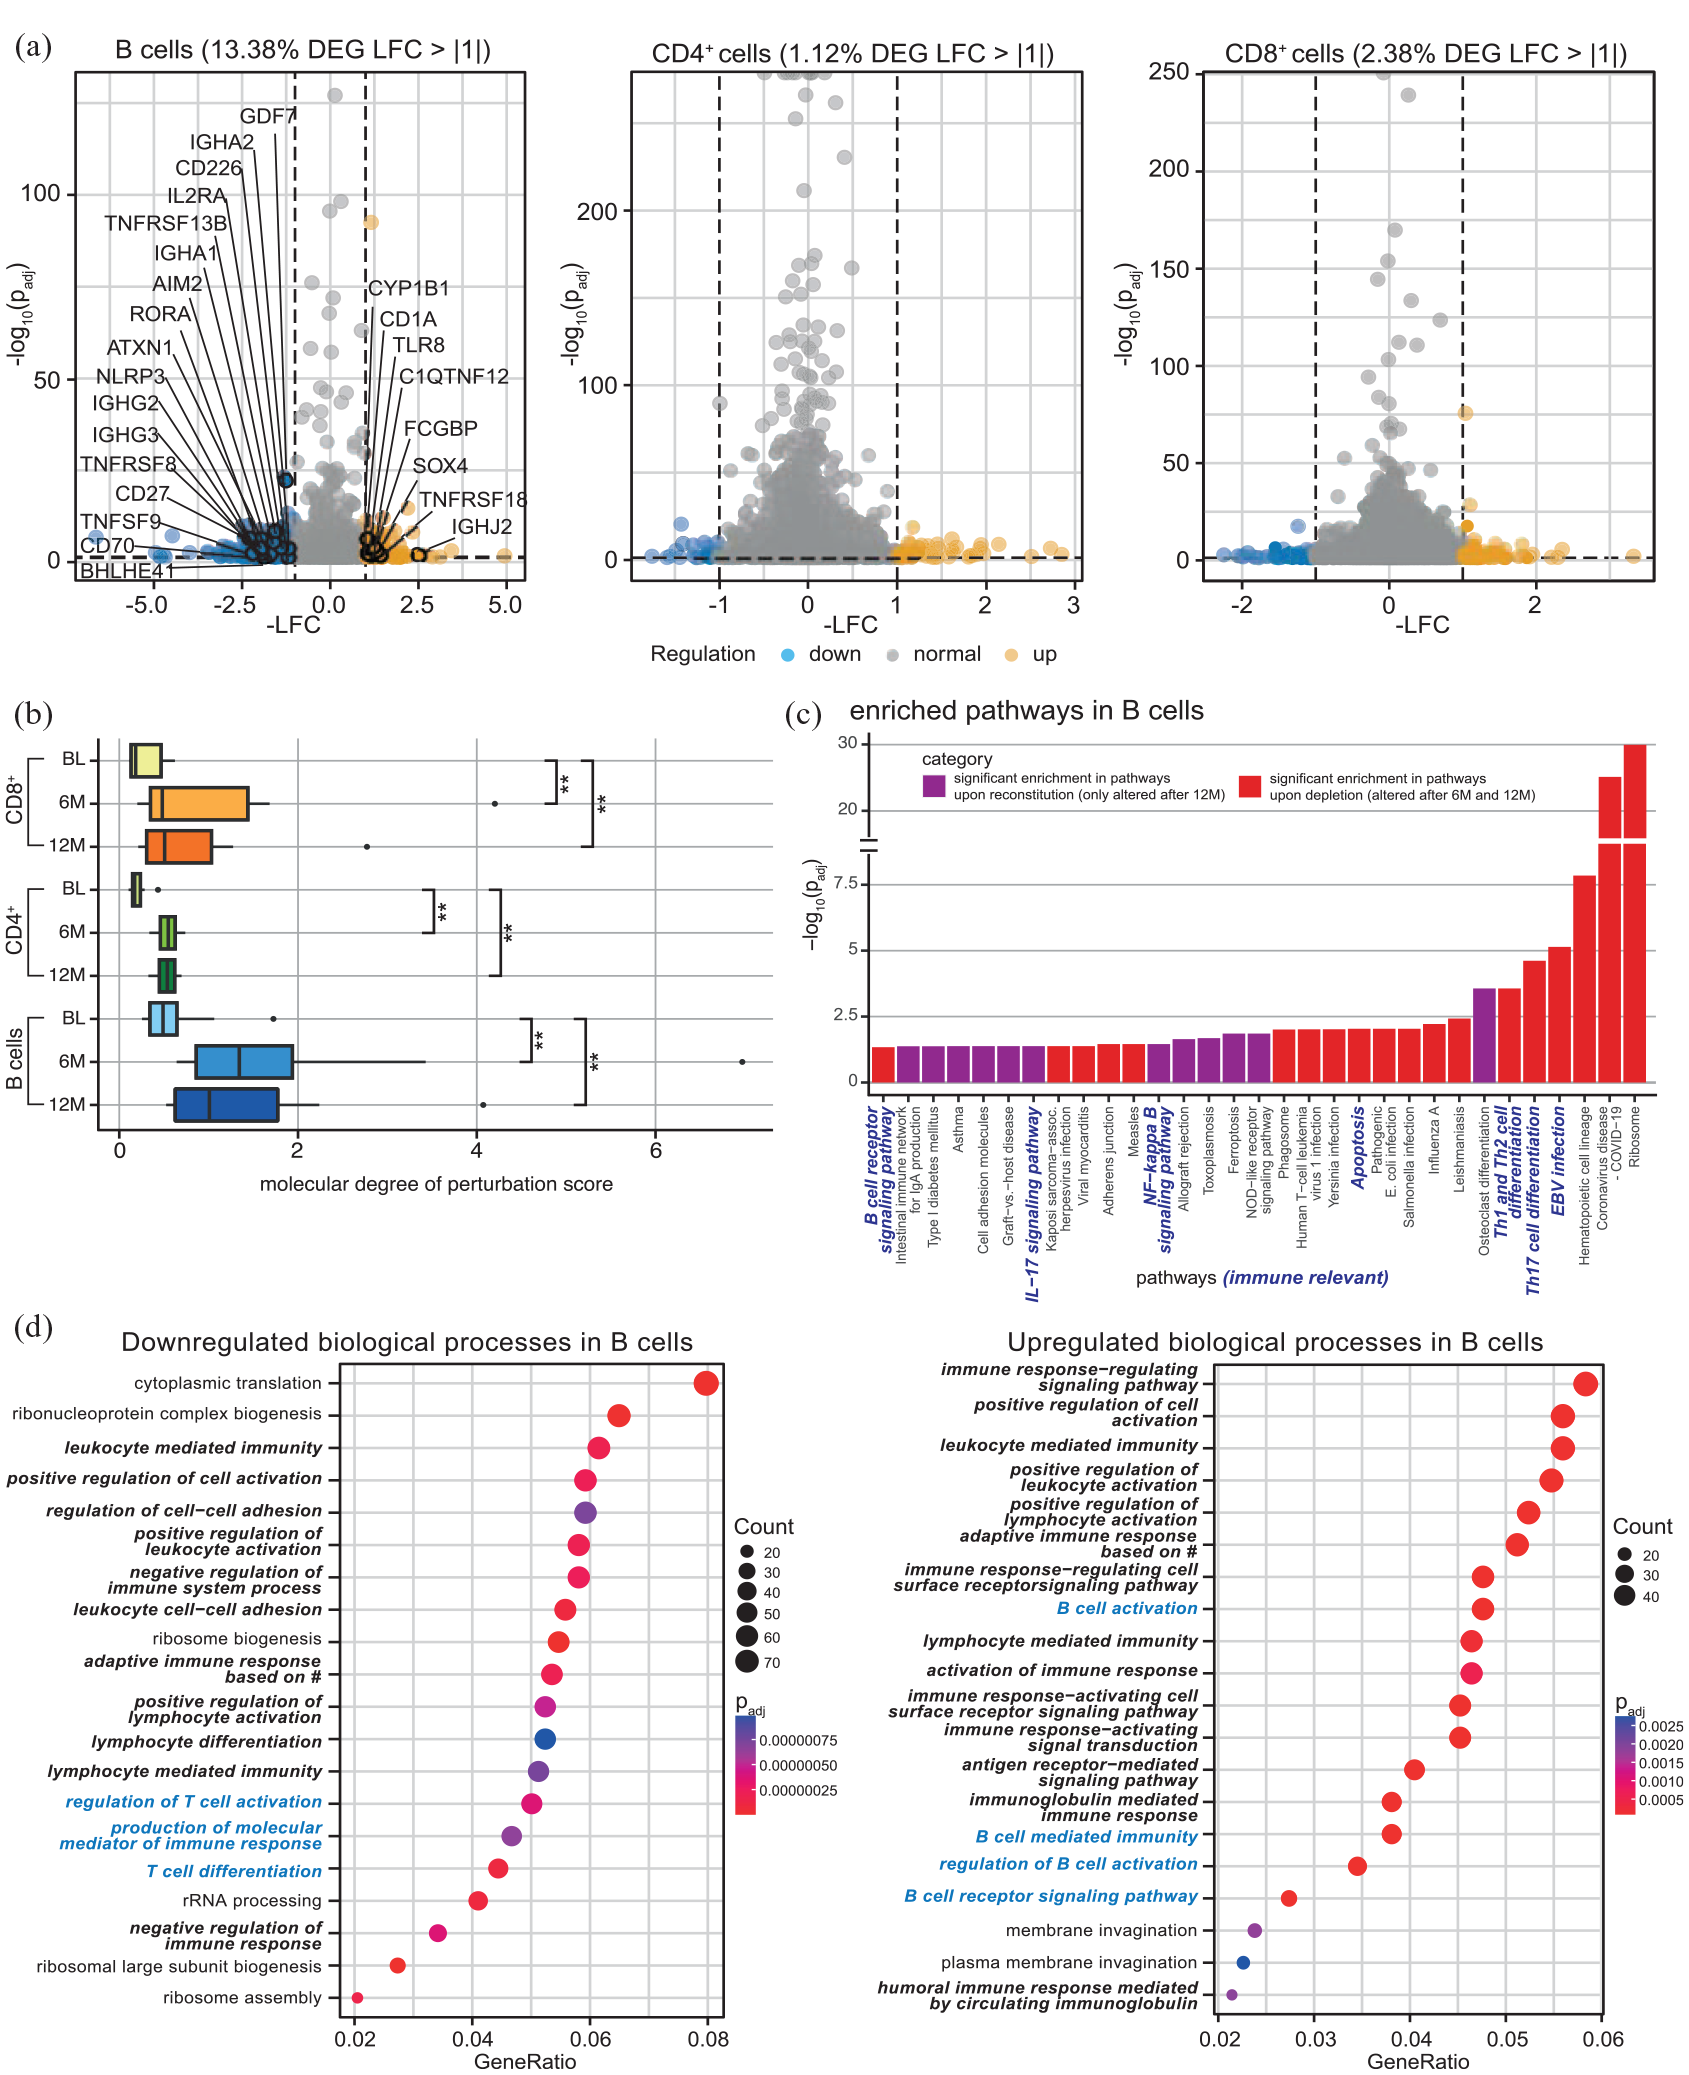
Bulk transcriptomic analysis of flow cytometry-sorted B cells, CD4+ and CD8+ T cells from frozen PBMC of 12 RRMS patients at BL, after 6 and 12 months after cladribine therapy initiation (6M, 12M). (a) Volcano plots displaying significantly down- (LFC < −1, blue) and upregulated (LFC > 1, yellow) DEG (adjusted p-value ⩽0.05) comparing 12 months after cladribine therapy initiation to BL of B cells (highlighted are immune-relevant genes), CD4+ and CD8+ T cells. (b) Molecular degree of perturbation scores for B cells, CD4+ and CD8+ cells were calculated for all three time points, with the respective BL group as reference based on the cohort filtered for matched data (n = 10). (c) Pathway enrichment analysis in B cells. DEG for the time points 6M and 12M (each in comparison to BL) were used as input; the resulting pathways were classified as ‘significant enrichment upon reconstitution’ (i.e. only altered after 12M, padj < 0.05) or ‘significant enrichment upon depletion’ (i.e. altered after 6M and 12M, padj < 0.05) depending on their enrichment patterns. (d) Enrichment analysis of GO, BP based on differential expression analysis of bulk RNA sequencing data. Enrichment analysis based on significantly downregulated (c) and upregulated (d) DEG of B cells comparing 12M to BL. Shown are the top 20 GO enrichment terms for BP, including respective gene counts. GeneRatio stands for relevant genes for the tested term divided by total input genes. Immune-relevant pathways are marked in bold italic, B cell-relevant pathways in blue bold italic. Adjusted p-values were calculated through a hypergeometric distribution. Dot sizes correspond to the number of genes from the input lists that are enriched for each GO term. # = somatic recombination of immune receptors built from immunoglobulin superfamily domains.
Moreover, molecular pathway analysis in B cells and CD4+ T cells revealed a significant enrichment of gene alterations at distinct time points during the depletion and repletion cycle, illustrated by alterations that were either already present upon depletion (i.e. at time points 6 and 12 months, depicted in red) or only occurred upon reconstitution (i.e. at time point 12 only, depicted in purple) [Figure 2(c); Supplemental Figure 5(B)]. In B cells, several immune-relevant pathways were shown to be enriched, including B cell receptor signaling, Interleukin-17 signaling, NF-κB (nuclear factor ‘kappa-light-chain-enhancer’ of activated B cells) signaling, as well as Th1, Th2, and Th17 cell differentiation. In accordance with these findings, a GO database analysis of B cell transcriptomic profiles illustrated that cladribine treatment resulted in a significant regulation of biological processes (BP) again related to immune functions, including cell activation and differentiation, cytokine production, and cell–cell adhesion [Figure 2(d)]. This also included a downregulation of the BP ‘regulation of T cell activation’ and ‘T cell differentiation’ in B cells 12 months after cladribine treatment onset [Figure 2(d)], together pointing towards potential cladribine-related B cell-mediated effects on T cell functions.
Single-cell transcriptomic analysis of the B cell compartment for up to 24 months after cladribine treatment initiation
We next complemented our bulk transcriptomic analysis by scRNA sequencing of PBMC from 11 MS patients before, at 12 and 24 months after cladribine treatment initiation (Figure 3; Supplemental Figures 6 and 7). UMAP overview identified distinct B cell subsets within the PBMC population [Figure 3(a) left]. Focusing on the B cell compartment revealed the presence of six distinct B cell clusters, of naïve B cells, one cluster of transitional B cells, two clusters of Immunoglobulines A/G memory B cells as well as activated memory B cells, and a cluster of plasma-cell marker expressing cells [Figure 3(a) right; Supplemental Figure 8]. As expected, comparison of the transcriptomic profiles of these distinct clusters at baseline revealed profound differences between the naïve and transitional B cell clusters on the one hand and the two memory B cell clusters on the other hand [Supplemental Figure 9(A)], reflecting the different functional profiles of these cell populations. This is also illustrated by an upregulation of the BP T and B cell activation, B cell differentiation and positive regulation of T cell-mediated cytotoxicity in the memory B cell clusters [Supplemental Figure 9(B)].

Single-cell transcriptomic analysis from frozen PBMC of RRMS patients (n = 11) at BL, after 12 (12M), and 24 months (24M) of cladribine therapy initiation. (a) UMAP plot representing all cell cluster (left) identified (all time points: BL, 12M, 24M). UMAP plot (right) represents a subset analysis of B cell and plasma cell clusters (highlighted and based on left UMAP). Cluster names were assigned based on marker gene expressions [feature definition is depicted in Supplemental Figure 8(A) and (B)]. (b) Grouped box plots show relative abundance of distinct B cell and plasma cell clusters for BL, 12M, and 24M after cladribine therapy initiation. Cluster defined as in Supplemental Figure 8(B). (c) Total gene counts with chosen expression patterns per cluster. Depicted are the number of genes with a minimum average expression level found in each cluster (mean count > 1; shown in bright/on the left side), as well as the number of differentially expressed genes between the conditions BL and 12M (shaded/center) and between BL and 24M (dark/right) within each cluster (adjusted p-value < 0.05).
Evaluation of the dynamic changes of these defined B cell clusters as a consequence of cladribine treatment revealed a strong and persistent reduction of the activated memory B cell cluster both at 12 and 24 months after cladribine treatment onset (one-sided Mann–Whitney U test of each patient relative frequencies of memory B cells at time points 12 or 24 months in comparison to baseline: p-value = 0.000977 for 12 months, p-value = 0.00342 for 24 months) [Figure 3(b); Supplemental Figure 10(A)]. Again, the persistent and significant reduction in memory B cells up to 24 months could also be confirmed by flow cytometry from these patients (Supplemental Figures 6 and 7). However, it is important to note that the transcriptional profiles within each cluster over time remained remarkably stable after cladribine treatment, indicating that the overall change in transcriptional changes within the CD19+ B cell compartment are driven by the changes in B cell subset composition and not by direct changes of transcriptional profiles within each cluster [Figure 3(c); Supplemental Figure 10(B) and Supplemental Table 9].
Reduction in selected memory B cell clusters correlates with treatment response to cladribine
We next aimed to address whether the extent of memory B cell changes by cladribine might differ in patients with a stable disease course after cladribine treatment initiation compared to those exhibiting disease activity after treatment onset. Clinical and cMRI disease activity of all patients after cladribine treatment initiation were prospectively monitored over 24 months in a standardized fashion (Supplemental Figure 1). In total, 14 out of 23 patients exhibited no evidence of either clinical (i.e. relapse or EDSS progression) or cMRI disease activity (i.e. new/enlarging T2 lesions or Gd+ enhancing lesions; NEDA). The majority of the events occurred within the first year of treatment. A relationship between disease activity and the previous treatment before cladribine initiation could not be observed [Figure 4(a)].

Dynamics of B cell clusters as determined by flow cytometry of 23 cladribine treated RRMS patients at BL, 6 (6M) and 12 months (12M) in relation to treatment response. (a) Schematic visualization of relapses and MRI activity of all 23 patients investigated. Previous disease modifying therapies categorized as platform therapy (teriflunomide, glatiramer acetate, dimethyl fumarate, interferon beta formulation, yellow) and highly active therapy (fingolimod, natalizumab, alemtuzumab, orange). Additional information is summarized in Supplemental Table 3. Grey = therapy naïve patients. Single-cell sequencing analysis available of patients with green marked numbers [Figure 3]. (b–e) t-SNE-based heatmaps with PhenoGraph clustering and encirclements as in Figure 1(d) of stable [(b) nBL + 12M = 13] and active [(c) nBL = 9, n12M = 8] patient cohorts, comparing the time points 12M to BL and of time points 6M [(d) nact = 5, nsta = 9] and 12M [(e) nact = 5, nsta = 16], comparing active to stable patient cohorts. The color of the cluster signifies the LFC of cluster abundance in up- (red) or downregulation (blue) 12M as compared to BL (b and c) or active compared to stable (d and e). Statistical significance (b–e) of changes was assessed by Dunn’s test with false discovery rate-correction for multiple comparisons as depicted by asterisks next to cluster numbers and in the corresponding box plots.
We analyzed the changes within the B cell compartment during the first year after cladribine treatment initiation by multi-parameter flow cytometry in either stable patients (n = 13) or active patients (n = 9). We did not observe any significant differences in memory B cell counts between stable and active patients [Supplemental Figure 11(A) and (B)]. However, unsupervised cluster analysis of our flow cytometry data at month 6 and 12 as compared to baseline indicated that selected clusters within the memory B cell compartment of stable patients were more affected than those from active patients [Figure 4(b) and (c); Supplemental Figure 11(E) and (F)]. This was supported by direct comparison of B cell clusters from active versus stable patients at month 6, which showed that the memory B cell clusters 7 and 12 exhibited a significantly higher reduction in stable patients as in active ones [Figure 4(d)]. A similar trend was observed at month 12, albeit this was not statistically significant [Figure 4(e)].
Together, our data show that the extent of changes at least in selected memory B cell clusters as a consequence of cladribine treatment correlates with the treatment response.
Discussion
In line with recent studies, we observed a dominant effect of cladribine on B cells with distinct effects on the respective B cell subset composition as compared to T cells with milder and rather uniform effects on the different T cell subsets. Predominant effects on memory B cells have been described in other studies as measured by flow cytometry.9,18,19 A reduction in lymphocyte counts is an expected effect of cladribine treatment due to the selectivity of the drug for lymphocytes, which is caused by relatively high levels of the phosphorylating enzyme deoxycytidine kinase (DCK) as opposed to the dephosphorylating enzyme 5′-nucleotidase (NT5E), resulting in phosphorylation and subsequent activation of cladribine and consecutive induction of cellular apoptosis. It can therefore be speculated that the distinct effects of cladribine on distinct B cell subsets may be due to different ratios of the phosphorylating versus dephosphorylating enzymes, favoring phosphorylation of cladribine, particularly in memory B cells. Flow cytometric analysis of enzyme expression did not reveal differences in the ratio of these two enzymes in different B cell subsets. 20 However, it has been suggested that enzyme activity rather than expression is higher in activated lymphocytes.21,22 Furthermore, another study described that mRNA expression levels of these enzymes differed between naïve, activated, and memory B cell subsets, again supporting the concept that this might be the reason for the subset-selectivity of cladribine, particularly targeting memory B cells. 19 In this line, our scRNA sequencing analysis revealed differential expression levels of these enzymes within the B cell compartment, with relatively higher expression of DCK over NT5E within out activated memory B cell cluster 4 (Supplemental Figure 12); thus, supporting the concept that the predominant effect on memory B cells is at least partly due to a higher potential of these cells for cladribine activation.
Our in-depth profiling of the peripheral B cell compartment by bulk and single-cell transcriptomics revealed several important cues: First of all, we could illustrate a profound and sustained reduction of distinct memory B cell subsets as opposed to other B cell subsets, and this effect remained over a period of up to 24 months after cladribine treatment initiation. This pattern is similar to alemtuzumab-induced alterations, in which a consistent depletion of memory B cells is also observed. In this case, however, there is an overshooting repopulation of both immature and mature B cells, illustrating that the net effects of the two drugs on B cell subsets are rather distinct. 23 Indeed, specific kinetics of B cell subset repopulation have been suggested to underly the alemtuzumab-specific side-effect of treatment-induced secondary autoimmunity, which has not been described to that extent in cladribine-treated patients.24,25 The similarities of alemtuzumab and cladribine with regard to memory B cell depletion support the previously suggested concept that one key mechanism of action of DMT in MS is related to their effects on memory B cells – either numbers or function, thereby further highlighting the long-overseen role of this population in MS pathophysiology. 26 From a mechanistic point of view, this concept is fueled by the observation of memory B cell-induced auto-proliferation of brain-homing autoreactive CD4+ T cells, which is strong experimental evidence of the suggested B cell–T cell interaction at the center of MS pathophysiology. 27 Our bulk transcriptomic analysis of B cells before and after cladribine treatment also supports this concept, as we observe that the selective depletion of memory B cell clusters causes a shift in the transcriptional profile of the peripheral blood B cell compartment towards a less inflammatory pattern, in particular with regard to pathways involved in B and T cell differentiation. It is therefore conceivable that cladribine treatment reduces the probability of T cell activation triggered by memory B cells. In this line, the re-emerging concept of EBV (Epstein–Barr virus) triggering autoreactive T cell responses in the center of MS pathogenesis, further fuels the idea that the clinical effects of cladribine – as well as other MS drugs acting on memory B cells – are at least partially due to the depletion of EBV-infected memory B cells driving CNS inflammation, which had recently been suggested as one mechanism of action of anti-CD20+ drugs. 28
It should be noted that our bulk transcriptomic analysis of CD4+ and CD8+ T cells under cladribine treatment revealed only minor changes in their overall transcriptional profiles, at least in comparison to the changes in B cells. This supports the idea that cladribine exerts rather modest effects on the T cell functional profile, which at least suggests that direct effects of cladribine on the T cell compartment might not be the central mode of action of this drug. In other words, it may be postulated that direct modulation of T cell responses by DMT may not be as essential as initially thought. This idea is fueled by the observation of the strong and fast therapeutic effects of anti-CD20+ drugs in MS, 29 which obviously do not directly target the T cell compartment, at least not on short notice. We believe that the prevailing concept of T cells remaining in the center of MS pathophysiology needs to be challenged, at least when the disease is fully established.
Second, our analysis revealed that a more robust reduction of selected memory B cell clusters was associated with an increased treatment response, again corroborating the hypothesis that targeting the memory B cell population is key for cladribine-mediated effects in MS patients. However, our cluster data also illustrate that the memory B cell compartment consists of various subsets with potentially different functional profiles and a rather heterogenous response to cladribine-mediated effects. This may also explain why we could not observe any differences in total memory B cell counts between stable and active patients. A better understanding of the different functional profiles of these particular memory B cell clusters would be highly interesting, especially with regard to their potential role in the context of propagating autoimmunity, and this should be addressed in future projects. Furthermore, it still remains an open question at which time point such treatment response-dependent differences can be detected and whether this analysis may therefore in the future be used as surrogate parameter to monitor treatment response in individual patients. Notably, we could rule out direct effects of cladribine of the transcriptional profiles within each cluster, thus demonstrating that the net effect of cladribine treatment on B cell transcriptional profiles – which may underlie its immune-modulatory effect – is due to altered subset composition rather than direct changes in their transcriptional activity.
Our study has several limitations: First of all, this is an exploratory study and a larger sample size will be necessary to validate our highly interesting findings of a relation between memory B cell reduction and treatment response. Second, our analysis only focused on the peripheral immune compartment. It would be interesting to analyze the effects of cladribine treatment on T and B cell subset composition in the cerebrospinal fluid as a proxy to the CNS, especially in light of a recent publication pointing towards a key role of clonally expanded B cells directed against the EBNA1-peptide with cross-reactivity to GlialCAM. 30
Taken together, our study revealed predominant and long-lasting effects of cladribine treatment on memory B cell populations, thereby affecting the overall transcriptional profile of the B cell compartment. Further studies are needed to investigate whether monitoring of the extent of cladribine-associated changes of memory B cell subsets may serve as a biomarker predicting the individual treatment response.
Supplemental Material
sj-docx-1-tan-10.1177_17562864231211077 – Supplemental material for Single-cell profiling reveals preferential reduction of memory B cell subsets in cladribine patients that correlates with treatment response
Supplemental material, sj-docx-1-tan-10.1177_17562864231211077 for Single-cell profiling reveals preferential reduction of memory B cell subsets in cladribine patients that correlates with treatment response by Valerie E. Teschner, Ann-Katrin Fleck, Carolin Walter, Anna-Sophie Schwarze, Melanie Eschborn, Timo Wirth, Olga V. Steinberg, Andreas Schulte-Mecklenbeck, I-Na Lu, Marisol Herrera-Rivero, Claudia Janoschka, Jan D. Lünemann, Nicholas Schwab, Gerd Meyer zu Hörste, Julian Varghese, Catharina C. Gross, Refik Pul, Christoph Kleinschnitz, Simone Mader, Edgar Meinl, Monika Stoll, Heinz Wiendl and Luisa Klotz in Therapeutic Advances in Neurological Disorders
Supplemental Material
sj-docx-2-tan-10.1177_17562864231211077 – Supplemental material for Single-cell profiling reveals preferential reduction of memory B cell subsets in cladribine patients that correlates with treatment response
Supplemental material, sj-docx-2-tan-10.1177_17562864231211077 for Single-cell profiling reveals preferential reduction of memory B cell subsets in cladribine patients that correlates with treatment response by Valerie E. Teschner, Ann-Katrin Fleck, Carolin Walter, Anna-Sophie Schwarze, Melanie Eschborn, Timo Wirth, Olga V. Steinberg, Andreas Schulte-Mecklenbeck, I-Na Lu, Marisol Herrera-Rivero, Claudia Janoschka, Jan D. Lünemann, Nicholas Schwab, Gerd Meyer zu Hörste, Julian Varghese, Catharina C. Gross, Refik Pul, Christoph Kleinschnitz, Simone Mader, Edgar Meinl, Monika Stoll, Heinz Wiendl and Luisa Klotz in Therapeutic Advances in Neurological Disorders
Supplemental Material
sj-docx-3-tan-10.1177_17562864231211077 – Supplemental material for Single-cell profiling reveals preferential reduction of memory B cell subsets in cladribine patients that correlates with treatment response
Supplemental material, sj-docx-3-tan-10.1177_17562864231211077 for Single-cell profiling reveals preferential reduction of memory B cell subsets in cladribine patients that correlates with treatment response by Valerie E. Teschner, Ann-Katrin Fleck, Carolin Walter, Anna-Sophie Schwarze, Melanie Eschborn, Timo Wirth, Olga V. Steinberg, Andreas Schulte-Mecklenbeck, I-Na Lu, Marisol Herrera-Rivero, Claudia Janoschka, Jan D. Lünemann, Nicholas Schwab, Gerd Meyer zu Hörste, Julian Varghese, Catharina C. Gross, Refik Pul, Christoph Kleinschnitz, Simone Mader, Edgar Meinl, Monika Stoll, Heinz Wiendl and Luisa Klotz in Therapeutic Advances in Neurological Disorders
Supplemental Material
sj-pdf-4-tan-10.1177_17562864231211077 – Supplemental material for Single-cell profiling reveals preferential reduction of memory B cell subsets in cladribine patients that correlates with treatment response
Supplemental material, sj-pdf-4-tan-10.1177_17562864231211077 for Single-cell profiling reveals preferential reduction of memory B cell subsets in cladribine patients that correlates with treatment response by Valerie E. Teschner, Ann-Katrin Fleck, Carolin Walter, Anna-Sophie Schwarze, Melanie Eschborn, Timo Wirth, Olga V. Steinberg, Andreas Schulte-Mecklenbeck, I-Na Lu, Marisol Herrera-Rivero, Claudia Janoschka, Jan D. Lünemann, Nicholas Schwab, Gerd Meyer zu Hörste, Julian Varghese, Catharina C. Gross, Refik Pul, Christoph Kleinschnitz, Simone Mader, Edgar Meinl, Monika Stoll, Heinz Wiendl and Luisa Klotz in Therapeutic Advances in Neurological Disorders
Footnotes
Acknowledgements
First, we sincerely thank all the study participants in this study. Furthermore, we thank J. Meyer and M. L. Frankenberg (University Hospital Münster, Münster, Germany) for excellent technical assistance. We thank the Core Facility Genomics at the Medical Faculty of the University Münster, Germany for excellent work of gene expression profiling and RNA sequencing. Finally, we thank E. Schumann, C. Schulze Weppel, A. Seeger, L. Langer, and D. Roosterman (all Department of Neurology, Institute of Translational Neurology, University Hospital Münster, Germany) for excellent organization and performing of bio-banking.
Declarations
Supplemental material
Supplemental material for this article is available online.
References
Supplementary Material
Please find the following supplemental material available below.
For Open Access articles published under a Creative Commons License, all supplemental material carries the same license as the article it is associated with.
For non-Open Access articles published, all supplemental material carries a non-exclusive license, and permission requests for re-use of supplemental material or any part of supplemental material shall be sent directly to the copyright owner as specified in the copyright notice associated with the article.