
Abstract
Background:
Multiple sclerosis (MS) is an autoimmune inflammatory disease of the central nervous system that causes the damage to the myelin sheath as well as axonal degeneration. Individuals with MS appear to have changes in the numbers and functions of T-cell subsets, leading to an immunological imbalance accompanied by enhanced autoreactivity. In previous preclinical studies, (2 S,3 S,4R)-1-O-(α-D-Galactopyranosyl)-N-tetracosanoyl-2-amino-1,3,4-nonanetriol (OCH), a synthetic analog of α-galactosylceramide stimulatory for invariant NKT (iNKT) cells, has shown therapeutic or disease-preventive immunoregulatory effects in autoimmune disease models such as experimental autoimmune encephalomyelitis (EAE).
Objectives:
This study is the first-in-human study of oral OCH to evaluate the pharmacokinetics and to examine the effects on immune cells as well as related gene expression profiles.
Methods:
Fifteen healthy volunteers and 13 MS patients who met the study criteria were enrolled. They were divided into five cohorts and received oral administration of various doses of granulated powder of OCH (0.3–30 mg), once per week for 4 or 13 weeks. Plasma OCH concentrations were measured by high-performance liquid chromatography. Frequencies of lymphocyte subsets in peripheral blood were evaluated by flow cytometry, and microarray analysis was performed to determine OCH-induced changes in gene expression.
Results:
Oral OCH was well tolerated, and its bioavailability was found to be sufficient. Six hours after a single dose of OCH, increased frequencies of Foxp3+ regulatory T-cells were observed in some cohorts of healthy subjects and MS patients. Furthermore, gene expression analysis demonstrated an upregulation of several immunoregulatory genes and downregulation of pro-inflammatory genes following OCH administration.
Conclusion:
This study has demonstrated immunomodulatory effects of the iNKT cell-stimulatory drug OCH in human. Safety profiles together with the presumed anti-inflammatory effects of oral OCH encouraged us to conduct a phase II trial.
Introduction
Multiple sclerosis (MS) is a demyelinating inflammatory disease of the central nervous system (CNS), in which T-cells reactive to myelin autoantigens are assumed to play a pathogenic role. The development of MS is likely to be triggered or promoted by a breakdown of the delicate balance between autoreactive T-cells and regulatory lymphocytes. Several studies have found numerical and functional alterations of immunoregulatory lymphocytes such as Foxp3+ T regulatory (Tregs) and invariant natural killer T (iNKT) cells in the peripheral blood of patients with MS.1–3 Any attempt to correct this immune imbalance could be an attractive therapeutic strategy for MS.
Depending on the presence of cytokines or costimulatory signals, activation of CD4+ T-cells gives rise to distinct effector populations namely Th1, Th2, and Th17 and non-effector regulatory (Treg) cells. iNKT cells are a unique subset of lymphocytes that recognize glycolipid antigens presented by a monomorphic glycoprotein CD1d. 4 Both mice and human iNKT cells respond to a prototype glycolipid ligand α-galactosylceramide (α-GalCer) bound to CD1d molecule by producing both pro-inflammatory and anti-inflammatory cytokines. iNKT cells in the peripheral blood are reduced in number in patients with MS, as compared to healthy subjects. 5 Furthermore, CD4+ iNKT cell lines derived from MS patients have been shown to exhibit a Th2 bias as compared to those from healthy individuals, 5 suggesting that CD4+ iNKT cells may play an immunoregulatory role in MS.
We previously identified a sphingosine-truncated analog of α-GalCer, named OCH ((2 S,3 S,4R)-1-O-(α-D-Galactopyranosyl)-N-tetracosanoyl-2-amino-1,3,4-nonanetriol), which would selectively induce the production of interleukin (IL)-4 and not pro-inflammatory cytokines from iNKT cells.6–9 Oral administration of OCH ameliorated the development of experimental autoimmune encephalomyelitis (EAE) in mice. 9 However, the effect of OCH was not observed in mice deficient for iNKT cells, indicating that the efficacy of OCH is mediated by activation of iNKT cells. Notably, ex vivo stimulation of human lymphocytes with OCH-induced CD4+ iNKT cell lines characterized by a biased production of Th2 cytokines, 6 indicating that the therapeutic effects of OCH may be also reproduced in human MS. In this study, we examined the safety profile, pharmacokinetics and the immunomodulatory effects of oral OCH in humans in an investigator-initiated clinical trial. This first-in-human trial showed that oral administration of OCH has significant effects in both healthy individuals and patients with MS.
Methods
Subjects
Fifteen healthy volunteers and thirteen MS patients who met the study criteria were enrolled in this study (Table 1). Inclusion criteria were as follows: for healthy volunteers, aged between 20 and 50 years, a body mass index between 18.5 and 25 kg/m2; for patients with MS, aged between 20 and 65 years, who had been diagnosed with relapsing-remitting MS by the revised McDonald Criteria, 10 with an Expanded Disability Status Scale (EDSS) score of <7.0. All MS patients were in remission phase at the time of inclusion in this study. Exclusion criteria for healthy volunteers and MS individuals are listed in Supplementary Table 1.
List of subjects enrolled in this study.

MS, multiple sclerosis.
Study design
The study was conducted at National Center Hospital, in the National Center of Neurology and Psychiatry (NCNP), as an investigator-initiated trial (Clinical Trial Registration Number: UMIN000009382). Written informed consent was obtained from all subjects, and this study was performed in accordance with the Declaration of Helsinki and the International Conference on Harmonization Guidelines for Good Clinical Practice and all applicable local and national regulatory laws.
Fifteen healthy subjects were enrolled, divided into five cohorts and received oral administration of various doses of granulated powder of OCH (0.3, 1, 3, 10, or 30 mg; cohorts A, B, C, D, or E, respectively) at a single time point. MS patients were allocated to one of three cohorts and received oral administration of various doses of granulated powder of OCH (0.3, 1 or 3; cohorts H, I, or J, respectively) once per week for 4 weeks (cohort I, J) or 13 weeks (cohort H).
Plasma concentration measurement
Blood samples were collected at 0, 6, 13, 21, 24, 30, 36, 48, 72, 96, and 144 h (cohort A-E); 0, 12, 24, and 36 h (cohort H); 0, 6, 12, 24, 36, 48, 72, 96, 120, and 168 h (cohort I and J) after OCH administration. Plasma OCH concentrations were measured by high-performance liquid chromatography (HPLC, SHIMADZU-10A, Kyoto, Japan) for pharmacokinetic analysis.
Flow cytometric analysis of peripheral blood
To evaluate frequency of lymphocyte subsets in peripheral blood before and after OCH administration, venous blood was sampled at 24 h before OCH administration (baseline, 0 h) and at 6, 24, 48, and 144 h after OCH administration. Peripheral blood mononuclear cells (PBMCs) were isolated by density-gradient centrifugation using Ficoll-Paque Plus (GE Healthcare, Tokyo, Japan). PBMCs were stained for iNKT cells, T-cells, MAIT cells, NK cells, B-cells, Treg cells, monocytes and dendritic cells, with fluorochrome-conjugated antibodies according to the staining panels and gating strategies (Supplementary Figure 1; Supplementary Tables 2–4) and analyzed by FACSCanto II (BD Bioscience, Franklin Lakes, NJ). For intracellular staining of Tregs, PBMCs were fixed with BD Stabilizing Fixative (BD Bioscience), and permeabilized with Permeabilization Buffer (eBioscience, Santa Clara, CA). To stain intracellular cytokines, PBMC were stimulated with 50 ng/mL of phorbol-myristate-acetate (Sigma-Aldrich, MO, USA), 500 ng/mL of ionomycin (Sigma-Aldrich), and 2 µM monensin (Sigma-Aldrich) for 4 h before staining. The frequency of cytokine producing cells among memory CD4+ T-cells were measured. Stained cells were analyzed using FACSCanto II (BD Bioscience). Flow cytometric data were analyzed using FlowJo (TreeStar, San Carlos, CA) by an investigator blind to the conditions.
Microarray analyses
Whole blood samples were collected in PAXgene Blood RNA collection tubes (BD Bioscience). Total RNA was isolated using a PAXgene Blood miRNA Kit (Qiagen, Hilden, Germany) according to the manufacturer’s protocol, and gene expressions were analyzed using SurePrint G3 Human Gene Expression Microarray 8 × 60K Ver.2.0 (Agilent Technologies Inc., Santa Clara, CA). For sample preparation and array processing, the Agilent protocol ‘One-Color Microarray-Based Gene Expression Analysis’ was used. Data were obtained using an Agilent Feature Extraction software (version 10.7.1.1) with defaults for all parameters.
Microarray analyses were performed using a GeneSpring GX (version 12.0) software (Agilent Technologies Inc.). Reliability of each expression value was represented by a flag based on the GeneSpring default settings (Detected, Compromised, and Not Detected). The expression levels of each gene were computed by the ratio of gene expression at 6 h or 24 h after OCH administration to baseline. Differentially expressed genes were selected with the following criteria: (1) gene expression ratio of >1.50 or <0.67, with samples flagged as ‘Not Detected’ from either group excluded; (2a) gene expression ratio of >4, with samples at 6 h or 24 h flagged as ‘Not Detected’ excluded, and one or more samples at baseline flagged as ‘Not Detected’ included; (2b) gene expression ratio of <0.25, with samples at baseline flagged a ‘Not Detected’ excluded, and one or more samples at 6 h or 24 h flagged as ‘Not Detected’ included. The gene ontology (GO) functional enrichment analysis of the differently expressed genes was performed using a Cytoscape software and a Bingo plug-in. 11
Real-time RT-PCR analysis
Analysis of mRNA levels was performed by reverse transcription polymerase chain reaction (RT-PCR). Total RNA was isolated from blood samples using a PAXgene Blood miRNA Kit (Qiagen, Hilden, Germany) according to the manufacturer’s protocol. First-strand cDNA was synthesized using PrimeScript RT Master Mix (Takara Bio, Shiga, Japan) from 1 μg of total RNA extracted from each blood sample. Real-time RT-PCR was performed using SYBR Premix Ex Taq (Takara Bio) and a LightCycler 96 System (Roche Diagnostics, Basel, Switzerland) according to the manufacturer’s protocol. mRNA levels were normalized to endogenous β-actin in each sample. The specific primers used in this study are listed in Supplementary Table 5.
MRI analysis
Brain magnetic resonance imaging (MRI) were performed in all the participants within the week preceding OCH administration and repeated either 90 days post-OCH or at the time of cessation of OCH. MRI without gadolinium enhancement was performed in healthy subjects, and MRI with gadolinium enhancement was performed in patients with MS. Spinal cord MRI were performed in MS patients with suspected spinal cord lesions based on neurological assessment. The following imaging method and measurements were performed: Number of new lesions on T2-weighted MRI images; Number of new low-signal foci on T1-weighted MRI images; and Number of MS lesions on gadolinium contrast-enhanced T1-weighted MRI images.
Safety profile
Safety profiles were evaluated from the beginning of OCH administration through the course of participation in the clinical trial. An investigator blind to the treatment conditions evaluated any clinical adverse events observed during the study and characterized them as mild or severe.
Statistical analysis
Statistical analysis was performed with a Prism software (GraphPad Software, San Diego, CA). A repeated measures analysis of variance (ANOVA) followed by Dunnett’s Multiple Comparison Test was used to evaluate differences in the frequency of each PBMC subset between baseline and each subsequent time point in the same subject. P values of <0.05 were considered statistically significant.
Results
Plasma concentration of OCH after oral administration
We first sought to determine the plasma concentration of OCH following oral administration. The doses were chosen based on the results from our preclinical studies, which included the observation that pharmacological action was observed in EAE mice at 0.4 to 0.5 mg/kg and in naïve Macaque monkeys at 1.2 mg/kg (data not shown). Figure 1 and Supplementary Figure 2 show the pharmacokinetics of each cohort (Figure 1(a): healthy subject, Figure 1(b): MS patient). We found a clear dose-dependent increase in the plasma concentration of OCH, and the peak concentration by 3 mg and higher doses was reached at 36 h. To our surprise, the plasma concentrations of OCH in both healthy controls and MS patients were much higher than those anticipated from our preclinical studies in experimental animals (3–9 times higher than that in mice and 6–22 times higher than that in Macaque monkeys), suggesting that the bioavailability of OCH in human is higher than other species (NCNP, data not shown). These data indicated that the bioavailability of OCH is good, both in healthy subjects and MS patients.
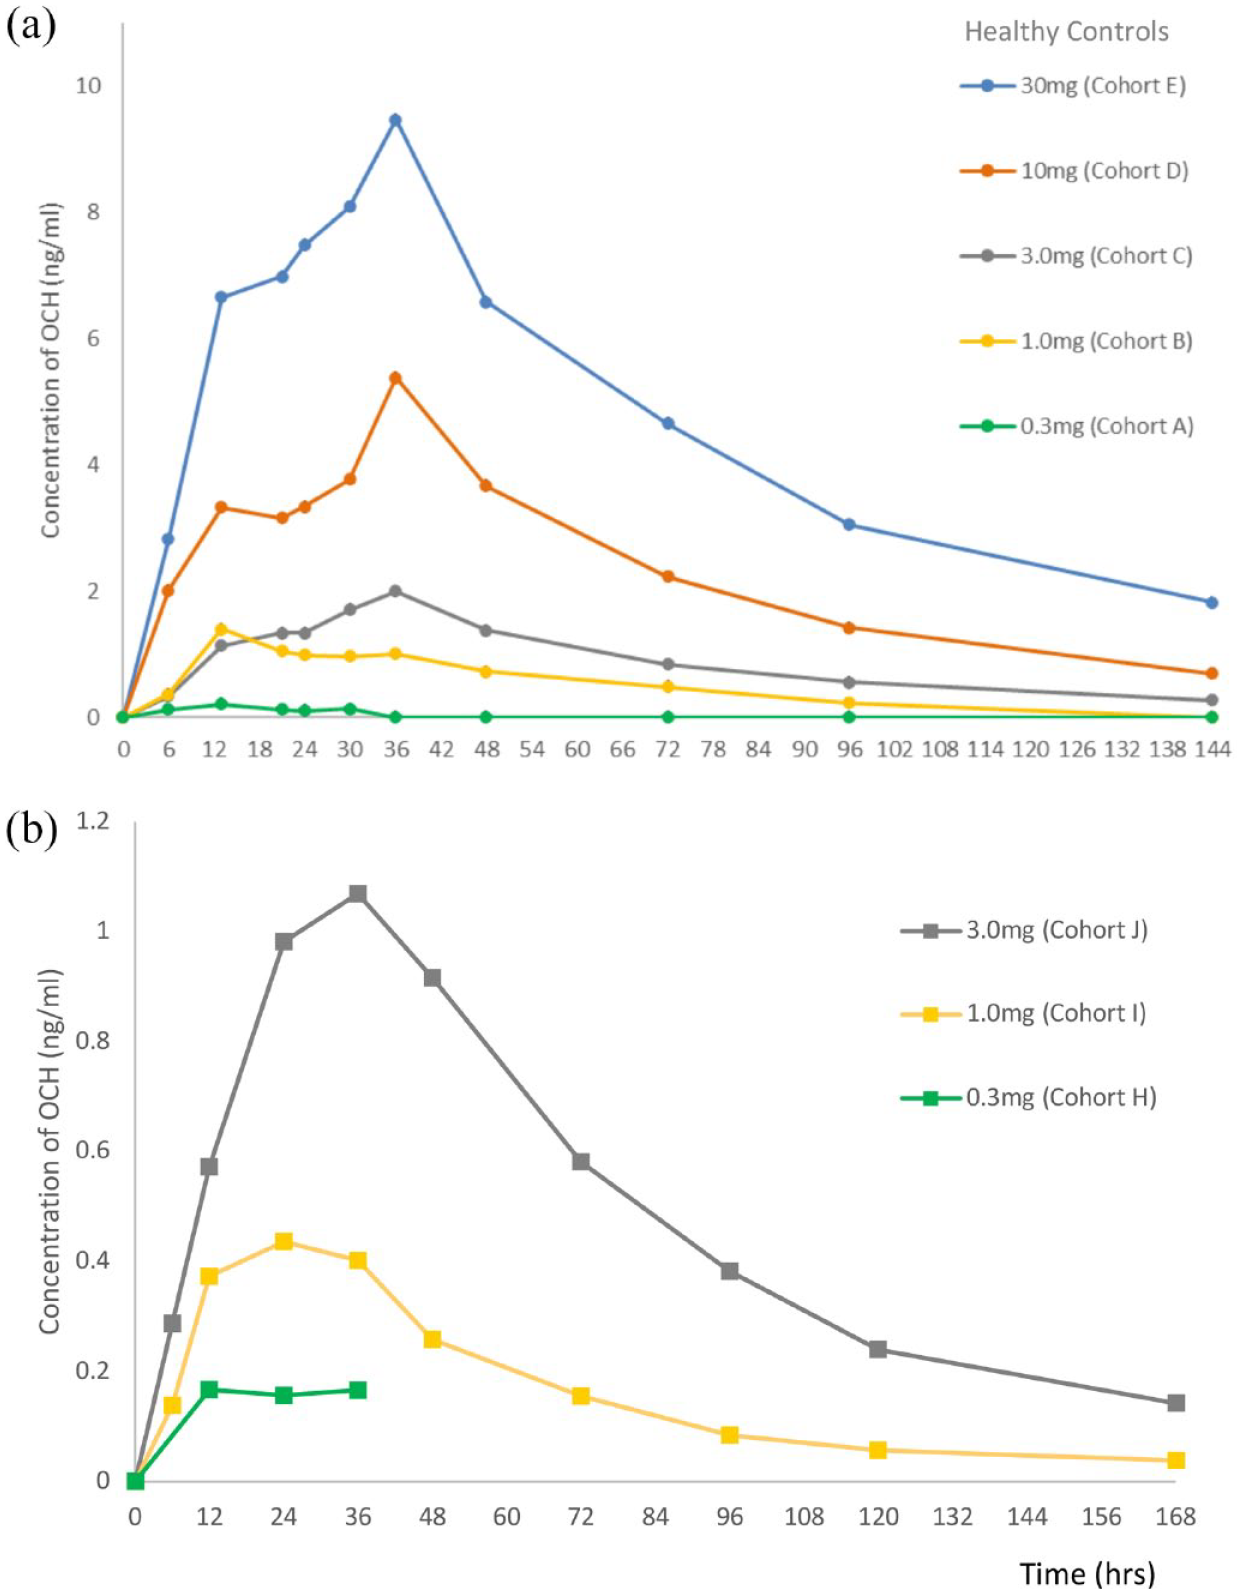
Plasma concentration of OCH after single dose of oral administration. (a) Healthy control cohort. Fifteen healthy subjects were allocated to one of five cohorts (n = 3 per cohort) and received various doses of OCH (0.3, 1, 3, 10, or 30 mg; cohorts A, B, C, D, or E, respectively). (b) Multiple sclerosis patient cohort. Thirteen MS subjects were allocated to one of 3 cohorts (H, n = 7; I & J, n = 3) and received various doses of OCH (0.3, 1 or 3 mg; cohorts H, I or J respectively). The timepoints after 36 h in H were not available.
Effects of OCH administration on PBMC subsets
To evaluate the effect of OCH administration on the immune system, we analyzed the frequency of PBMC subsets in 15 healthy subjects at five time points (0, 6, 24, 48, and 144 h after administration) and MS patients at four time points (0, 6, 24, and 144 h after administration) following the administration of the first dose of OCH (Supplementary Table 6). The frequency of total iNKT cells and their subpopulations in PBMC did not change with OCH administration (Supplementary Table 6). Regulatory T (Treg) cells are an important cell subset for maintaining immune tolerance, and impairment of their function has been associated with various autoimmune diseases, 12 including MS. Foxp3 is an important transcription factor involved in the development of Tregs. Foxp3+ CD4+ T-cells consist of three distinct subpopulations: CD45RA+ Foxp3low naïve Tregs; CD45RA−Foxp3high effector Tregs; and CD45RA−Foxp3low non-secretory Tregs. 13 We found that the frequency of Foxp3+ T-cells among CD4+ T-cells was significantly increased at 6 h after OCH administration in cohorts E (HC 30 mg) and J (MS 3 mg) (Figure 2(a)), and there was a tendency for increase in cohorts A (HC 0.3 mg) and C (HC 3 mg). In previous reports, CD45RA−Foxp3high effector Treg cells were shown to have stronger regulatory function than CD45RA+ Foxp3low naïve Treg cells.14,15 We found that CD45RA−Foxp3high effector Treg cells were upregulated at 6 h after OCH administration in cohorts A (HC 0.3 mg), B (HC 1 mg), E (HC 30 mg), and J (MS 3 mg) (Figure 2(b)). In other cohorts, except for cohort D (HC 10 mg), CD45RA−Foxp3high Treg cells tended to increase at 6 h after OCH administration. These data indicated that oral OCH administration would increase the frequency of effector Treg cells in the peripheral blood in a relatively short period of time. There was no significant correlation with OCH plasma concentration, indicating that early events taking place in the gut mucosa or adjacent lymphoid organs may account for the rapid expansion of Treg cells observed in the peripheral blood.

Upregulation of Foxp3+ regulatory T-cells 6 h after OCH administration in PBMCs. (a) Comparison of the frequencies of Foxp3+ subsets of CD4+ T-cells from subjects in each cohort. Lines connect data from paired samples of the same subject. (b) Comparison of the frequencies of the CD45RA− Foxp3 high-effector Treg cell subset of CD4+ T-cells from subjects in each cohort. Lines connect data for paired samples from the same subjects.
We also investigated the frequency of other PBMC subsets, including CD3+ T-cells and their subpopulations, CD19+ B-cells and their subpopulations, NK cells, CD14+ monocytes, and subpopulations of DCs. However, there were no statistically significant changes with OCH administration in these PBMC subsets (Supplementary Table 6).
Furthermore, we found that the frequencies of granulocyte-macrophage colony-stimulating factor (GM-CSF)+ cells among memory CD4+ T-cells was significantly decreased in cohort B (HC 1 mg) and E at 24 h and tended to decrease in other cohorts as well (Figure 3). Of interest, Galli et al. 16 recently reported that GM-CSF expression is one of the hallmarks of T-helper cells derived from MS. Taken together, the changes observed by flow cytometry allowed us to speculate that oral OCH administration may correct the pro-inflammatory changes linked with disease activity in MS.

Effects of OCH administration on GM-CSF+ CD4+ T-cells. The frequencies of GM-CSF+ cells among memory CD4+ T-cells in the peripheral blood of subjects before (pre) and after OCH treatment (24 h in healthy subject cohorts (A–E, all doses); 6 and 24 h in MS 0.3 mg group (cohort H); and 6 h in MS 1 and 3 mg groups (cohort I and J, respectively).
Microarray analysis of whole blood mRNA
To investigate the effect of OCH administration on the peripheral blood transcriptome, we performed microarray analyses of whole blood mRNA from healthy subjects. Because informed consent for these analyses could not be obtained from three healthy subjects, 36 whole blood samples were used for mRNA isolation. Blood was collected from individuals in the various cohorts at three time points (baseline, 6 and 24 h post-OCH administration). The mRNA from three samples did not meet the quality standard, and therefore, we excluded such samples from another three subjects from the analysis. In addition, because cohorts B (HC 1 mg) and D (HC 10 mg) included only one subject each, we excluded these cohorts from the analysis. Finally, we analyzed the samples at the three time points from two subjects in cohort A (HC 0.3 mg), three subjects in cohort C (HC 3 mg), and two subjects in cohort E (HC 30 mg). At 6 h, four genes were upregulated and three genes were downregulated in all three cohorts of healthy subjects (Figure 4(a)). At 24 h, seven genes were upregulated and seven genes were downregulated in all three cohorts of healthy subjects. Among these genes, several with immune associations were identified, and we analyzed those genes also in MS patients at 6 and 24 h after the first administration of OCH (Figure 4(b)). EGR2 (early growth response 2) was upregulated and peaked at 6 h in all three healthy subject cohorts and upregulation was also observed in cohort I (MS 1 mg) at 6 h. EGR2 is known to be associated with T-cell anergy and expressed in CD4+ CD25− LAG3+ regulatory T-cells. 17 MAFB (v-maf avian musculoaponeurotic fibrosarcoma oncogene homolog B) was upregulated at 6 and 24 h in all cohorts, except for cohorts I (MS 1 mg) and J (MS 3 mg) at 24 h, which were not determined. MafB is expressed in macrophages and monocytes and has been reported to suppress differentiation of monocytes into DCs. 18 KIR3DL2, which is generally associated with NK cells, was downregulated at 24 h in all cohorts. As we did not observe any changes in the frequency of NK cells or CD56high NK cells in the peripheral blood (Supplementary Table 6), it may represent a functional alteration of NK cells by OCH administration. Expression of GZMB, which encodes Granzyme B, was also downregulated by OCH treatment. Granzyme B is a 32 kDa serine protease released from the granules of NK cells and T-cells and renders their cytotoxicity. Since both inflammatory and regulatory subsets of NK cells and T-cells express GZMB, the implications of GZMB reduction is unclear at present. However, as Granzyme B is thought to play a key pathogenic molecule in progressive MS,19,20 the OCH-induced change of GZMB should be further evaluated in the future studies. IL4I1 (interleukin 4 induced 1) was upregulated and peaked at 6 h in all three healthy subject cohorts, and upregulation of IL4I1 was also observed in MS patient cohorts. IL4I1 suppresses Th17 cell proliferation and promotes Treg differentiation.21,22 FOS and FOSB encode transcription factors c-Fos and FosB, which is associated with T-cell differentiation and proliferation. 23 The expression levels of FOSB and FOS were downregulated in all cohorts. NR4A2, which is reported to be increased in MS patients and to be related to IL-17 production from Th17 cells24,25 was also downregulated in all cohorts. We validated the expression of these genes using real-time RT-PCR analysis, and the results were largely consistent with those from the microarray analysis (Supplementary Figure 3).

Immune-associated genes modulated by oral OCH administration. (a) Venn diagram showing differentially regulated or overlapping genes in HC 0.3 mg, HC 3 mg and HC 30 mg groups (cohorts A, C, and E, respectively), at 6 and 24 h after oral administration of OCH. The genes displayed in the box are upregulated or downregulated in all three cohorts. (b) Immune-associated genes modulated by oral OCH administration in HC 0.3 mg, HC 3 mg, HC 30 mg, MS 1 mg and MS 3 mg groups (cohorts A, C, E, H, I and J). Graphs demonstrate fold changes in the expression levels of upregulated or downregulated genes in indicated cohorts. Data are expressed as the ratio of expression value at baseline and 6 or 24 h, with logarithmic transformation (log2). (c) Expression levels of type I interferon-related genes before and after oral OCH administration. Heat map of the fold changes in the expression of type I interferon-related genes in each subject between baseline and 24 h after administration of OCH. Upregulated genes are colored in red and downregulated genes are colored in green.
To elucidate the biological processes induced by oral administration of OCH, we performed a GO enrichment analysis (GOEA), and found that OCH administration upregulated the type I interferon (IFN)-related-pathways, especially in cohort C (Table 2). To confirm these findings, we selected 68 genes that are included in type I IFN-related pathways and calculated individual mRNA expression fold changes in each subject between baseline and 24 h (Figure 4(c)). The expression levels of a large proportion of these genes were upregulated in five of seven healthy subjects and in the majority of (8 out of 11) MS patients. However, the expression levels of these genes were reduced in one healthy subject and one MS patient. These data suggested that OCH administration induced changes in the expression of type I IFN-related genes in both healthy subjects and MS patients, but that large inter-individual differences exist.
GO enrichment analysis cohort C (upregulated genes at 24 h).

GO, gene ontology.
Safety profile
Summary of safety profiles is shown in Table 3. There were no serious adverse events or adverse events that led to discontinuation of administration in healthy adults. However, in individuals with MS, serious adverse events were observed in four patients: (1) Altered state of consciousness and metabolic acidosis concomitantly with MS relapse, (2) MS relapse assumed to have started before OCH administration, (3) depression in the cohort receiving 0.3 mg OCH, and (4) fatigue and muscle weakness in the cohort receiving 3 mg OCH.
Safety profiles.

MS, multiple sclerosis.
The above-mentioned severe adverse events for the individuals receiving 0.3-mg OCH led to discontinuation of the drug. Altered state of consciousness and metabolic acidosis concomitantly with MS relapse occurred at 1 h 40 min after the first administration of OCH. The evaluation by the Safety Evaluation Committee concluded that this event could be as a result of generalized seizures. Brain MRI performed at 1 h after this revealed a new subcortical lesion in the right frontal lobe. In addition, approximately 3 months before the event, this patient had discontinued fingolimod. It has been reported that approximately 2 to 4 months after the termination of fingolimod treatment, risk of relapses increases. 26 The patient who experienced the adverse effect of severe depression had a history of depression, suggesting that participation of the clinical trial may have been a stressful event that triggered depression.
Muscle weakness and fatigue in the patient receiving 3 mg OCH occurred on Day 12, after completion of four doses of OCH over a month. The patient was hospitalized and evaluated thoroughly but no neurological worsening was observed, and it subsided without medication.
In the course of this clinical trial, no new MS lesions of clinical significance were detected except for one case ((Cohort H (MS 0.3 mg), ID No. 6)), in which MS relapse was confirmed by detection of a new gadolinium contrast-enhanced T1 lesion. In summary, OCH is well tolerated in healthy adults and patients with relapsing-remitting MS.
Discussion
The aim of this first-in-human clinical trial was to study the safety and pharmacokinetics of oral OCH administration and to investigate the effects of OCH on peripheral immune cell subsets and gene expression profiles of peripheral blood lymphocytes. First, OCH was found to be well tolerated in healthy and MS individuals, despite the occurrence of adverse events for which other factors might be responsible. Second, the pharmacokinetic analysis (Figure 1) showed that the bioavailability of OCH was much better than anticipated from preclinical studies, excluding the concern that oral OCH might not work in human because of poor bioavailability.
The analysis of PBMC subsets revealed a general trend that the frequency of Treg cells increased after OCH administration (an increase of Foxp3+ Treg or of CD45RA-Foxp3high Treg was shown in 12 of 15 healthy subjects, and in 11 of 13 MS patients) and significant increases in either of the regulatory subsets were observed in 4 out of 8 cohorts at 6 h (Figure 2). In contrast, potentially pathogenic GM-CSF+ T-cells tended to decrease in healthy subjects at 24 h (a reduced frequency of GM-CSF+ T-cells was seen in 14 of 15 subjects; Figure 3). Unexpectedly, the increase of Treg populations and the reduction of GM-CSF+ T-cells did not correlate with given OCH dose or plasma concentration of OCH, raising a possibility that iNKT cell-Treg interactions may take place in the intestine (discussed below).
By conducting DNA microarray analysis of whole blood cells, we were able to characterize the effects of OCH in the healthy subjects and MS patients. Although the results appeared to depend on the individual subjects and the given dose of OCH, we identified several immunoregulatory genes, including MAFB and IL4l1, that were upregulated in common after oral OCH in cohort A (HC 0.3 mg), C (HC 3 mg), and E (HC 30 mg). Also, we identified pro-inflammatory genes such as GZMB, FOSB, and NR4A2, which were downregulated in common in A (HC 0.3 mg), C (HC 3 mg), and E (HC 30 mg) cohorts (Figure 4). Future studies should aim to clarify the implications of these changes and the link with alterations of Treg and GM-CSF+ T-cells.
Treg cells have been shown to be functionally impaired in patients with autoimmune diseases, including MS. 15 In addition, iNKT cells are reduced in number in patients with MS, as compared to healthy subjects.5,27 Interactions between iNKT cells and Treg cells have been demonstrated in previous reports28,29 and human Treg cells co-cultured with iNKT cells in the presence of bacterial glycolipid showed increased production of IL-10 and upregulated expression of Foxp3. 30 These findings suggest that increased frequency of activated Treg cells observed in our study may be mediated by iNKT cell activation by OCH. However, contrary to our prediction, iNKT cell frequencies in the peripheral blood did not significantly change after OCH treatment, although iNKT cells is the primary target of OCH. We speculate that orally administered OCH may have robust effects on intestinal iNKT cells shortly after administration but systemically circulating OCH, which increases slowly after intake (Figure 1), does not have potentials of maintaining the elevation of iNKT cell numbers in the peripheral blood. In this scenario, it is reasonable to postulate that interactions between OCH-stimulated iNKT cells and Treg cells in the intestinal immune system shortly after OCH intake may enhance the mobilization of intestinal Treg to the peripheral circulation, thereby exerting the systemic regulatory effects. The fact that we found an increase in activated Treg cells in peripheral blood within 6 h after administration of OCH, while the plasma concentration of OCH at 6 h after its administration is relatively low, suggest that OCH-induced activation of iNKT cells resulting in activation and expansion of Treg cells may have occurred in the intestines. It is possible that OCH may have indirectly activated Treg cells in the intestines, followed by these cells migrating and circulating in blood causing a rapid increase in activated Treg cells in blood after OCH administration. Furthermore, decreased frequency of GM-CSF+ CD4+ T-cells following OCH administration may be an indication of suppressive effects of OCH-iNKT-induced activated Treg cells on cytokine production.
Another subset of regulatory T-cells, CD4+ CD25−LAG3+ regulatory T-cells, have been reported to produce IL-10, suppress in vivo development of colitis, and express EGR2. 17 Furthermore, EGR2 has been shown to play important roles in immunological balance in autoimmune diseases. 31 In our microarray analysis, the expression of EGR2 was upregulated after OCH administration in healthy subjects, but only in one cohort out of three in MS patients (Figure 4(b)). These data suggest that oral administration of OCH can induce expansion or activation of the regulatory T-cell subset and that the expression of EGR2 following OCH stimulation may be differentially regulated in healthy subjects and MS patients.
The microarray analysis also revealed that expression of the transcription factor MAFB was upregulated after OCH administration in all cohorts. MafB has been reported to promote monocyte differentiation into macrophages, but suppresses differentiation into DCs, 32 and the expression of MafB in macrophages induces its anti-inflammatory phenotype. 33 The upregulation of MafB by OCH administration may contribute to the induction of an anti-inflammatory phenotype in myeloid cells in peripheral blood. NK cell-associated genes, especially KIRs, were downregulated in all cohorts in microarray analysis. Activation of iNKT cells leads to the activation of NK cells via IFN-γ and IL-2 produced by iNKT cells themselves, and iNKT cells transactivate NK cells via IL-12 produced by DCs. 34 Since KIR expression in human NK cells was shown to be downregulated in response to stimulation with IL-2, 35 cytokine production from iNKT cells stimulated by OCH administration may induce NK cell activation and downregulation of KIR expression. IL4I1, which was upregulated after OCH administration, was first described in B-cells as an IL-4-inducible gene. Recently, human Th17 cells have been shown to express high levels of IL4I1, which induced low Th17 cell proliferation and IL-2 production. 36 Moreover, IL4I1 leads to the generation of Foxp3+ Treg cells in vitro through phenylalanine consumption. 21 The upregulation of IL4I1 by OCH administration suggests that OCH induces IL-4 production from iNKT cells and may contribute to an increase in Treg cells. In the microarray analysis, type I IFN-related genes were upregulated after OCH administration in several subjects, both healthy and with MS. Kakimi et al. 37 reported that OAS protein, a marker of type I IFN induction, was upregulated in the livers of mice injected with α-GalCer and that hepatitis B virus replication was suppressed in those mice in IFNα/β receptor-dependent manner. Our microarray data are consistent with these findings that activated iNKT cells can induce type I IFN production in vivo.
Our results suggest that oral administration of OCH can induce systemic immune regulatory responses. The main limitation of this study may be that the sample size is relatively small resulting in very few individuals in each cohort. However, our data showing effects of OCH on Treg cells in humans for the first time along with the safety profile data of OCH in both healthy and MS individuals provide encouraging information that will be valuable in clinical application of OCH as a therapy for autoimmune diseases. Accordingly, we moved forward to conduct a phase II trial of oral OCH.
Supplemental Material
sj-pdf-1-tan-10.1177_17562864231162153 – Supplemental material for First-in-human clinical trial of the NKT cell-stimulatory glycolipid OCH in multiple sclerosis
Supplemental material, sj-pdf-1-tan-10.1177_17562864231162153 for First-in-human clinical trial of the NKT cell-stimulatory glycolipid OCH in multiple sclerosis by Wakiro Sato, Daisuke Noto, Manabu Araki, Tomoko Okamoto, Youwei Lin, Hiromi Yamaguchi, Ryoko Kadowaki-Saga, Atsuko Kimura, Yukio Kimura, Noriko Sato, Takami Ishizuka, Harumasa Nakamura, Sachiko Miyake and Takashi Yamamura in Therapeutic Advances in Neurological Disorders
Footnotes
Acknowledgements
The authors would like to thank the late Professor Miho Murata, for her great dedication and contribution to this study. She was one of the chief clinical research investigators for this study and sadly she passed away in September 2018.
Declarations
Supplemental material
Supplemental material for this article is available online.
References
Supplementary Material
Please find the following supplemental material available below.
For Open Access articles published under a Creative Commons License, all supplemental material carries the same license as the article it is associated with.
For non-Open Access articles published, all supplemental material carries a non-exclusive license, and permission requests for re-use of supplemental material or any part of supplemental material shall be sent directly to the copyright owner as specified in the copyright notice associated with the article.