
Abstract
Background:
Subthalamic nucleus deep brain stimulation (STN-DBS) improves sleep qualities in Parkinson’s disease (PD) patients; however, it remains elusive whether STN-DBS improves sleep by directly influencing the sleep circuit or alleviates other cardinal symptoms such as motor functions, other confounding factors including stimulation intensity may also involve. Studying the effect of microlesion effect (MLE) on sleep after STN-DBS electrode implantation may address this issue.
Objective:
To examine the influence of MLE on sleep quality and related factors in PD, as well as the effects of regional and lateral specific correlations with sleep outcomes after STN-DBS electrode implantation.
Study Design:
Case–control study; Level of evidence, 3.
Data Sources and Methods:
In 78 PD patients who underwent bilateral STN-DBS surgery in our center, we compared the sleep qualities, motor performances, anti-Parkinsonian drug dosage, and emotional conditions at preoperative baseline and postoperative 1-month follow-up. We determined the related factors of sleep outcomes and visualized the electrodes position, simulated the MLE-engendered volume of tissue lesioned (VTL), and investigated sleep-related sweet/sour spots and laterality in STN.
Results:
MLE improves sleep quality with Pittsburgh Sleep Quality Index (PSQI) by 13.36% and Parkinson’s Disease Sleep Scale-2 (PDSS-2) by 17.95%. Motor (P = 0.014) and emotional (P = 0.001) improvements were both positively correlated with sleep improvements. However, MLE in STN associative subregions, as an independent factor, may cause sleep deterioration (r = 0.348, P = 0.002), and only the left STN showed significance (r = 0.327, P = 0.004). Sweet spot analysis also indicated part of the left STN associative subregion is the sour spot indicative of sleep deterioration.
Conclusion:
The MLE of STN-DBS can overall improve sleep quality in PD patients, with a positive correlation between motor and emotional improvements. However, independent of all other factors, the MLE in the STN associative subregion, particularly the left side, may cause sleep deterioration.
Keywords
Introduction
It has been estimated that 80–90% of Parkinson’s disease (PD) patients are affected by sleep–wake disturbances (SWDs), which have a strong negative impact on the quality of life.1,2 Subjective sleep complaints mostly include experience of bad sleep, insomnia, and the observations of rapid eye movement sleep behavior disorder (RBD). 3 Objective measurements including polysomnography (PSG) detected reduced total sleep time, decreased sleep efficiency, and impaired slow-wave activity. 4
Apart from enhancing motor functions, subthalamic nucleus deep brain stimulation (STN-DBS) showed promising efficacy in sleep quality improvements, for it was reported to enhance sleep quality, decrease sleep latency, extend sleep duration, and reduce daytime sleepiness.5–7 Actigraphy and video-PSG also showed STN-DBS could promote deep sleep and overnight slow-wave activity.6,8
Three factors were commonly agreed to be related to sleep improvement under STN-DBS, including motor enhancements, anti-Parkinsonian drug reduction, and emotional symptom alleviations, all of which may be positively correlated with better sleep outcomes.5,7,9–11
Previous studies have demonstrated that the positions and laterality of electrodes may yield different sleep outcomes.6,12–14 However, it remains contentious whether STN-DBS improves sleep qualities by directly affecting sleep circuits or indirectly alleviating other major symptoms like motor or emotions. Moreover, in clinical practice, it is very challenging to pinpoint the sole impact of electrode positions because this entails ruling out the influence of individualized programming patterns and stimulating duration of STN-DBS according to different patient’s cardinal symptoms, and also electric currents with different amplitudes, frequencies, and pulse widths would elicit distinct responses from affected neurons. 15
Alternatively, microlesion effect (MLE), which is caused by surgical tracks left by intra-operative electrophysiological recordings and electrode placement, may result in a temporary (days to weeks) alleviation of Parkinsonian symptoms and is also an immediate predictor of long-term STN-DBS efficacy. 16 MLE eliminates most confounding factors mentioned above, including stimulation parameters, disease progression, complications, drug dosage modifications, and so on. Previous research regarding MLE on sleep reported that MLE improved sleep quality and ameliorated subjective sleep complaints in advanced PD patients; however, no studies reported the effect of MLE on sleep with relevance to electrode locations and its correlative factors. 17
Thus, MLE is likely to be an expedient tool to help us understand how electrode position and laterality may affect sleep in PD patients. Following this idea, three objectives are highlighted in our study: (1) to examine the effects of the MLE on sleep quality in PD patients; (2) to determine the correlative factors of sleep outcomes in MLE; and (3) to identify the region and laterality-specific correlations between the MLE and sleep outcomes.
Materials and methods
Participant identification
We retrospectively collected data from patients diagnosed with PD who underwent bilateral STN-DBS at Beijing Tiantan Hospital between 2020 and 2021. The inclusion criteria are (1) PD diagnosed based on the UK Brain Bank criteria; (2) patients underwent complete preoperative clinical assessment; (3) bilateral STN-DBS surgery was performed, and (4) patients completed the 1-month follow-up assessment after the surgery. Furthermore, to avoid the influence of multiple microelectrodes traces when quantifying MLE, 5) only patients who received a single intra-operative microelectrode recording and did not undergo electrode trajectory replacement were included. The exclusion criteria are (1) patients with a history of central nervous system tumors (confirmed by magnetic resonance imaging [MRI] and/or computed tomography [CT] scan); (2) patients with a history of thalamotomy; (3) patients with severe surgery-related complications such as cerebral hemorrhage and hemiplegia; and (4) patients with severe cognitive impairment; (5) incomplete relevant assessment data. The detailed workflow of the participants’ identification is shown in Figure 1.
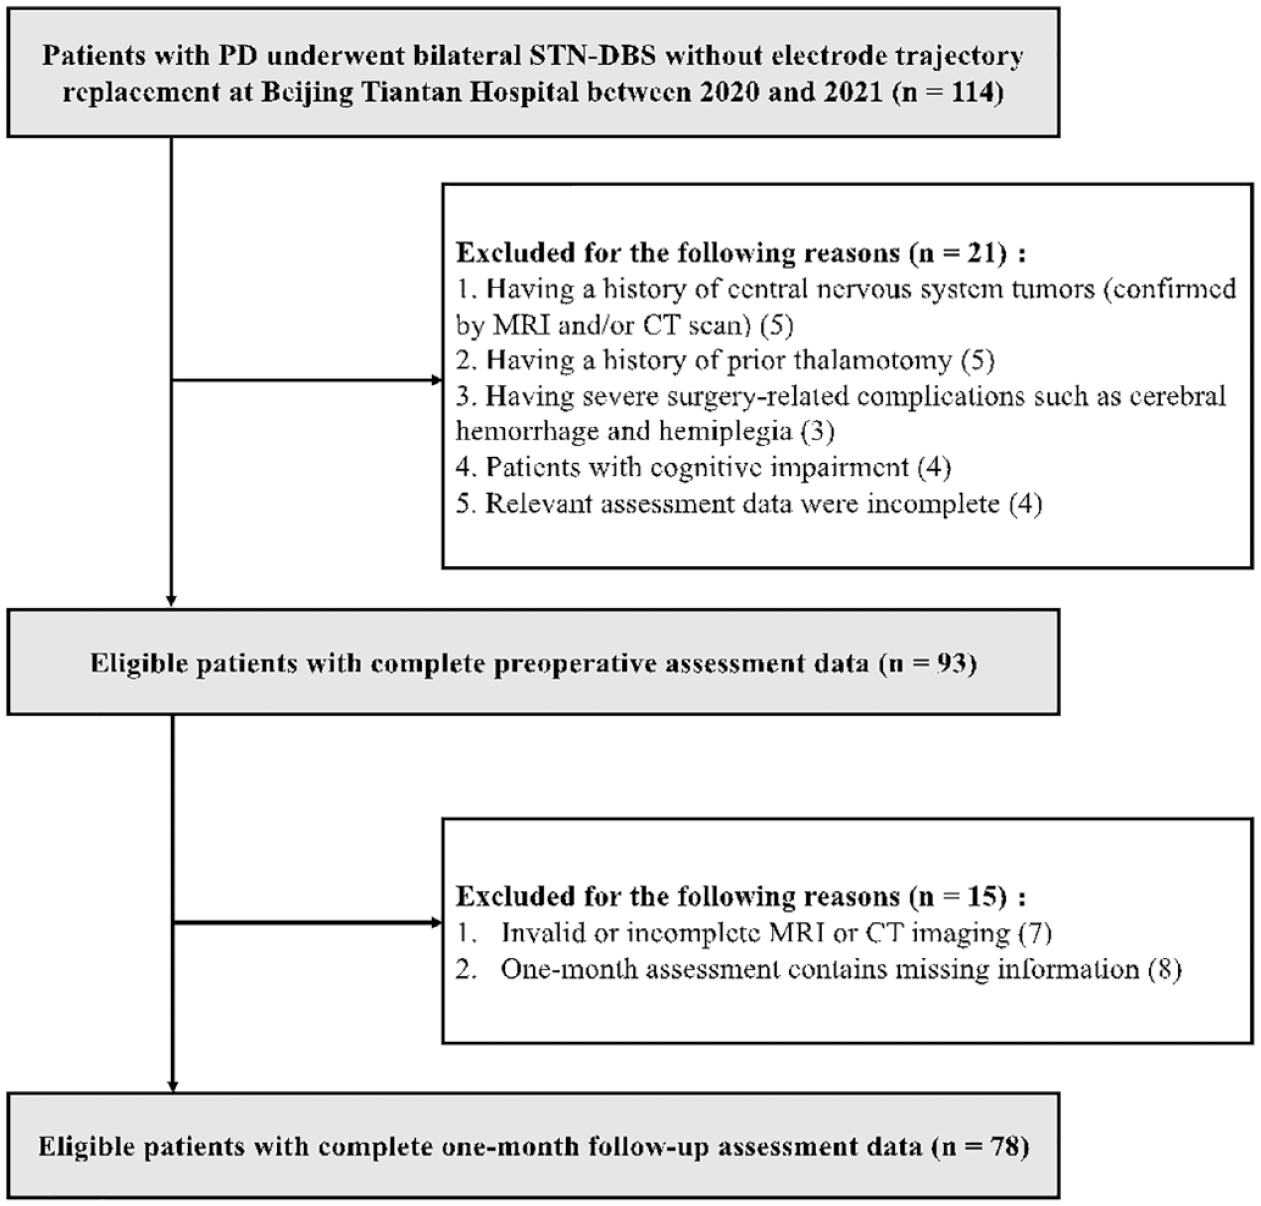
Workflow of the included patients’ identification.
This study was conducted under the approval of the institutional review board (IRB) of Beijing Tiantan Hospital (KY 2022-006-02). The study was carried out according to the tenets of the Declaration of Helsinki. All patients provided written informed consent before the study procedures.
Patients and clinical assessment
The surgical procedure was previously published by our team. 18 In brief, DBS electrodes (model 3389, Medtronic, Minneapolis, MN, USA or model L301, Pins Medical, Beijing, China) were implanted into brains facilitated by the Leksell stereotactic system (Elekta Instrument AB, Stockholm, Sweden) under local anesthesia. Intra-operative single-channel microelectrode recordings and macro-stimulation tests (once in each STN) were performed to ensure the therapeutic efficacy and observe possible adverse effects. An implantable pulse generator (IPG) that powered the electrodes was later implanted in the subclavicular area under general anesthesia. A postoperative 0.625-mm CT scan was performed to confirm and visualize the lead positions.
Clinical assessments were performed at preoperative baseline in the OFF-medication state and at 1-month follow-up after surgery in the OFF-medication and OFF-stimulation states, using the following scales:
The Pittsburgh Sleep Quality Index (PSQI) and the Parkinson’s Disease Sleep Scale-2 (PDSS-2) were selected to assess sleep conditions in the cohort because both scales were recommended and suitable to evaluate the overall sleep impairment both as screening tools and measures of severity. In addition, PDSS-2 is exclusively designed for PD and PSQI leaves out motor functions rating to avoid confounding factors, it also measures sleep quality by the past month, which mostly overlaps with the time window of the MLE. 19 PSQI measures sleep quality by seven aspects (components): subjective sleep quality, sleep latency, sleep duration, habitual sleep efficiency, sleep disturbances, sleeping medication use, and daytime dysfunction over the last month. The Parkinson’s Disease Sleep Scale-2 (PDSS-2), a 15-question scale that covers the domains of motor symptoms at night (question nos. 4, 5, 6, 12, and 13), PD symptoms at night (question nos. 7, 9, 10, 11, and 15), and disturbed sleep (question nos. 1, 2, 3, 8, and 14). 20
Patients were instructed to follow the same dosage of drug intake exactly as preoperative stage until their visit before IPG activation (1 month after the surgery), including anti-Parkinsonian drugs, neuroleptic, and anti-depressant drugs. The dosage of drug intake will be calculated and compared by levodopa equivalent daily dose (LEDD) and component 6 in PSQI (PSQI-6, use of sleeping medication).21,22
Motor function was evaluated using the subscores of the Unified Parkinson’s Disease Rating Scale-III (sUPDRS-III), including rigidity/bradykinesia, tremor, and gait.
Emotional and neuropsychological assessments were completed using the Hamilton Anxiety Rating Scale (HAMA) and the Hamilton Rating Scale for Depression (HAMD).
Cognitive abilities were assessed according to the Mini–Mental State Examination (MMSE). 23
Surgical procedures and programming
The surgical procedure was described in detail in previous reports of studies conducted in our center.18,24,25 DBS electrode (model 3389, Medtronic, Minneapolis, USA, or model L301, Pins Medical, China; both electrodes share the same parameters) implantations were performed under local anesthesia, using a Leksell stereotactic system (Elekta Instrument AB, Stockholm, Sweden). Electrodes were then connected to an IPG which was implanted in the subclavicular area under general anesthesia. One month after the operation, the IPG was turned on and programmed. To clarify the effect of pure MLE, all the patients did not receive any preceding STN-DBS stimulation in 1 month after the surgery, and all the clinical assessments were completed before the IPG activation. DBS was activated within the range of 1.5–2.0 V as standard parameters. 26 The contacts on each electrode were tested, and the best stimulation parameters were selected when the patient achieved satisfactory improvement with minimal side effects.
DBS electrode localization
The electrode localization was conducted using Lead-DBS version 2.5, a MATLAB-based toolbox implemented within MATLAB 2020b software (MathWorks, Natick, MA, USA).26,27 Preoperative MRI images were obtained using a 3-Tesla MRI scanner (SIGNA; GE Healthcare, Waukesha, WI, USA) to acquire 3D-T1-weighted (slice thickness: 1 mm, repetition time: 9.4 ms, echo time: 4.3 ms, spacing between slices: 0). Postoperative CT scans (slice thickness: 0.625 mm) were obtained for reconstruction. Preoperative MRI and postoperative CT images were co-registered using advanced normalization tools and nonlinearly normalized in the Montreal Neurological Institute (MNI) standard space (MNI_ICBM_2009b_NLIN_Asym). 28 The DBS electrodes were automatically reconstructed according to the TRAC/CORE algorithm and manually refined to evaluate their coordinates in the MNI space. 26 The positional relationships between the electrode, STN, and its subregions were assessed using the DISTAL atlas, which is a composite atlas based on structural connectivity, histology, and manual segmentations of a multimodal brain template normalized in the MNI space. 29
Creation of presumed MLE and volume of tissue lesioned calculations
We assumed that the microlesion would form around the electrode trajectories. To simulate this MLE area, we adopted an approach similar to what Morishita et al. 30 have done before. A cylinder region of interest (ROI) surrounding the electrode contacts with a radius of 2 mm, 31 and length of 10 mm (with 1.5 mm of each of four contacts and 0.5 mm of each of three contact spacing, and the utmost distance voxel involved in MLE is 2 mm from the center of each contact, making it 1.25 mm from the contact margin) was constructed using the finite-element method embedded in Lead-DBS. 32 In cases where the predefined contact-surrounded MLE region cannot fully cover the vertical axis of the STN, we adjusted the cylinder ROI along the electrode trajectory (i.e. the trajectory-surrounded MLE region) to make it has a maximized overlap with STN.
Correlation analysis
To understand the correlative relationship between sleep outcomes and motor, emotions and LEDD, Spearman correlation analysis was conducted between sleeping scales (e.g.,
To examine the effect of DBS electrode localization and its laterality, we calculated the respective volume of tissue lesioned (VTL) of each side of every STN functional subregion (sensorimotor, associative, and limbic) in the Lead-DBS.
33
Subsequently, the VTL of each functional subregion (sVTL) was weighted according to the corresponding laterality of the motor symptoms. Details of calculating sVTL are elaborated in Supplementary Material 1. Spearman correlation analysis was performed between the difference values of the sleeping scales (e.g.,
Ordinary least squares regression (OLS) is a statistical method to estimate coefficients of linear regression equations which describe the relationship between one or more independent quantitative variables and a dependent variable. In this study, to eliminate the potential impact of related factors, stepwise OLS and Bonferroni correction was conducted using sleeping scores and difference values of HAMA, HAMD, sUPDRS-III, and other baseline information. P < 0.05 was considered significant.
Sweet spot analysis
We evaluated the sweet/sour spot of the MLE for sleep improvement using Lead-Group analysis. 34 Each voxel of each patient’s VTL was assigned with their corresponding difference value of PSQI. Subsequently, all VTLs of all patients were pooled, and the mean decrease of the PSQI was obtained for each voxel. To identify voxels with a significantly larger decrease above or below the average decrease of the PSQI of all VTLs that did not stimulate a particular voxel, a two-sample t-test was performed. This test yielded a t-statistic for every voxel that was displayed as a 3D statistical map, which we referred to as a sweet/sour spot map. Significant voxels (false discovery rate correction, P < 0.05) were visualized on sweet spot maps of either sleep improvement or sleep deterioration. Only those voxels that were at least covered by n = 10 VTLs were regarded as significant in this analysis.
Statistical analysis
All scores were presented as the median ± standard deviation (SD). Shapiro–Wilk’s tests and Wilcoxon signed-rank tests were conducted to check the normality and compare the preoperative and postoperative scales, including PDSS-2, PSQI, sUPDRS-III, HAMA, HAMD, LEDD, and RBD screening questionnaire. Spearman correlation was performed to identify the relationship of sleep (PDSS-2, PSQI) with motor functions (sUPDRS-III), medication (LEDD), and emotion (HAMD, HAMA). Statistical analyses and graphical visualizations were carried out using Python version 3.7. P < 0.05 was considered significant.
Results
Baseline characteristics and clinical outcomes
A total of 78 PD patients with a mean age of 61.8 ± 8.6 years (42 males and 36 females), mean disease duration of 9.3 ± 3.8 years, and preoperative baseline LEDD of 841.5 ± 389.5 mg/day that were in accordance with all inclusion and exclusive criteria were analyzed. Table 1 demonstrates the comparisons at preoperative baseline and 1-month follow-ups. Patients had gone through significant sleep improvement over the month (PSQI: improvement rate (IR) = 13.36%, P = 0.003; PDSS-2: IR = 17.95%, P < 0.001). Motor functions also improved (sUPDRS-III: P = 0.001; bradykinesia/rigidity: P = 0.007; tremor: P = 0.049; gait: P = 0.009). Both HAMA and HAMD showed significant improvement in neuropsychological evaluations (HAMA: P < 0.001; HAMD: P < 0.001). The overall RBD also showed improvements (IR = 13.13%, P = 0.030). Neither LEDD nor PSQI-6 showed significant differences in two timepoints which indicate no significant drug changes occurred within the 1 month.
Clinical outcomes of studied population.

HAMA, Hamilton anxiety rating scale; HAMD, Hamilton depression rating scale; LEDD, Levodopa equivalent daily dose; PDSS-2, Parkinson’s disease sleep scale; PSQI, Pittsburgh sleep quality index; SD, standard deviation; UPDRS-III, Unified Parkinson’s disease rating scale-III. Significant differences are bold typed.
The detailed outcomes of PDSS-2 and PSQI domains and components are listed in Supplementary Table 1. PSQI component 1 showed a significant improvement of overall subjective sleep quality (P = 0.002) to reflect the clinical relevance of MLE on sleep outcomes.
Sleep outcomes and related factors
Spearman correlation analysis was conducted between two sleeping scales and sUPDRS-III, HAMA, HAMD, and LEDD. Table 2 shows that the improvement of PDSS-2 and PSQI was positively correlated with the improvement rate of HAMA (PDSS-2, r = 0.374, P < 0.001; PSQI, r = 0.298, P = 0.008) and HAMD (PDSS-2, r = 0.466, P < 0.001; PSQI, r = 0.363, P = 0.001). PSQI also had correlations with improved motor functions (sUPDRS-III: P = 0.014). No significant correlations were found between RBD and PDSS-2 and PSQI difference value. However, no correlations were found between sleep and the LEDD. Supplementary Table 2 further displays the correlations between PDSS-2 domains and the related scales. In short, sleep improvement was positively correlated with motor functions and neuropsychological improvements in PD patients.
Correlations with sleep improvement.

HAMA, Hamilton anxiety rating scale; HAMD, Hamilton depression rating scale; LEDD, Levodpa equivalent daily dose; PDSS-2, Parkinson’s disease sleep scale; PSQI, Pittsburgh sleep quality index; RBD, rapid eye movement sleep behavior disorder screening questionnaire; UPDRS-III, Unified Parkinson’s disease rating scale-III.
All sleeping scales stand for the difference value between baseline and follow-ups; and all non-sleeping scales stand for the improvement rates. Namely
Electrode localization and STN region-specific correlation with sleep outcomes
Figure 2(a) provides an electrodes position overview of all patients enrolled in this study, no electrodes nor their trajectories were deviated from the targeted STN. Despite the fact that our cohort showed sleep improvement in both sleeping scales, and both of which have demonstrated clinical differences, we selected PSQI as an index to reflect patients’ sleep outcome. Since MLE regions were calculated and reweighted according to the motor functions of the contralateral side, the correlation analysis should avoid the influence of motor functions to the greatest extent, while PDSS-2 includes components that rate motor functions including body movement and tremor at night, which may confound the credibility of the correlative relationship. PSQI on the contrary, avoids the influence of possible motor changes, therefore is a better candidate in determining the correlation between the electrode position and sleep outcome.

Visualization of all studied electrodes and sleep outcome–related clusters. (a) Overview of all 156 studied electrodes from 78 enrolled patients. All trajectories neatly passed the STN. (b) Visualization of electrodes of the best group (colored in pink) and the Worst group (colored in blue). (c) For the best group, the electrodes were evenly distributed in STN sensorimotor and associative. (d) For the worst group, the electrodes were mostly concentrated within the STN associative. (e) Two-dimensional reconstruction of electrode in the z = −9.9 plane and z = −9.8 plane for the best (colored in red) and worst groups (colored in blue) to show their relative positional relationships with the STN. (f) Three-dimensional reconstruction showing the average position coordinates of the best (colored in red) and worst groups (colored in blue) at the z = −6 and z = −7 levels, and their relative positional relationships with the STN subregions.
After visualizing all the electrodes, we selected 20 patients who showed the best PSQI scale sleep outcomes (all of whom had improvement in sleep, named as the Best group; PSQI improved by mean ± SD: 6.55 ± 1.61) and another 20 patients who showed the worst PSQI scale sleep outcomes (all of whom had deteriorations in sleep, named as the Worst group; PSQI deteriorated by mean ± SD: 3.75 ± 1.73). It is worth mentioning that both groups showed significant differences in PDSS-2 scale as well. Although no differences were found at baseline between two groups (P = 0.221), both groups showed sleep qualities improvements in PDSS-2 total scores (by mean ± SD, the Best group: 9.10 ± 11.13, P < 0.001; the Worst group: 0.55 ± 12.08, P = 0.021) and all its components (all P < 0.001). Furthermore, two groups also demonstrated significant sleep improvement differences in PDSS-2 total score (P < 0.001) and all its components (all P < 0.001). Supplementary Tables 3–5 show the comparison of these two groups at baseline and follow-ups, and their respective clinical outcomes.
Figure 2(b)–(d) gives an overview of these 40 patients’ electrode positions. The Worst group (blue cluster) located more anterior, closing to the STN associative, while the Best group (pink cluster) located more posterior, closing to the STN sensorimotor. Figure 2(e) and (f) showed the position of the Best (red) and the Worst (blue) group at different vertical depths. A trend was observed after quantified coordinate comparison, that the Best group located more posterior to the Worst group on both sides at the level of Z = –6 (Best vs Worst of Y coordinates in left STN: –12.4 ± 1.67 vs −11.7 ± 0.88, P = 0.062; Best vs Worst of Y coordinates in right STN: –12.3 ± 1.30 vs −11.7 ± 0.77, P = 0.073).
Previous studies have demonstrated that the placement of electrodes in different STN subregions may lead to different sleep efficacies.6,12 In our study, correlation analyses were conducted between weighted sVTLs and difference values of sleeping scales. The only significant correlation was observed between weighted sVTLs in the STN associative and the PSQI sleep deterioration (r = 0.348, P = 0.002) as is shown in Figure 3(d). To validate this finding, we tested Spearman correlation between the difference value of sUPDRS-III rigidity/bradykinesia and sVTLs in STN sensorimotor (r = 0.236, P = 0.037), which indicates that electrode placement within STN sensorimotor may yield motor enhancement and previous study have substantiated this result. 35

Correlation diagrams between the VTL in STN subregions and the PSQI and PDSS-2 scale difference values. (a) Brown: STN, (b) (c), (d) Orange region: STN sensorimotor subregion; blue region: STN associative subregion; green region: STN limbic subregion, (e) Orange region: STN; red region: red necleus, (f) Red hollow region: STN sensorimotor subregion; blue hollow region: STN associative subregion; green hollow region: STN limbic subregion.
In addition, recent studies reported that different sides of DBS stimulation may yield distinct sleep outcomes in PD patients. Therefore, further studies on the laterality of electrode localization are needed to determine whether this phenomenon applies to the MLE on sleep outcomes.6,36,37
Laterality of electrodes correlates with sleep outcomes
To determine if the laterality of MLE has any connection with sleep efficacy, we performed correlation analysis on both sides. Spearman correlation analysis indicated that only the sVTL in the left STN associative was positively correlated with the PSQI difference value (r = 0.3266, P = 0.0035), while no statistical significance was observed between the right side of the STN and the two sleeping scales. Figure 4(a) and (b) shows the correlative results of the bilateral STN associative and the PSQI difference values.

Unilateral correlative analysis between the VTL in the STN associative and the PSQI difference value. (a, b) Correlation diagrams of the weighted STN associative VTL and the PSQI difference value on both sides, with the left side demonstrating statistical significance. (c) Illustrations of sweet spots (red, represents improvements) and sour spots (blue, represents deteriorations) of electrode positions that may interfere with sleep outcomes. (d, e) Ventral and dorsal views of the left STN. Light blue regions represent sour spots that were the only statistically significant spots after FDR correction. All valid sour spots were located within the STN associative.
Sweet spot analysis was subsequently conducted to confirm this laterality voxel-wise. Figure 4(c) demonstrates the bilateral sweet spots (red region) and sour spots (blue region) of sleep improvement according to the PSQI difference values, while the statistical analysis that passed the false discovery rate (FDR) correction proved that only the VTL on the left STN associative was positively correlated with sleep deterioration (Figure 4(d) and (e)), which confirmed our results on a spatial level.
Regression analysis
To evaluate the independent influence of the MLE in the STN associative on sleep deterioration, OLS regression was performed to eliminate possible interfering factors. Table 3 demonstrates that after the emotional factors (HAMA, HAMD), motor improvements (sUPDRS-III difference value), and other baseline characteristics (age, gender, disease duration, and sUPDRS-III at medication-off condition) were stepwise adjusted via OLS, the weighted sVTLs in STN associative were still strongly positively correlated with the PSQI difference values after Bonferroni correction (P = 0.015).
Correlation between VTL in associative subregion with PSQI difference value after ordinary least squares regression adjustment with Bonferroni correction.

CI, confidence interval; HAMA, Hamilton anxiety rating scale; HAMD, Hamilton depression rating scale; PSQI, Pittsburgh sleep quality index; UPDRS-III, unified Parkinson’s disease rating scale-III; VTL, volume of tissue lesioned. Significant differences are bold typed.
In addition, we performed a supplementary validation to support the credibility of our result. When we appropriately expanded our ROI of VTL to a radius of 2.5 mm and length to 11 mm, all the results corresponded with previous findings and shared the same statistical significance in the correlation of the sVTL in the STN associative and the laterality characteristics of the left side of the STN associative, as well as in regression analysis.
Discussion
By comparing subjective sleep rating measures at baseline and 1-month follow-up before IPG activation and determining the correlative factors of sleep outcomes, this study confirmed the pronounced improvement of the MLE on sleep quality in PD patients and demonstrated that emotional status and motor performances were positively correlated with sleep outcomes. By adopting the VTL to simulate the range of the MLE in a three-dimensional space, this study also concluded that electrode placement within the STN-associative sub-region deteriorates sleep conditions, and further verifications of laterality showed that only the left STN possessed this region-specific property.
Effect of the MLE and long-term stimulative outcomes on sleep in PD patients
It has been confirmed that the MLE can alleviate short-term motor symptoms in PD patients.38–40 It is true that MLE cannot be applied directly in the standard clinical pathway, yet by studying the effect of MLE can we rule out the influence of individualized programming patterns and stimulating duration of STN-DBS, which would elicit distinct responses from affected neurons, thus having a clearer understanding of electrode positions and sleep outcomes. Nevertheless, few studies have reported how the MLE can affect the sleep quality and other nonmotor symptoms of PD patients. In 2014, Merlino et al. 17 studied 15 patients by assessing the impact of the MLE on sleep by examining PDSS, RLS, PSG, and UPDRS-III at preoperative baseline and postoperative follow-up before IPGs were activated. Within the duration of the MLE, patients reported longer total sleep time duration, decreased daytime sleepiness, and improved RLS symptoms. PSG data showed an increase in total sleep time and sleep efficiency with decreases in wakefulness after sleep onset and the arousal index. These results aligned with our own, which showed significant increases in sleep quality, sleep latency, habitual sleep efficiency, daytime dysfunction (PSQI domains), motor symptoms at night, PD symptoms, and disturbed sleep (PDSS sub-items). Although objective PSG data would strengthen the credibility of their results, inadequate subjects and unexplained rationales were its major drawbacks.
As MLE is not applied in standard clinical pathways, its efficacy in PD patients should be further evaluated and compared under the background of pharmacological and long-term stimulation. To understand the clinical significance, it is reported that any improvements larger than −3.44 points or worsening larger than 2.07 points can represent minimal clinically important changes (MCID) for the PD patients.
41
In PSQI, currently no studies have identified the MCID specified to PD, but a study reported the MCID of 4.4 in PSQI may manifest clinical consequences in other diseases.
42
Previous studies that focused on the effect of Carbidopa/Levodopa intestinal gel on sleep in advanced PD patients reported −7.2 of improvement in PDSS-2.
43
However, high-dosage Levodopa intake may lead to worsened nocturnal akinesia, with an increase of 5–10 points in PDSS-2.
44
As far as PSQI is concerned, studies reported STN-DBS improved sleep qualities (rated by PSQI) with −1.4 and −6.0 after 6 months and 26 months of stimulation, respectively.37,45 While in our study, we demonstrated an improvement in sleep quality of −5.27 (
It has been reported that a short-term MLE may be a critical predictor of future long-term stimulative efficacy.39,46 It is universally agreed upon that long-term stimulation can improve sleep quality in PD patients. Previous studies have demonstrated subjective improvements and benefits in the overall sleep quality, that is, continuous sleep time, sleep efficiency, and reduced wakefulness after sleep onset up to 2 years after the surgery14,47–50 Objective means were later utilized to observe sleep patterns in PD patients after 6 months of stimulation by STN-DBS, and PSG reflected an increase in sleep efficiency, total sleep time, and total slow wave sleep. Actigraphy recordings revealed longer bedtimes without a shift in the circadian timing. 6
A meta-analysis completed in 2021 from our center included PSG as an objective parameter, as well as the four subjective scales PDSS, PSQI, ESS, and restless legs syndrome (RLS), and compared outcomes from <12-month and ⩾12-month follow-ups. We concluded that STN-DBS significantly improved all four subjective sleep scales at the 6-month follow-up, although PSG parameters remained unchanged, except for shortened REM sleep latency. 8 Based on our previous findings, STN-DBS did not alter the PSG parameters, including sleep efficiency and sleep architecture. 51
Factors correlated with sleep improvement
Merlino et al. 17 reported no significant correlations between motor performances and sleep feature modifications. Unfortunately, no specific data were presented in the article. Based on the study they conducted, we deduced that this could be partially due to the small cohort (15 PD patients), and their follow-ups were completed a week after the surgery at a time when patients may not have regained full motor function. In addition, their study adopted the UPDRS-III total score as the scale in evaluating the motor performances, which included a considerable number of axial symptoms such as postural stability and balance, and this may have weakened the efficacy of the MLE as it mostly alleviated appendicular symptoms. However, in our study, we demonstrated positive correlations between sleep improvement and motor enhancement, and we assumed that improved motor functions could enable swift mobility and turning over during sleep, and increased daytime activities could also enhance sleep quality.
In addition, we demonstrated positive correlations between better sleep outcomes and emotional improvement (HAMA, HAMD) in the MLE. Among all the scales measured, we discovered that the emotional status manifested the strongest correlation with sleep improvement. Several studies have reported that anxiety and depression were significantly correlated with sleep disturbances, and sleep disorders can reversely instigate or further exacerbate emotional conditions.52,53 Although no study has investigated how emotions and sleep quality interact during the MLE, in our study, it could be readily extrapolated that alleviated anxiety and depression, as well as steady and optimistic emotions, resulted in better subjective sleep ratings. It remains unknown whether better emotional status is correlated with objective sleep measures and whether it can influence the sleep architecture, which should be the focus of future studies.
No study has investigated how the LEDD can affect sleep during the MLE. In our study, we observed no relevance between the LEDD and sleep outcomes. Several reasons can be attributed to this result. First, the LEDD that was calculated in this study was the equivalent dosage of a combination of anti-Parkinsonian drugs. However, different drugs may have different side effects on sleep. For instance, amantadine and selegiline can cause RBD and nighttime waking, and large dosages of levodopa may cause sleep disturbances.54,55 Second, we seldomly recommend that patients in our center drastically reduce drug dosages, except when they experience strong MLE-induced side effects such as dyskinesia within the first three months of the procedure. Therefore, we did not observe a significant LEDD reduction between baseline and follow-up, and no significant correlations were detected between drug dosage and sleep improvement.
RBD is an REM parasomnia characterized by the loss of normal skeletal muscle atonia during the REM stage with prominent motor activity and frightening dreaming, more than 60% of PD patients especially at the advanced stages have RBD.56,57 RBD in PD relates to daytime sleepiness and sleep disturbances (including the presence of other parasomnias), cognitive changes, and psychiatric manifestations. 58 It is also been discovered that the pathological switching and imbalance between the inhibitory and excitatory sleep circuits, which are mainly responsible for episodic sleep disturbances, are particularly found in RBD. 59 Both PDSS-2 and PSQI include questions that reflect RBD, and we found there was a significant improvement of RBD during MLE in our study, thus RBD changes may contribute to the overall improvement of sleep quality. However, no correlations was detected in RBD and two sleeping scales, given that it is commonly agreed that STN-DBS does not improve RBD in PD, we express reservations that RBD contributes to the overall sleep improvement.60,61
Pathological sleep circuit in PD and the possible effect of MLE on sleep pathophysiology
According to PSG, sleep stages can be categorized into Non-rapid eye movement (NREM) sleep and REM sleep. NREM is typified by low-frequency (0.5–4 Hz), high-amplitude delta oscillations on the electroencephalograph (EEG), low muscular activity, and no eye movement. 62 It is driven by slow-wave sleep-promoting neurons in the ventrolateral preoptic nucleus (VLPO) and the median preoptic nucleus (MnPn). 63 A hypothesis of NREM sleep circuit is during wakefulness VLPO/MnPn GABAergic neurons are inhibited by cholinergic and noradrenergic arousal circuits. At sleep onset, these neurons respond to excitatory inputs, causing sleep onset and slow wave sleep sustainability. 64 REM sleep is domineered by theta (6–9 Hz) and gamma (30–300 Hz) rhythms similar to waking stage EEG, but with complete disappearance of postural muscle tone and occurrence of muscle twitches. 62 REM is activated by magnocellularis nucleus and subceruleus nucleus in the brainstem, REM sleep circuit involves disinhibiting ascending glutamatergic neurons to generate cortical activation via projections to thalamic relay neurons. And descending glutamatergic neurons induce the muscle atonia seen in REM sleep by excitatory projections to GABA and glycinergic pre-motoneurons located in the medulla. 65
PD pathology affects several brainstem structures and neurotransmitters in relation to sleep regulation. 66 Neuronal loss in arousal systems, including the noradrenergic locus ceruleus, the serotonergic raphe, the cholinergic pedunculopontine nucleus (PPN), and the orexin neurons in the hypothalamus, is observed in the PD brain. 1 The STN is located at the diencephalo-mesencephalic junction, posterolateral to the hypothalamus and medial to the substantia nigra and red nucleus; thus, it is not far from wake-promoting midbrain areas.67,68
STN-DBS, as proved by a considerable number of studies, is an effective approach to addressing SWD in PD. Although the specific role of STN in sleep regulation is still unclear, animal studies proposed that the PPN strongly regulates the neuronal activity of the STN by excitatory cholinergic projections, which may provide a hint of STN in processing information during the REM sleep. 69 What’s more, another study evaluated the MLE of STN-DBS lead placement along with fMRI and concluded a general increase in activity throughout the brainstem, even though no specific nuclei were identified. 70
Sweet spot analysis did not show any sweet spot in sleep improvement. Instead, partial regions in the associative sub-region were identified as sour spots which may deteriorate sleep conditions. Consistent with our results, one study confirmed that the increase in sleep efficiency was linked to the location of the active electrode pole which was more distant from the ventral margin of the STN, that is, localizing the active contact in the ventral margin of the STN, that is, the associative sub-region, may deteriorate sleep efficiency. 6 As reported by Benarroch, 65 the associative territory of the STN receives input from the dorsolateral prefrontal cortex and frontal eye fields and projects to the substantia nigra reticulata, which is involved in oculomotor control and cognitive aspects of motor behavior. There could be, in our point of view, an unwanted MLE or long-term stimulation in the associative sub-region that triggers oculomotor movement, causing increased eye movement and RBD that negatively affect sleep quality. Further studies should pay greater attention to RBD issues and REM architecture to verify this hypothesis.
Unexpected stimulation in the associative sub-region may cause other problems as well. Coenen et al. 66 assumed that inadvertent STN-DBS in this region may induce reversible acute hypomania. 71 Mirthful laughter was also reported by stimulating the associative sub-region. In addition, there were higher rates of suicide and psychotic episodes while placing the electrodes in associative territories.73,74
However, our results did not agree with those of all studies in the literature. Petry-Schmelzer et al. 12 profiled probabilistic stimulation maps and arrived at an opposite conclusion, that is, optimized contact positions located within the ventral STN can lead to the best sleep improvements. These results were consistent with those of another study the same team conducted, and they reached similar conclusions that non-motor symptoms and living quality improvements significantly depend on more medial and ventral contact stimulation.
Laterality of the MLE, STN-DBS, and sleep outcomes
A plethora of studies has pointed out preferable laterality regarding the alleviation of sleep deficiency in PD patients.6,37,70 Our results also revealed this unique asymmetry, that is, electrode placement within the left STN associative sub-region was correlated with worse sleep outcomes as evaluated by PSQI. As previously mentioned, localizing the active contact within the ventral margin of the STN may worsen sleep efficiency which was also valid on the left side of the STN. In addressing this asymmetry, Baumann-Vogel et al. 6 conjectured that there was no preferred laterality in determining sleep outcomes, although there may be right/left symmetry in the synaptic inputs to the STN and right/left asymmetry in their output. However, with respect to asymmetry, the findings of Baumann-Vogel et al. 6 and those of this study should not be regarded as a pure coincidence, as the patients in our cohort did not undergo stimulation and yet still showed an inclination on the left STN. A plausible hypothesis is that of all the patients in our study, their average left side VTL was weighted with higher motor scores, thus causing a significant overlap with the associative sub-region. It has been reported that the dominant side of symptoms agrees with handedness, thus patients in other studies may receive stronger stimulative currents on their left STN.
Other studies have also reported specialized laterality with regards to non-motor symptoms in PD and STN-DBS efficacy. It has been suggested that the symptomatic onset of PD on the left side of the body associates with more nocturnal hallucinations and daytime sleepiness than those with right side body symptom onset, despite no differences in the sleep architecture according to PSG. 71 Another study that compared non-motor symptoms in patients with right-versus left-sided body symptom onset found no difference in sleep quality between the two groups. 72 Amara et al. 75 evaluated unilateral STN-DBS in PD patients and discovered those who underwent right STN-DBS (those with worse left-sided motor symptoms) had more improvement in subjective sleep quality over 6 months than patients who underwent left STN-DBS.
However, there is little evidence of preferable laterality when it comes to sleep deficiency improvements. Expanding the inclusion of study subjects and elevating the level of evidence will be the next steps of our research.
Our study has several limitations. First, despite our greatest effort in eliminating confounding factors, such as stimulation parameters and disease progression, we still could not preclude the placebo effect and other subjective proclivities. Further studies should include objective measures such as PSG and actigraphy. Second, our novel approach of quantifying the MLE within the STN, and its sub-regions corroborated others and our conclusions. However, additional validations should be performed to justify its wide range of viability. Finally, as sleep quality is a detrimental indicator of long-term quality of life, the data collected in this study aimed to study the short-term (1 month) sleep outcomes of PD patients. Long-term follow-ups should continue to track all included subjects and evaluate the prognostic value of the MLE.
In conclusion, the results presented in this study revealed that the MLE could improve sleep quality in PD patients, and motor functions and emotional status were involved in sleep improvements. However, independent of these two factors and all other baseline characteristics, the MLE in the associative sub-region, particularly the left side STN, may result in worsened sleep outcomes. These findings provide a rationale for the preoperative assessment of sleep conditions and other non-motor symptoms to adjust patients’ expectations, offer surgical guidance in electrode placement according to individual clinical profiles. More importantly, this study may provide research directions in investigating the underlying mechanism and influence of STN-DBS on sleep circuits in PD patients.
Supplemental Material
sj-docx-1-tan-10.1177_17562864231161163 – Supplemental material for Sleep outcomes and related factors in Parkinson’s disease after subthalamic deep brain electrode implantation: a retrospective cohort study
Supplemental material, sj-docx-1-tan-10.1177_17562864231161163 for Sleep outcomes and related factors in Parkinson’s disease after subthalamic deep brain electrode implantation: a retrospective cohort study by Ruoyu Ma, Zixiao Yin, Yingchuan Chen, Tianshuo Yuan, Qi An, Yifei Gan, Yichen Xu, Yin Jiang, Tingting Du, Anchao Yang, Fangang Meng, Guanyu Zhu and Jianguo Zhang in Therapeutic Advances in Neurological Disorders
Footnotes
References
Supplementary Material
Please find the following supplemental material available below.
For Open Access articles published under a Creative Commons License, all supplemental material carries the same license as the article it is associated with.
For non-Open Access articles published, all supplemental material carries a non-exclusive license, and permission requests for re-use of supplemental material or any part of supplemental material shall be sent directly to the copyright owner as specified in the copyright notice associated with the article.