
Abstract
Background:
Rapid recognition of acute stroke and large vessel occlusion (LVO) is essential in prehospital triage for timely reperfusion treatment.
Objective:
This study aimed to develop and validate a new screening tool for both stroke and LVO in an urban Chinese population.
Methods:
This study included patients with suspected stroke who were transferred to our hospital by emergency medical services between July 2017 and June 2021. The population was randomly partitioned into training (70%) and validation (30%) groups. The Staring-Hypertension-atrIal fibrillation-sPeech-weakneSs (SHIPS) scale, consisting of both clinical and medical history information, was generated based on multivariate logistic models. The predictive ability of the SHIPS scale was evaluated and compared with other scales using receiver operating characteristic (ROC) curve comparison analysis.
Results:
A total of 400 patients were included in this analysis. In the training group (n = 280), the SHIPS scale showed a sensitivity of 90.4% and specificity of 60.8% in predicting stroke and a sensitivity of 75% and specificity of 61.5% in predicting LVO. In the validation group (n = 120), the SHIPS scale was not inferior to Stroke 1-2-0 (p = 0.301) in predicting stroke and was significantly better than the Cincinnati Stroke Triage Assessment Tool (C-STAT; formerly CPSSS) and the Prehospital Acute Stroke Severity scale (PASS) (all p < 0.05) in predicting LVO. In addition, including medical history in the scale was significantly better than using symptoms alone in detecting stroke (training group, 0.853 versus 0.818; validation group, 0.814 versus 0.764) and LVO (training group, 0.748 versus 0.722; validation group, 0.825 versus 0.778).
Conclusion:
The SHIPS scale may serve as a superior screening tool for stroke and LVO identification in prehospital triage. Including medical history in the SHIPS scale improves the predictive value compared with clinical symptoms alone.
Introduction
Stroke was the leading cause of disability-adjusted life years (DALYs) in 2017 and ranked third among the leading causes of death in China. 1 Ischemic stroke accounts for 79.1% of all strokes in China. 2 As stroke is a time-dependent disease, the benefit of treatment is highly influenced by the rapid recognition of stroke, especially for those with a large vessel occlusion (LVO).
Many stroke screening tools, that is, the FAST scale (Face-Arm-Speech-Time, which is equivalent to Stroke 1-2-0 test in China),3,4 are derived from the National Institute of Health Stroke Scale (NIHSS). When the NIHSS score ⩾ 6, LVO is suspected. 5 Therefore, the degree of neurological deficits shown on the NIHSS can reflect both the diagnosis and the severity of stroke. However, these stroke-screening tools have obvious limitations in clinical practice mainly due to two problems. First, there are no reliable tools applied that screen for both stroke and LVO simultaneously during prehospital triage stage. As a result, emergency medicine services (EMS) paramedics use separate scales to detect stroke and LVO during prehospital triage. This increases the burden and complexity of their training and daily work. Second, there are still disputes about which items in the NIHSS are suitable to construct a quality prehospital prediction scale.6,7 Although existing screening scales have become increasingly simplified for ease of application, this may sacrifice the sensitivity or specificity of detection. Furthermore, EMS paramedics could utilize information such as medical history to aid in detection of stroke and LVO; however, whether medical history can improve the detection of stroke and LVO is currently unknown.
This study aimed to develop and validate a scale for predicting both stroke and LVO at the prehospital triage stage in an urban, Chinese population. We hypothesized that adding medical history would improve a scale’s predictive value compared with using clinical symptoms alone.
Materials and methods
Study design and population
This was a retrospective single-center observational cohort study. We retrospectively reviewed data that we prospectively collected between July 2017 and June 2021 on Hangzhou residents with suspected stroke who were transferred to our center by EMS. Our center is located in Hangzhou City, a densely populated city with population of 103.6 million in Southeast China. Our center is a comprehensive stroke center (CSC) that accepts patients within a 10 km radius and provides reperfusion treatment, including intravenous thrombolysis and endovascular therapy for approximately 300 patients with acute ischemic stroke per year.
Data collection
An acute stroke code was initiated by EMS for patients whose symptoms met Stroke 1-2-0 criteria (1, a drooped face; 2, two asymmetrically lifted arms; 0 presence of slurred speech) and began within the last 24 h. 4
Before hospital arrival, ambulance paramedics sent a stroke code and an electronic record containing demographic characteristics, clinical symptoms, and medical history via a program connected to our stroke team’s mobile phone. The patients’ in-hospital data, including demographic characteristics (age, sex), NIHSS score, medical history, in-hospital treatment (thrombolysis, thrombectomy, and medication), vascular imaging, and final diagnosis, were retrieved from the electronic medical record system. Of note, in medical history, hypertension refers to those who had a clear history of hypertension and those whose SBP > 180 mmHg or DBP > 100 mmHg measured during prehospital triage, 8 and atrial fibrillation refers to those who had a clear history of atrial fibrillation and those who were found of atrial fibrillation electrocardiogram monitor during transfer. According to the NIHSS score, limb weakness was categorized into mild weakness (NIHSS score 1 or 2) and severe weakness (NIHSS score 3 or 4). All data were coupled and encoded to ensure data safety, and accessible to the investigators only.
Outcome assessment
Identification of LVO and the occluded artery was determined based on cerebral vascular examination, including magnetic resonance or computed tomographic angiography (MRA/CTA) and digital subtraction angiography (DSA). LVO was defined as any occlusion of the internal carotid artery (ICA), M1 or M2 segment of the middle cerebral artery (MCA-M1/M2), P1 segment of the posterior cerebral artery (PCA-P1), or basilar artery (BA). The lesioned artery was determined when the occluded artery was consistent with neurological deficit and infarct location (SZ, with 10 years of experience in stroke management, made the outcome assessments).
Design and validation of the scale
The patients were randomly partitioned into training (70%) and validation (30%) groups. First, according to prospectively collected data, we tested symptoms in predicting stroke and LVO in the training group. Second, based on the multivariate regression results, we integrated all items with a p < 0.05 and designed a scale with these items based on their B values. In addition, we compared the predictive performance between the scale determined using both medical history and clinical symptoms and the scale determined using only clinical symptoms. Finally, we validated the scale in the validation group and compared its accuracy with three other published scales.
Included stroke scales
In this study, we evaluated the performance of three published scales. The Stroke 1-2-0 test (equivalent to the FAST score) was used for stroke recognition. The Cincinnati Stroke Triage Assessment Tool (C-STAT; formerly CPSSS) 9 and the Prehospital Acute Stroke Severity scale (PASS) 7 were used to predict LVO. Two independent reviewers (YS and ZZ) used clinical information electronically recorded by an emergency physician and neurologist at the time of consultation to score patients on these three scales. Only clinical information available prior to treatment was used. The raters were blinded to the final diagnosis.
Statistical analysis
Statistical analyses were conducted using SPSS (version 22.0; IBM Corp., Armonk, NY, USA). The cohort was randomly divided into the training and validation groups. Of the cohort, 70% was used to develop the prediction model and 30% to validate the model.
All numeric variables are expressed as mean ± standard deviation (SD) or median [interquartile range (IQR)]. Categorical variables are presented as frequencies (percentages). Chi-square tests or Fisher’s exact tests were used to compare dichotomous variables between groups, while the Mann–Whitney U test was used for ordered categorical variables. The independent-samples two-tailed t test or Mann–Whitney U test was used for continuous variables depending on the normality of the distribution. Variables identified by univariate analysis (p < 0.05) were included in the multivariate regression model. All analyses were performed blinded to the participants’ identifying information. To calculate risk scores, each regression coefficient of variables with p < 0.05 was obtained based on the multivariate regression model.
Receiver operating characteristic (ROC) analysis was performed to assess the performance of the baseline characteristics of interest in predicting midline shift. The sensitivity and specificity were identified at the level that maximized the Youden value. ROC curves were compared using MedCalc statistical software version 15 (MedCalc Software, Mariakerke, Belgium). Statistical significance was set at p < 0.05.
Results
Overall characteristics
From July 2017 to June 2021, 400 patients with suspected stroke were transferred to our center by EMS (Figure 1). Median transfer distance for all patients was 3.85 (2.70–5.60) km and median transfer time was 37 (23–49) min. Of the 400 patients, 215 (53.8%) arrived at our hospital during working hours (8:00 a.m.–5:00 p.m.), 116 (29%) before midnight (5:00 p.m.–12:00 p.m.), and 69 (17.2%) after midnight (0:00 a.m.–8:00 a.m.). Based on discharge diagnoses, 318 (79.5%) patients were finally diagnosed with stroke, including 250 (78.6%) with ischemic stroke and 82 (20.5%) with stroke mimics (Supplementary Figure 1). Of the 250 patients with ischemic stroke, 127 (50.8%) were admitted within 4 h of onset and 119 (47.6%) had large artery occlusion. Seventy (28.0%) patients received intravenous thrombolysis and 46 (18.4%) received endovascular therapy (Supplementary Table 1).

Flowchart of patient recruitment.
Random assignment
The clinical characteristics between the patients in the training (n = 280, 70%) and those in the validation (n = 120, 30%) group showed no significant differences (Supplementary Table 1).
Development of the SHIPS scale
In regard to previous medical history in the training group (n = 280), patients with stroke had a higher rate of hypertension (85.2% versus 58.8%, p < 0.001) and atrial fibrillation (32.3% versus 9.8%, p = 0.001), but a lower rate of diabetes mellitus (26.6% versus 43.1%, p = 0.020) and tumor history (10.0% versus 21.6%, p = 0.023) than stroke-mimicking patients. With regard to clinical symptoms, patients with stroke were more likely to show gaze deviation (33.6% versus 3.9%, p < 0.001), limb weakness (79.0% versus 33.3%, p < 0.001), and abnormal speech (including aphasia and dysarthria) (55.5% versus 25.5%, p < 0.001) and less likely to have confusion (16.6% versus 31.4%, p = 0.016) than stroke-mimicking patients (Supplementary Table 2).
Multivariate logistic regression analysis showed that limb weakness, confusion, gaze deviation (staring), abnormal speech, hypertension, diabetes, tumor, and atrial fibrillation were independent factors associated with stroke (all p < 0.05) (Table 1). Because diabetes mellitus, tumor, and confusion showed negative values, they were not used in the Staring-Hypertension-atrIal fibrillation-sPeech-weakneSs (SHIPS) scale created. The remaining factors that were positively associated with stroke were used to construct a composite scale according to their B values (integer values) as follows: SHIPS scale = 2 × staring (1 if present, 0 if absent) + weakness (0 if absent, 2 if an NIHSS score of 1 or 2, 3 if an NIHSS score of 3 or 4) + 2× abnormal speech (1 if present, 0 if absent) + 1 × hypertension (1 if yes, 0 if no) + 1× atrial fibrillation (1 if yes, 0 if no) (Table 2).
Multivariable logistic regression model in the training group (n = 280).
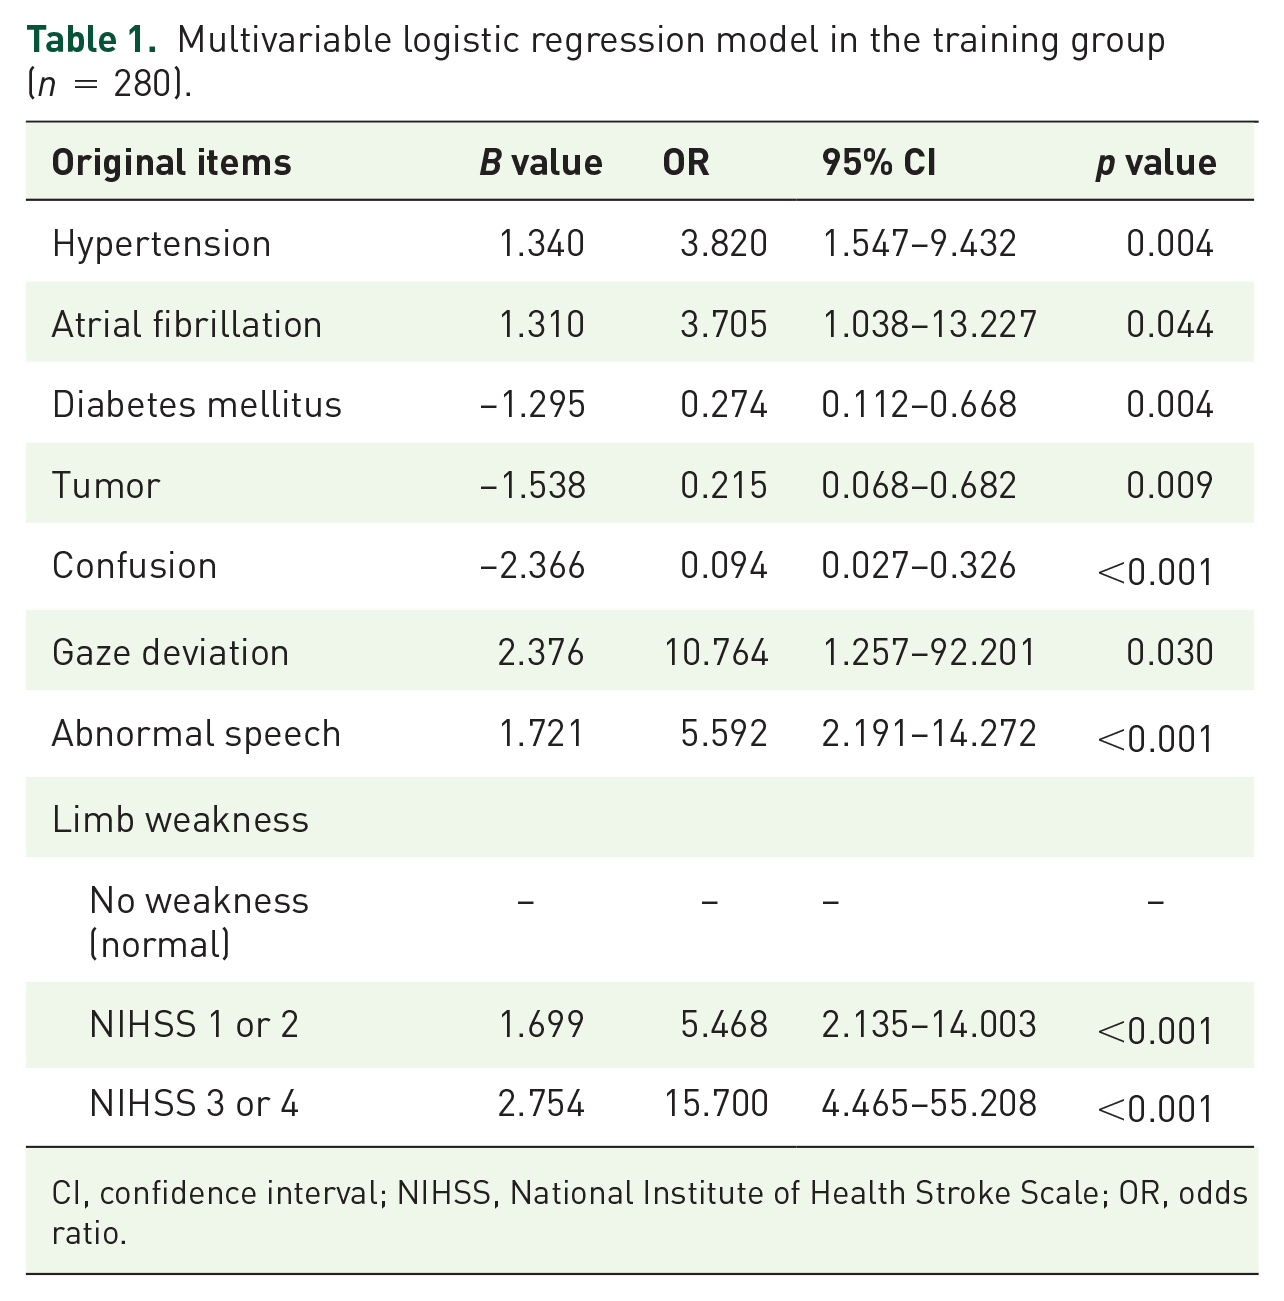
CI, confidence interval; NIHSS, National Institute of Health Stroke Scale; OR, odds ratio.
Items and score assignments in the SHIPS scale.
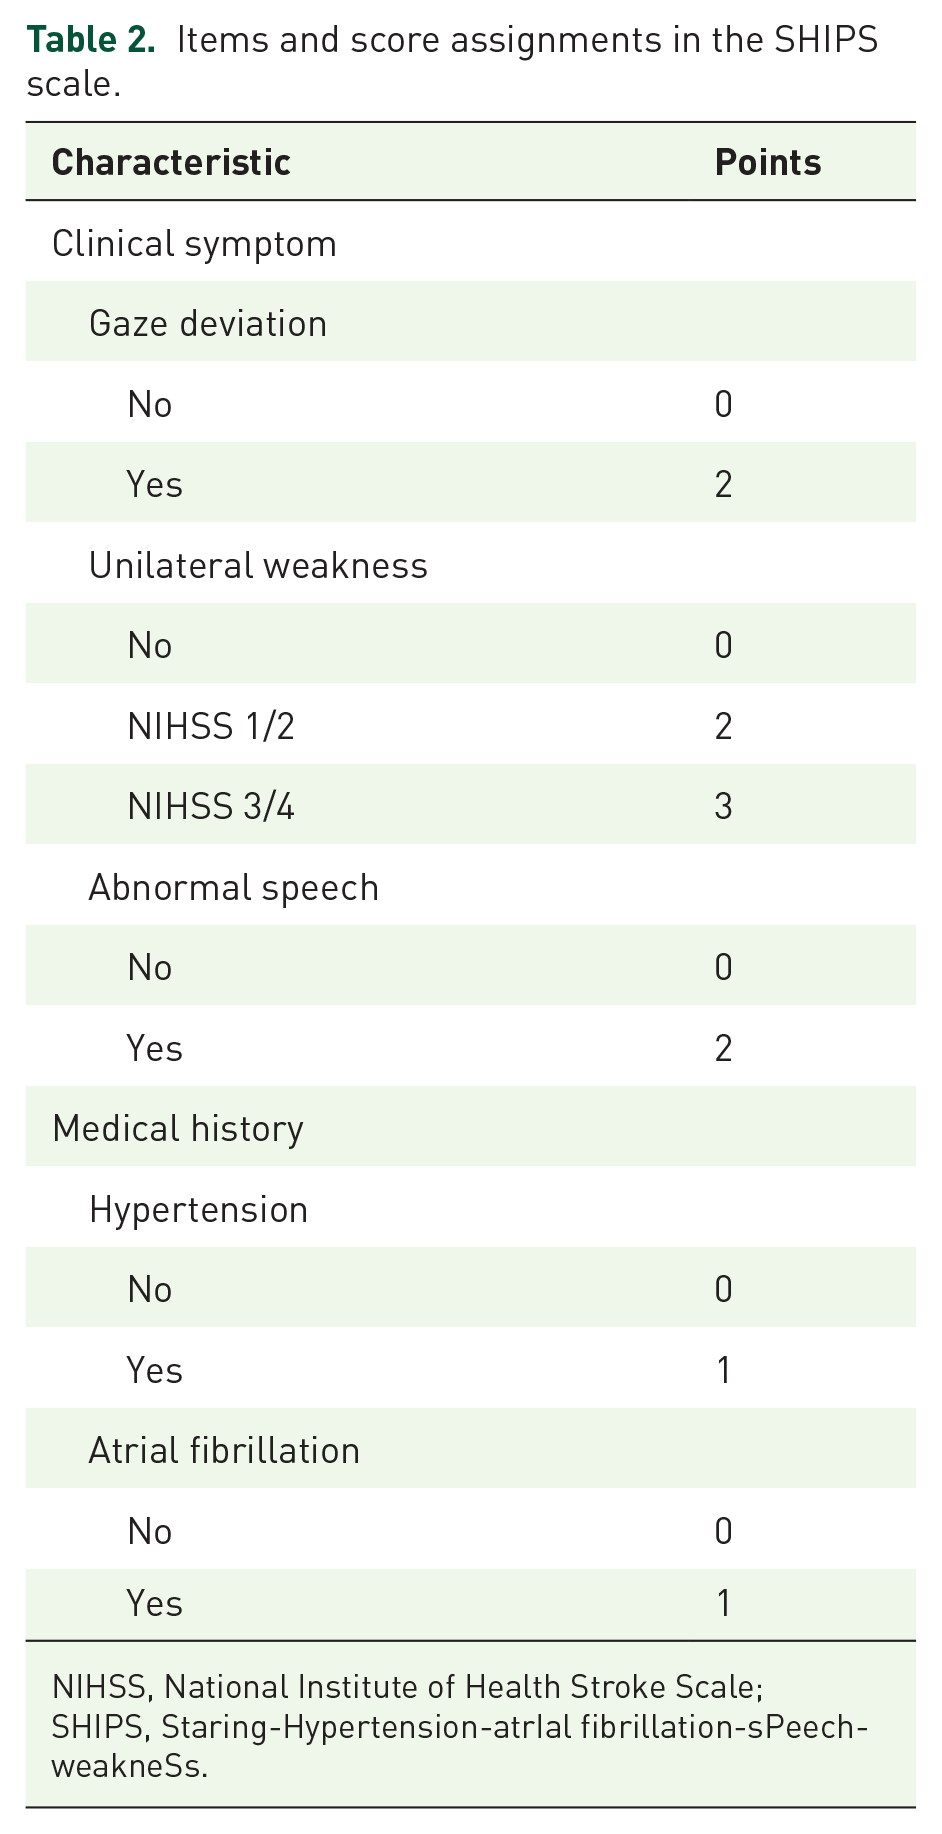
NIHSS, National Institute of Health Stroke Scale; SHIPS, Staring-Hypertension-atrIal fibrillation-sPeech-weakneSs.
Comparisons of the predictive value for detecting stroke and LVO
In detecting stroke, using a cutoff SHIPS score of 3 showed a sensitivity of 90.4% and a specificity of 60.8%. Comparisons of ROC curves showed that the area under the curve (AUC) of the SHIPS scale were superior to those of the Stroke 1-2-0 (0.853 versus 0.774, z = 2.851, p = 0.004).
Spearman analysis showed that the SHIPS scale score closely associated with the detection rate of LVO (ρ = 0.403, p < 0.001). Furthermore, we performed the ROC analysis of SHIPS scale in predicting LVO. ROC analysis showed that when using a cutoff score of 6, the SHIPS scale had a sensitivity of 75% and specificity of 61.5%. ROC comparisons showed that the AUC of the SHIPS scale was significantly superior to that of the CPSSS (0.748 versus 0.696, z = 2.553, p = 0.011) and the PASS (0.748 versus 0.662, z = 4.747, p < 0.001).
Screening value of medical history and clinical symptom items on the SHIPS scale
In our analysis, the more items that the patient met on the SHIPS the higher the detection rate of stroke (ρ = 0.477, p < 0.001) and LVO (ρ = 0.403, p < 0.001). As the SHIPS scale was composed of medical history and clinical symptom items, we further analyzed the effect of these two items on detecting stroke and LVO in our training group.
Spearman analysis showed that the presence of clinical symptoms was associated with a medical history on the SHIPS scale (ρ = 0.312, p = 0.001). ROC analysis showed that medical history and clinical symptoms on the SHIPS scale were able to predict the presence of stroke and LVO (all p < 0.001), but they did not show better predictive value than Stroke 1-2-0 test, CPSSS, or PASS (all p > 0.05). Compared with using only clinical symptoms, the SHIPS scale was more beneficial in predicting stroke (AUC: 0.853 versus 0.818, z = 2.520, p = 0.012) and LVO (AUC: 0.748 versus 0.722, z = 2.129, p = 0.033) by adding medical history to the scale (Table 3).
Comparisons between scales in predicting stroke and LVO in the training group (n = 280).

AUC, area under the curve; CI, confidence interval; CPSSS, Cincinnati Stroke Triage Assessment Tool; LR, likelihood ratio; LVO, large vessel occlusion; PASS, Prehospital Acute Stroke Severity scale; SHIPS, Staring-Hypertension-atrIal fibrillation-sPeech-weakneSs; Stroke 1-2-0 test, equivalent to the FAST (Face-Arm-Speech-Time) test.
Stratifying patients according to cutoff values
According to the cutoffs for detecting stroke and LVO, we divided patients into three groups: low stroke risk (scored <3), high stroke but low LVO risk (scored 3–5), and high LVO risk (scored 6–9). The distribution of stroke and LVO in each group is shown in Figure 2. In patients who scored <3, 41.5% (22/53) of strokes and only 7.5% (4/53) of LVOs were identified. When patients scored ⩾ 3, 91.2% (207/227) of strokes (including 80.6% posterior circulation stroke) and 95.5% (84/88) of LVOs were identified. Moreover, when patients with scores of 3–5 were analyzed separately from those with scores of 6–9, 85.3% (110/129) and 99% (97/98) of strokes were identified, respectively, and the detection rate for LVO was also increased to 25.6% (33/129) and 52% (51/98).

The detection rate of stroke and LVO based on the SHIPS scale in the training group.
Validating the SHIPS scale in detecting stroke and LVO
Using the cutoffs determined from the training group, ROC analysis in the validation group (n = 120) demonstrated that the stratified SHIPS scale (0–2, 3–5, 6–9) performed well in detecting both stroke (sensitivity, 89.9%; specificity, 61.3%) and LVO (sensitivity, 67.7%; specificity, 84.3%). When applying the SHIPS scale and other prehospital scoring systems to the validation population using ROC comparison analysis, the AUC of the SHIPS scale was not inferior to that of the Stroke 1-2-0 test in predicting stroke (0.814 versus 0.783, z = 1.027, p = 0.301) and it was significantly better than that of the CPSSS (0.825 versus 0.718, z = 2.522, p = 0.012) and PASS scales (0.825 versus 0.702, z = 3.108, p = 0.002) in predicting LVO (Figure 3 and Table 4).

Comparison of SHIPS, CPSSS and PASS scale in predicting LVOs.
Comparisons between scales in predicting stroke and LVO in the validation group (n = 120).
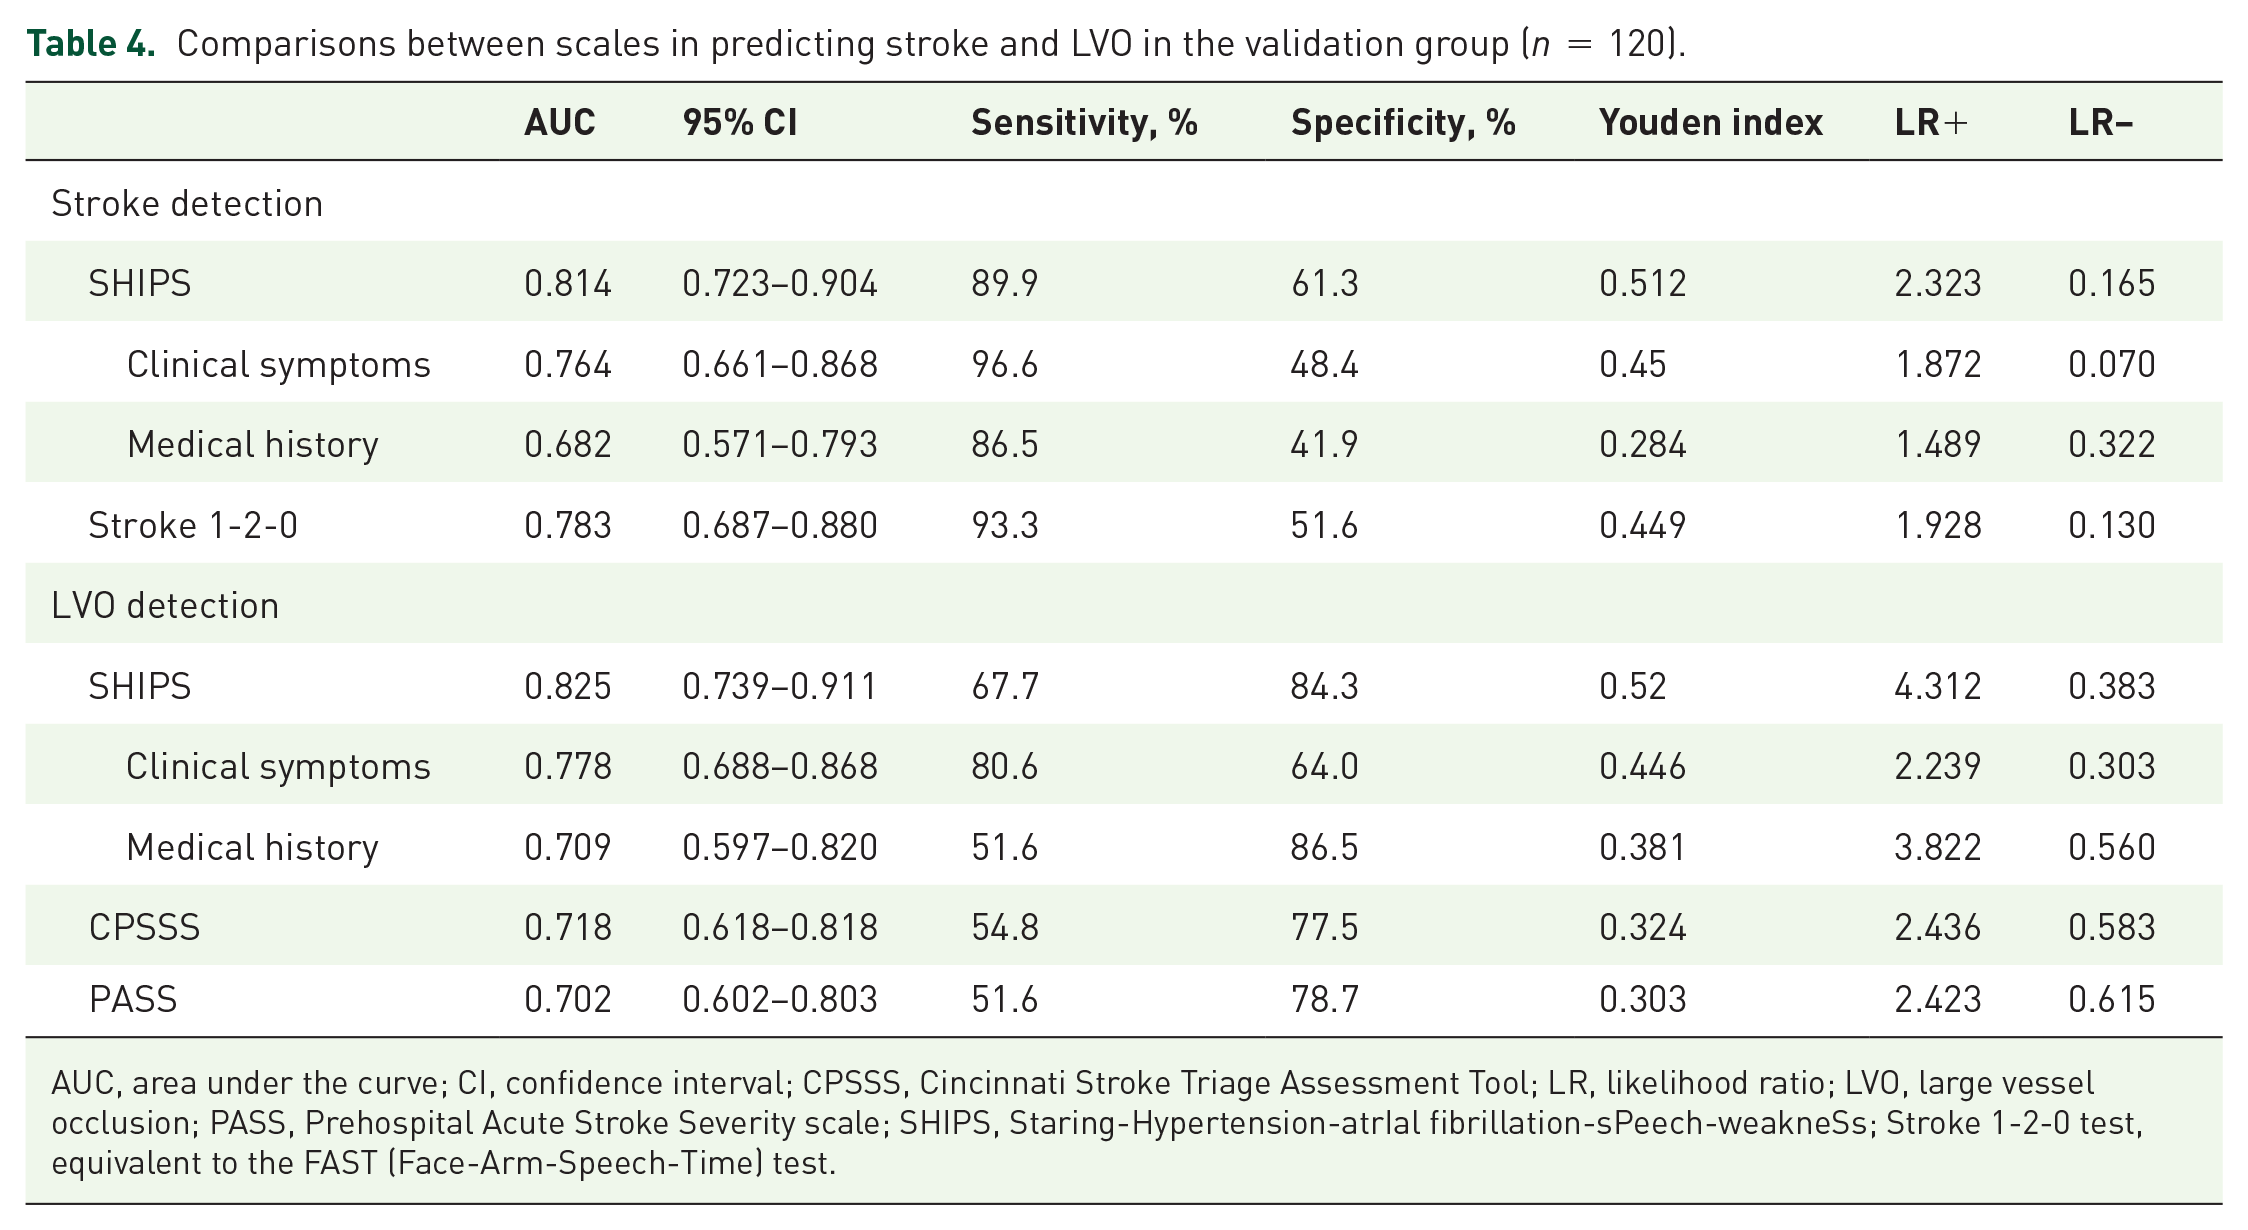
AUC, area under the curve; CI, confidence interval; CPSSS, Cincinnati Stroke Triage Assessment Tool; LR, likelihood ratio; LVO, large vessel occlusion; PASS, Prehospital Acute Stroke Severity scale; SHIPS, Staring-Hypertension-atrIal fibrillation-sPeech-weakneSs; Stroke 1-2-0 test, equivalent to the FAST (Face-Arm-Speech-Time) test.
ROC analysis also showed that both medical history and clinical symptoms were able to predict the presence of stroke and LVO (all p < 0.001), but they did not show a better predictive value than the SHIPS scale, Stroke 1-2-0 test, CPSSS, or PASS (all p > 0.05). Compared with using only clinical symptoms, the SHIPS scale was more beneficial for detecting stroke (AUC: 0.814 versus 0.764, z = 3.038, p = 0.002) and LVO (AUC: 0.825 versus 0.778, z = 2.560, p = 0.01) by adding medical history into the scale, especially in improving the specificity (stroke: 61.3% versus 48.4%, LVO: 84.3% versus 64%).
The distribution of stroke and LVO in each of the SHIPS scale risk groups in the validation group is shown in Figure 4. Among patients who scored ⩾3, 89.9% (80/89) of patients with stroke and 96.8% (30/31) of patients with LVO were identified. It is worth noting that six patients with one positive clinical symptom but without any medical history on the SHIPS scale were assigned to the low stroke risk group because they scored 2. If we relaxed the cutoff standard by adding patients who had at least one positive clinical symptom, the sensitivity to detect stroke and LVO increased to 96.6% (86/89) (including 100% posterior circulation stroke) and 100% (31/31), respectively, whereas the specificity rate declined to 51.6% (16/31), which is equivalent to that of the Stroke 1-2-0 test.

The detection rate of stroke and LVO based on the SHIPS scale in the validation group.
Discussion
In this study, we designed and validated a simple tool, the SHIPS scale, to screen for stroke and LVO simultaneously in suspected patients with stroke. Based on these results, the vast majority of patients with stroke or LVO can be identified by a score ⩾3 on the SHIPS scale or with at least one positive clinical symptom. Therefore, these patients should be transferred to a stroke center. Patients who score 6 or more should be given priority and transferred to a CSC with advanced notice to increase the probability and accelerate initiation of reperfusion treatment. Furthermore, prediction accuracy of stroke and LVO can be improved by adding medical history compared with using clinical symptoms alone.
Our scale consisted of two parts: clinical symptoms and medical history. In terms of clinical symptoms, we confirmed that gaze deviation, limb weakness, and speech problems (including aphasia and dysarthria) were the most important symptoms associated with stroke and LVO. Moreover, because these symptoms are involved in both anterior and posterior circulation strokes, the SHIPS test accurately and sensitively identified posterior circulation stroke (the detection rate for which reached 80.6% in the training group and 100% in the validation group). In terms of medical history, we added two high stroke risk factors (hypertension and atrial fibrillation) to the scale and confirmed the ability of these to detect stroke and LVO. Although their prediction ability is not better than that of clinical symptoms, the prediction ability of our SHIPS scale (integrating clinical symptoms and medical history) is significantly better than that of using clinical symptoms alone, especially in terms of specificity. Moreover, through ROC comparisons, it was confirmed that the SHIPS scale is better than other scoring systems that are based solely on clinical symptoms. Although medical history may not always be available, the electrocardiogram and blood pressure displayed on the monitor during transfer can provide some insight.10,11 Because data-sharing technologies between hospitals is rapidly developing in China,12,13 data-sharing technology could soon include the prehospital stage, which would be helpful for application of the SHIPS scale in the future.
In contrast to scales that include unconsciousness into evaluation,14,15 in our study, unconsciousness was negatively correlated with stroke. This may be due to the fact that the majority of our stroke-mimicking patients were unconscious, that is, epilepsy. A history of diabetes mellitus was also negatively correlated with stroke because many stroke-mimicking patients had diabetes mellitus and presented with hypoglycemia. This result indicates that many patients did not complete the blood glucose test on the ambulance. This is an important issue that needs to be improved in future optimization of the transfer procedure for suspected patients with stroke.
According to the SHIPS scale, approximately 90% of patients with stroke and 100% of patients with LVO can be identified in patients with scores ⩾ 3. This indicates that an SHIPS scale score ⩾3 can be used as a code for paramedic staff triaging patients to nearby stroke centers. Patients with a score ⩾6 should be transferred directly to a CSC to shorten the reperfusion time and improve the outcome. It is worth noting that only 66.7% of patients with LVO were identified based on the SHIPS scale. This means that if we triage patients who score 6–9 to a CSC, only two-thirds of the patients with LVO would be properly identified while approximately one-third of them would be misidentified as low LVO risk and may be transferred to a primary stroke center (PSC). This may cause many patients to lose treatment opportunities. This may be only a small problem in cities with many stroke centers where patients with LVO may still receive endovascular therapy through drip-and-ship mode. In rural areas, however, treatment delay may be serious due to a lack of nearby stroke centers. Therefore, the SHIPS scale should be applied with caution in rural areas.
Our study had some limitations. First, the sample size was limited and this was a retrospective study. Second, our study population was screened by EMS paramedics and only suspected patients with stroke were enrolled in this analysis. Third, internal validation without external confirmation is a significant limitation of this study. Therefore, the external validation for SHIPS scale will be needed in a real-world setting in the future. To solve this problem, we will testify the SHIPS scale score prospectively by multicenter studies, to improve the generalizability of the presented results in the next step. Fourth, we failed to record agnosis/neglect symptoms. Therefore, we did not analyze the effect of agnosis/neglect in detecting stroke and LVO in our patients, nor did we compare the SHIPS scale with other scales containing neglect symptoms such as the Rapid Arterial Occlusion Evaluation (RACE) and the Los Angeles Motor Scale (LAMS). However, because agnosia is suggestive of stroke in the nondominant right hemisphere, adding agnosia to the scale may underestimate the stroke risk in patients with a dominant left hemisphere. Furthermore, a large prospective study indicates that evaluating neglect is difficult for EMS staff and thus an impractical measure for prehospital triage. 16 Other characteristics have not yet been analyzed due to the lack of detailed prehospital records. Therefore, we will further improve the collection of prehospital information in the future and fully compare the predictive ability of the SHIPS scale with other scales.
Conclusion
The SHIPS scale is a practical tool for identifying stroke and LVO in urban China. Applying this scale to prehospital evaluations may optimize the prehospital triage procedure to improve the timely treatment of reperfusion therapies in urban China.
Supplemental Material
sj-docx-2-tan-10.1177_17562864221104511 – Supplemental material for Design and validation of a new scale for prehospital evaluation of stroke and large vessel occlusion
Supplemental material, sj-docx-2-tan-10.1177_17562864221104511 for Design and validation of a new scale for prehospital evaluation of stroke and large vessel occlusion by Yanqi Shao, Zheyu Zhang, Bo Jin, Jingsi Xu, Deqing Peng, Yu Geng, Jungen Zhang and Sheng Zhang in Therapeutic Advances in Neurological Disorders
Supplemental Material
sj-jpg-1-tan-10.1177_17562864221104511 – Supplemental material for Design and validation of a new scale for prehospital evaluation of stroke and large vessel occlusion
Supplemental material, sj-jpg-1-tan-10.1177_17562864221104511 for Design and validation of a new scale for prehospital evaluation of stroke and large vessel occlusion by Yanqi Shao, Zheyu Zhang, Bo Jin, Jingsi Xu, Deqing Peng, Yu Geng, Jungen Zhang and Sheng Zhang in Therapeutic Advances in Neurological Disorders
Footnotes
Ethics approval and consent to participate
All subjects provided written informed consent prior to the study. This retrospective study was approved by the Human Ethics Committee of Zhejiang Provincial People’s Hospital (No. 2017KY021). All clinical investigations were conducted in accordance with the principles of the Declaration of Helsinki.
Consent for publication
Not applicable.
Author contributions
Funding
The author(s) disclosed receipt of the following financial support for the research, authorship, and/or publication of this article: This work was supported by the Zhejiang Provincial Natural Science Foundation of China under Grant No. LGF22H090020 and the Medical Health Science and Technology Project of Zhejiang Provincial Health Commission under Grant No. 2020KY415, No. 2021KY489, No. 2021425713 and No. 2022KY600.
Conflict of interest statement
The authors declared no potential conflicts of interest with respect to the research, authorship, and/or publication of this article.
Availability of data and materials
The original data used to support the findings of this study are available from the corresponding author upon request.
Supplemental material
Supplemental material for this article is available online.
References
Supplementary Material
Please find the following supplemental material available below.
For Open Access articles published under a Creative Commons License, all supplemental material carries the same license as the article it is associated with.
For non-Open Access articles published, all supplemental material carries a non-exclusive license, and permission requests for re-use of supplemental material or any part of supplemental material shall be sent directly to the copyright owner as specified in the copyright notice associated with the article.