
Abstract
Background:
We aimed to evaluate the diagnostic yield of seven-tesla (7T) magnetic resonance imaging (MRI) with post-processing of three-dimensional (3D) T1-weighted (T1W) images by the morphometric analysis program (MAP) in epilepsy surgical candidates whose 3T MRI results were inconclusive or negative.
Methods:
We recruited 35 patients with pharmacoresistant focal epilepsy. A multidisciplinary team including an experienced neuroradiologist evaluated their seizure semiology, video-electroencephalography data, 3T MRI and post-processing results, and co-registered FDG-PET. Eleven patients had suspicious lesions on 3T MRI and the other 24 patients were strictly MRI-negative. 7T MRI evaluation was then performed to aid clinical decision. Among patients with pathologically proven focal cortical dysplasia (FCD) type II, signs of FCD were retrospectively evaluated in each MRI sequence (T1W, T2W, and FLAIR), and positive rates were analyzed in each MAP feature map (junction, extension, and thickness).
Results:
7T MRI evaluation confirmed the lesion in nine of the 11 (81.8%) patients with suspicious lesions on 3T MRI. It also revealed new lesions in four of the 24 (16.7%) strictly MRI-negative patients. Histopathology showed FCD type II in 11 of the 13 (84.6%) 7T MRI-positive cases. Unexpectedly, three of the four newly identified FCD lesions were located in the posterior quadrant. Blurred gray–white boundary was the most frequently observed sign of FCD, appearing on 7T T1W image in all cases and on T2W and FLAIR images in only about half cases. The 7T junction map successfully detected FCD (10/11) in more cases than the extension (1/11) and thickness (0/11) maps. The 3D T1W images at 7T exhibited superior cerebral gray–white matter contrast, more obviously blurred gray–white boundary of FCD, and larger and brighter positive zones in post-processing than 3T T1W images.
Conclusion:
7T MRI with post-processing can enhance the detection of subtle epileptogenic lesions for MRI-negative epilepsy and may optimize surgical strategies for patients with focal epilepsy.
Keywords
Introduction
Approximately one-third of epilepsy patients cannot be well controlled by antiepileptic drugs. 1 Resective surgery provides effective treatment for patients with pharmacoresistant focal epilepsy. Magnetic resonance imaging (MRI) plays a fundamental role in identifying structural lesions during presurgical evaluation. Resective surgery in patients with focal epilepsy becomes more challenging and achieves poorer outcome when the presurgical MRI is negative. 2
In the past two decades, advances in MRI techniques, including higher magnetic field from 1.5-tesla (T) to 3T and the application of dedicated epilepsy protocols, have improved the detection of epileptogenic lesions in visual evaluation of MR images from patients with focal epilepsy.3–7 Furthermore, visual assessments of MR images with some other neuroimaging modalities, such as positron emission tomography (PET)-MRI co-registration,8,9 subtraction ictal single photon emission computed tomography (SPECT) co-registered to MRI, 10 and magnetoencephalography, 11 have provided additional localizing values for focal epilepsy, particularly in extratemporal cases. However, there are still numerous pharmacoresistant focal epilepsy patients exhibiting no structural abnormalities under exhaustive multimodal imaging evaluation, which hinders them from achieving seizure freedom through surgical resection.
The advent of ultra-high-field MRI may overcome this dilemma by improving the detection of structural lesions in the brain. 12 Several studies have reported that 7T MRI could detect epileptogenic lesions in ~25% of patients who were negative on conventional field (1.5T and 3.0T) MRI.13–16 Although three-dimensional (3D) T1-weighted (T1W) images were collected, these studies mainly identified new lesions through visual inspection on T2-weighted (T2W) and related sequences, such as fluid-attenuated inversion recovery (FLAIR) and T2* dual-echo gradient-recalled echo (GRE) sequences.13–16
Visual inspection of MR images may miss subtle epileptogenic lesions such as focal cortical dysplasia (FCD). FCD was the most common pathological findings in MRI-negative pharmacoresistant focal epilepsy, 17 and unsuccessful detection of FCD in presurgical evaluation led to worse surgical outcome. 18 To improve the detection of FCD on MRI, several post-processing techniques have been developed to enhance visualization as well as to achieve automated detection, including voxel- and surface-based morphometry of 3D T1W images19–22 and voxel-based signal intensity analysis of FLAIR images.23,24 Among these methods, the morphometric analysis program (MAP), a user-friendly tool requiring no coding ability, has been proven very useful in detecting FCD on conventional field MRI.18,25 It is now routinely utilized in standard presurgical workflows of more than 60 epilepsy centers worldwide. 26 Recently, a study reported that 7T MRI with post-processing of T1W images could detect lesions in 43% of patients with focal epilepsy whose 3T MRI radiologic reports were negative. 27 However, subtle epileptogenic lesions always require multimodal imaging data to be identified in presurgical evaluation.28–30 As of yet, it remains unclear whether 7T MRI with post-processing can enhance the detection of epileptogenic lesions in MRI-negative patients who have been comprehensively evaluated through multimodal imaging data. Herein, we investigated the diagnostic value of 7T MRI with post-processing in a cohort of epilepsy surgical candidates whose 3T MRI results were negative or inconclusive after comprehensive evaluation.
Material and methods
Participants
We consecutively recruited 35 patients with pharmacoresistant epilepsy who underwent presurgical evaluation in our Epilepsy Center from November 2017 to October 2020. The inclusion criteria included: (1) clinical history and electroclinical data suggesting focal epilepsy; (2) 3T MRI and PET images without severe artifacts acquired; and (3) no definite epileptogenic lesions identified in presurgical multidisciplinary conference (MDC). The exclusion criteria included: (1) uncontrolled, frequent seizures hindering MRI scanning; (2) pediatric patients who needed sedation during the scan; and (3) any contraindications to 7T MRI. This study was approved by the Medical Ethics Committee of the Second Affiliated Hospital, Zhejiang University School of Medicine (approval number: 2017-085). We obtained written informed consent from all patients or their guardians.
Presurgical evaluation
All patients underwent: (1) long-term scalp video-electroencephalograph (EEG) monitoring; (2) 3T MRI scans (GE Discovery MR750, Chicago, IL, USA) via an epilepsy protocol, including a high-resolution 3D T1W sequence, axial and sagittal T2W sequences, and axial and sagittal FLAIR sequences; and (3) an interictal 18 F-fluorodeoxyglucose ( 18 F-FDG) PET scan (Biograph mCT, Siemens). We performed post-processing of the 3D T1W images through MAP in MATLAB 2015b (MathWorks, Natick, MA, USA) with Statistical Parametric Mapping (SPM12; www.fil.ion.ucl.ac.uk/spm) as previously described. 19 Each patient’s 3D T1W image was compared with a normal database consisting of 40 healthy volunteers scanned by the same sequence. The junction, thickness, and extension maps, displayed in z-scores to represent the extent of deviation from the normal database, were produced by MAP as new 3D volumetric images to highlight three typical features of FCD: blurred gray–white matter boundary, abnormal cortical thickening, and abnormal extension of gray matter into white matter, respectively.18,19,25 We performed PET-MRI co-registration using SPM12. Patient’s FDG-PET images were co-registered to their 3T T1W images. 9 An experienced epileptologist (Y.D.) initially inspected the 3T images, MAP junction map, and co-registered PET before MDC to identify candidate MAP-positive regions and hypometabolic regions. Then, patients’ detailed medical history, seizure semiology, video-EEG findings, neuropsychological results, and multimodal imaging data were presented and extensively discussed in MDC, in which a neuroradiologist with expertise in epilepsy imaging (B. Jiang) inspected the 3T MR images with the knowledge of suspected epileptogenic locations and MAP and PET results. Signs suggesting FCD were inspected with particular attention, including: (1) focal cortical thickening; (2) blurred gray–white matter boundary; (3) abnormal cortical/subcortical hyperintensity on T2W and/or FLAIR images; and (4) transmantal sign.18,25,31 The positive findings on 3T MRI were discussed at MDC to get a consensus.
7T MRI scans
All patients underwent ultra-high-field MRI evaluation using a 7T research system (MAGNETOM, Siemens Healthcare, Erlangen, Germany) equipped with a 32-channel head coil. The 7T MRI prototype sequences included a magnetization-prepared two rapid acquisition gradient echoes (MP2RAGE) sequence, an axial T2W turbo spin echo (TSE) sequence, and a 3D FLAIR sequence/axial and coronal 2D FLAIR sequences. These sequences were repeated once again in case of intolerable head motion. The detailed parameters of the 3T and 7T sequences are summarized in Table 1. We recruited 30 healthy volunteers to construct the normal database of 7T MAP using the same MP2RAGE sequence. The same multidisciplinary team first visually inspected the 7T images with knowledge of suspected epileptogenic locations and hypometabolic regions but blinded to the 3T MRI findings. The 7T junction map was then provided to confirm the results of visual inspection and offer clues to new lesions.
Parameters of sequences at 3T and 7T.
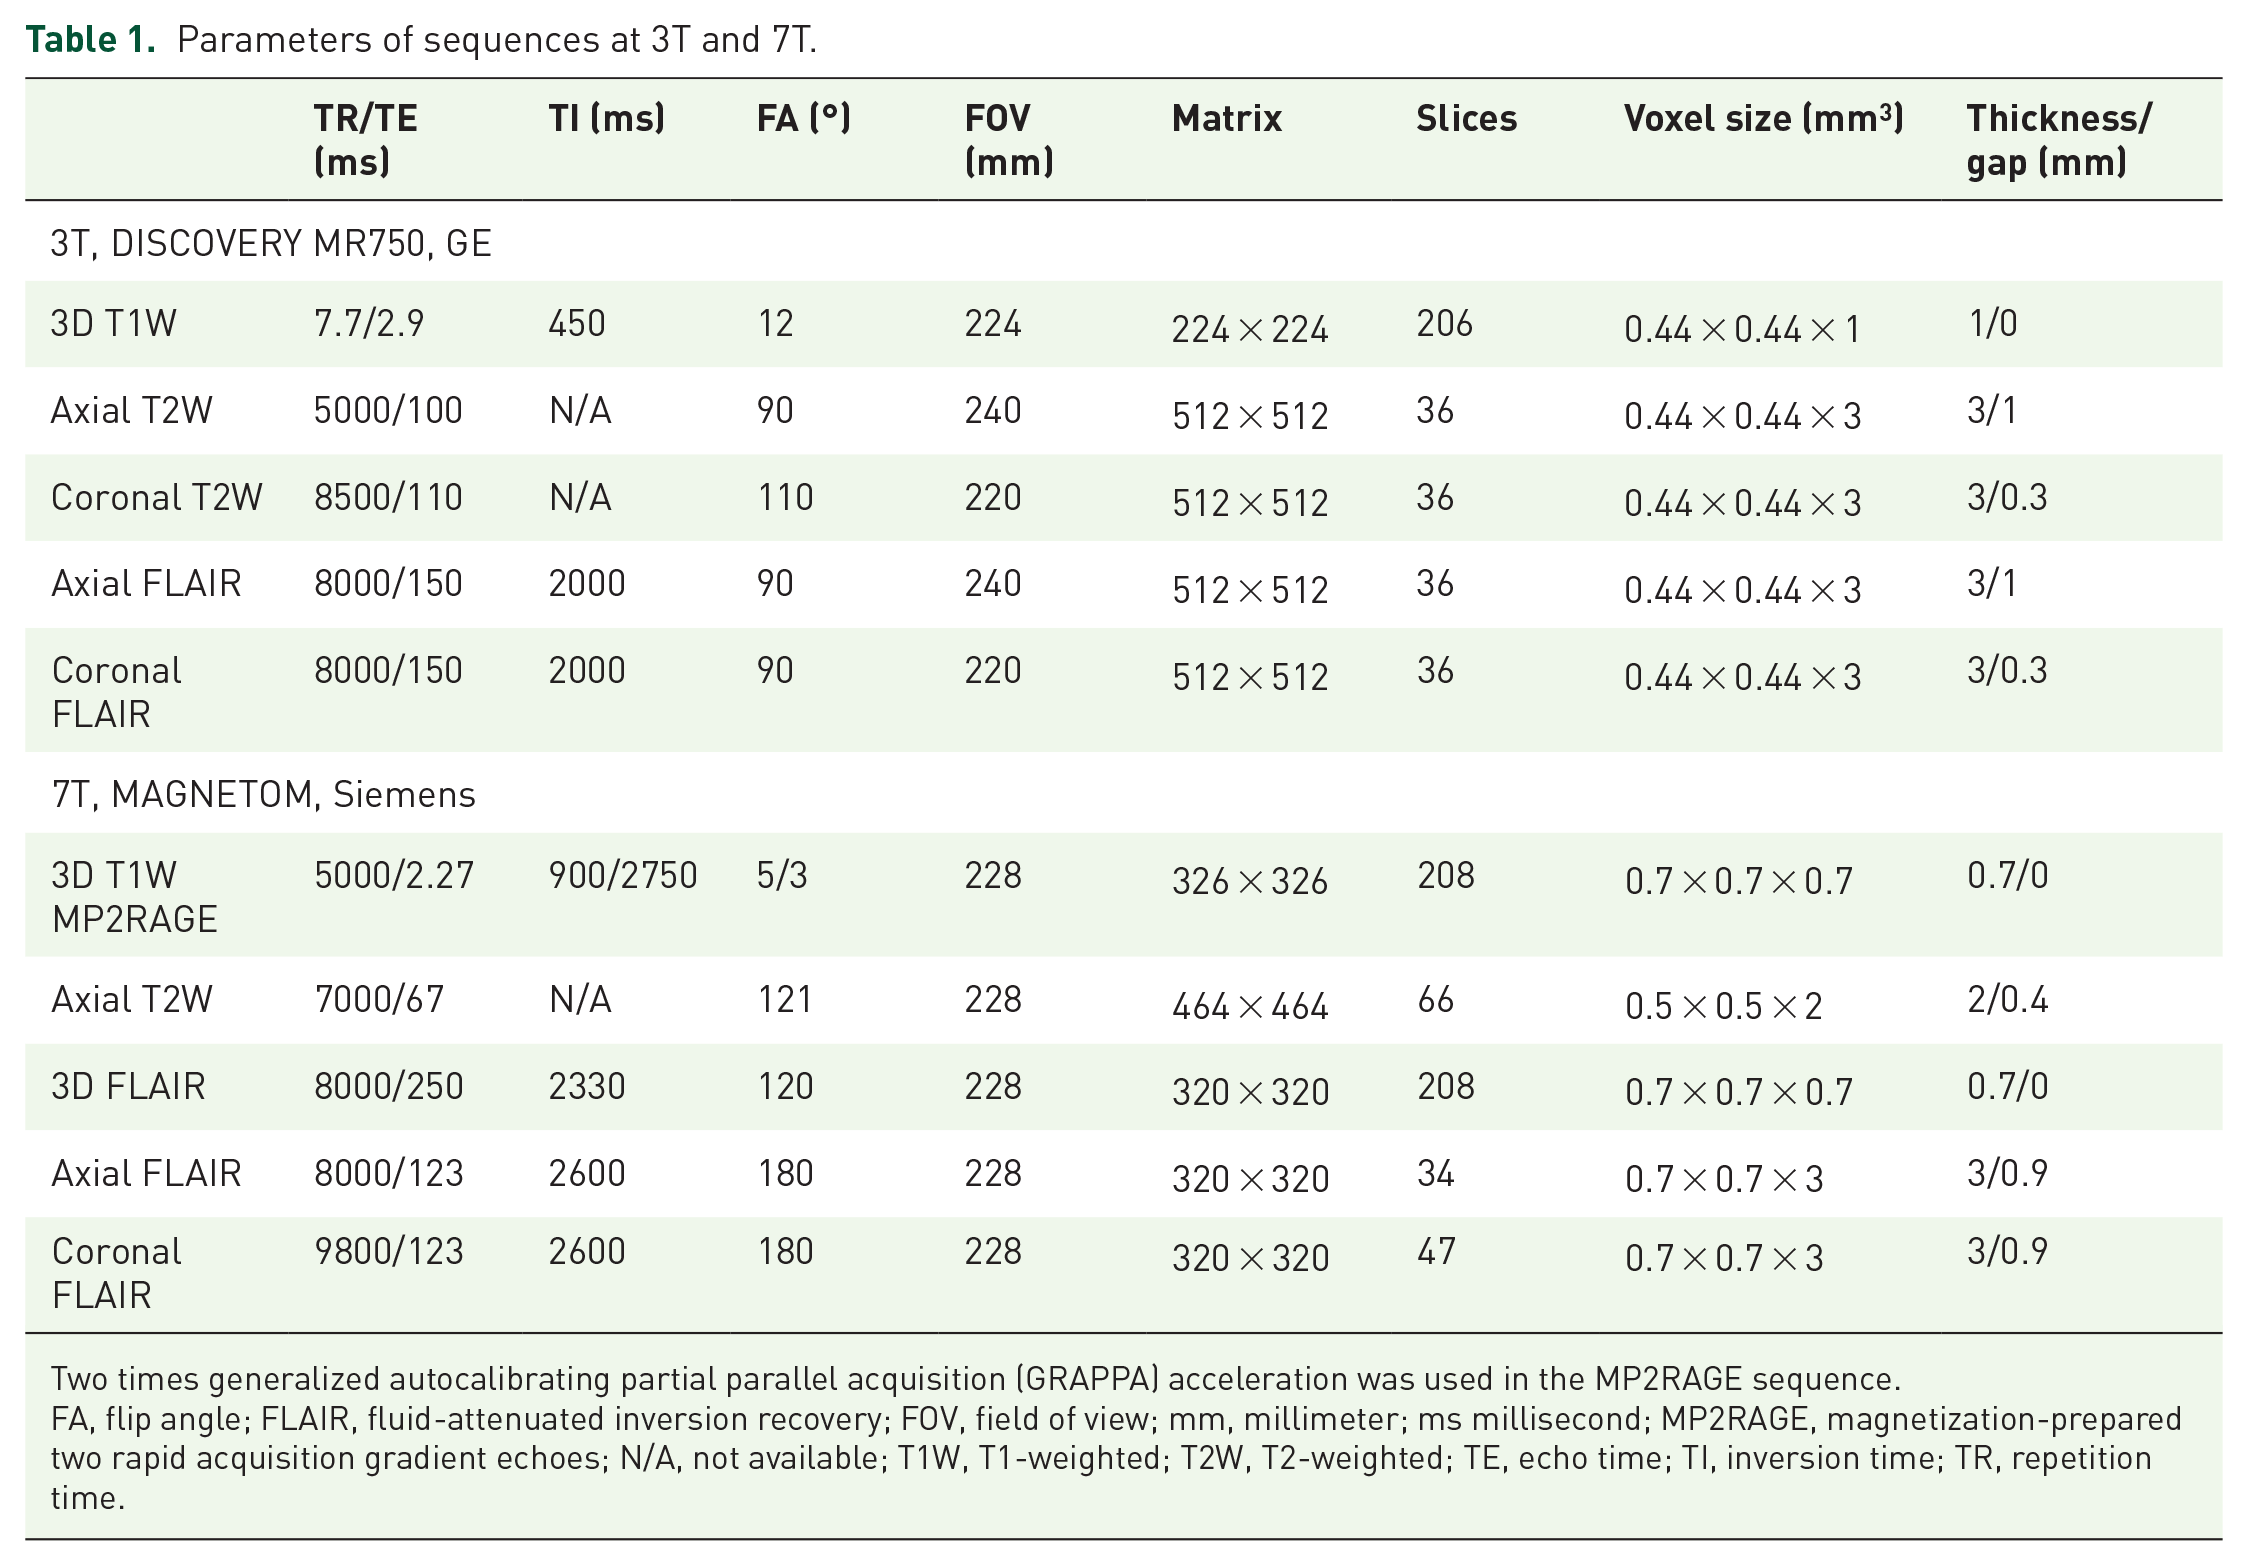
Two times generalized autocalibrating partial parallel acquisition (GRAPPA) acceleration was used in the MP2RAGE sequence.
FA, flip angle; FLAIR, fluid-attenuated inversion recovery; FOV, field of view; mm, millimeter; ms millisecond; MP2RAGE, magnetization-prepared two rapid acquisition gradient echoes; N/A, not available; T1W, T1-weighted; T2W, T2-weighted; TE, echo time; TI, inversion time; TR, repetition time.
Surgery and histopathology
Surgical plans were devised based on the MDC results and 7T MRI findings. Stereotactic EEG evaluation was performed if the localizing information from non-invasive evaluations was inadequate or discordant. An experienced neuropathologist evaluated resected specimens. FCD was classified according to the International League Against Epilepsy (ILAE) criteria. 32 Patients were followed-up regularly to assess their post-operative outcomes. The ILAE outcome classification was applied to patients with at least 1 year of follow-up. 33
Comparisons of MRI and MAP at 3T and 7T
For patients with pathologically proven FCD type II, two neuroradiologists (B. Jiang and H. Li) independently and retrospectively inspected their 3T and 7T sequences to determine: (1) the occurrence rates of the four aforementioned signs of FCD in each sequence; (2) if appeared, on which field images the sign could be identified better (7T better, 3T better, or equal). Discrepancies between raters were then discussed together to reach a consensus. We also retrospectively reviewed the three MAP feature maps to determine their positive rates. The criteria of positivity were presence of highlighted clusters caused by FCD with z-score ⩾4 on junction map, z-score ⩾6 on extension map, and z-score ⩾4 on thickness map. 18 Consistent with previous studies based on 1.5T and 3T MRI,18,19,25 we found the junction map was more sensitive in detecting FCD than the other two feature maps (Supplemental Figure S1), so we further quantitatively compared the 3T and 7T junction maps in highlighting lesions. We first automatically segmented their T1W images into gray matter and white matter at native space by SPM12. 34 Then, we calculated the ratio of average signal value of whole brain white matter to gray matter; higher white/gray ratios represent better gray–white matter contrast. Next, we manually labeled the gray matter and subcortical white matter of FCD to assess its raw gray–white matter contrast. We further calculated the normalized white/gray ratio of FCD, defined as the raw white/gray ratio of FCD divided by the cerebral white/gray ratio to correct the inherent difference of 3T and 7T MRI at gray–white matter contrast. 35 Within the manually drawn region of FCD, we extracted the peak z-score on the junction map and calculated the volume of positive zone with z-scores ⩾4. Clusters with z-scores ⩾4 in the remaining regions of the junction map were considered as false-positive clusters, and the number of false-positive clusters was counted.
Statistical analysis
Statistical analysis was performed using SPSS (Version 20, IBM). Chi-square tests or Fisher’s exact tests were used to compare categorical variables between two independent groups (e.g. sex). Cochran’s Q tests were used to compare categorical variables among three related groups (e.g. signs of FCD in different MRI sequences), and McNemar tests were used for post-hoc pairwise comparisons. Sign tests were used to compare the subjective judgments of which field images better showed the features of FCD. Student’s t-tests were used to compare continuous variables (e.g. age). Paired Wilcoxon tests were used to compare the quantitative parameters at 3T and 7T (e.g. peak z-scores). Statistical significance was set at p ⩽ 0.05.
Results
Demographic and clinical data
A total of 35 patients were recruited (18 males and 17 females). The mean age (±standard deviation) of patients at 7T MRI scan was 21.0 ± 7.0 years. The mean epilepsy duration was 11.3 ± 7.1 years. The median time interval of 3T and 7T MRI scans was 3 months (range 0.5–23 months). The patients were sex-matched with healthy controls (3T: 18/40 males; 7T: 17/30 males) recruited to construct the MAP normal databases. Patients were younger than controls (3T: 29.1 ± 7.7 years, Student’s t-test, p < 0.001; 7T: 24.6 ± 2.6 years, p = 0.013), as no healthy children were recruited as controls. The detailed demographic and clinical data of patients are summarized in Supplemental Table S1.
Suspicious epileptogenic lesions were identified in 11 patients during the first MDC based on 3T MRI. FCD was suspected in 10 patients, all of which located in the frontal and central regions. One patient (P16) with a history of cerebral cysticercosis showed subtle cortical defect in the left middle frontal gyrus. The remaining 24 patients were considered strictly MRI-negative, despite the fact that non-specific structural lesions were found in three of them (P2, P4, and P19; Supplemental Table S1).
7T MRI results
Of the 11 patients with suspicious epileptogenic lesions, 7T MRI confirmed lesions in nine (81.8%) and excluded lesions in two (P13 and P15; Figure 1). Of the 24 patients in the MRI-negative group, 7T MRI disclosed epileptogenic lesions in four (16.7%), including two lesions identified by visual inspection (P2 and P10) and additional two lesions identified with the assistance of post-processing (P24 and P31; Figure 2). The diagnostic yield of 7T MRI was mainly derived from the 3D T1W sequence and post-processing. The T2W and FLAIR images at 7T could show blurred gray–white matter boundary and abnormal cortical thickening, but the lack of abnormal hyperintensity limited their ability to highlight subtle FCD lesions (Figure 2).

Two patients with suspicious lesions on 3T MRI. Each row from left to right shows the 3T T1W image (a), 3T MAP junction map (b), co-registered PET (c), 7T T1W image (d), and 7T MAP junction map (e). Red crosshairs indicate suspicious lesions. The P5 has suspicious gray–white matter boundary blurring at the right superior frontal sulcus (a, b) with normal metabolism (c). The 7T MR image (d) and junction map (e) verify this finding. The P15 has suspicious blurred gray–white matter boundary at the left operculum (a), which is positive on the 3T junction map (b) with focal hypometabolism (c). However, the 7T MR image (d) exhibits clear gray–white matter boundary, and the negative 7T junction map (e) also suggests that the suspicious lesion on the 3T image may be caused by partial volume effect.

Two FCD type IIa lesions newly identified by 7T MRI. For each patient, the T1W (a), MAP junction map (b), T2W (c), and FLAIR images (d) from 3T (upper row) and 7T (lower row) as well as the co-registered PET (e) are displayed at the same or nearest section. (f) The magnified axial (upper), coronal (middle), and sagittal (lower) T1W images acquired at 3T (left) and 7T (right) are provided for comparison. Red crosshairs indicate the location of FCD. The 3T MRI with post-processing (a, b; upper row) and co-registered PET (e) fail to provide clear localizing clues for these two lesions. In contrast, 7T MRI and post-processing (a, b; lower row) show obvious abnormalities. These two subtle lesions are difficult to be identified on T2W or FLAIR images at 3T and 7T (c, d). Please note bias regularization and intensity-normalization 24 were performed in displayed MRI images (and also in Figures 1 and 3). The average signal of white matter was normalized to 1000. The window centers are 800, 2, 1500, and 800 for the T1W, junction map, T2W, and FLAIR images, respectively. The window widths are 1600, 8, 3000, and 1600, respectively.
Surgery, pathology, and outcome
The 7T MRI evaluation altered or modified surgical planning for patients with positive findings. The 11 patients with suspicious lesions on 3T MRI were all recommended for invasive EEG evaluation during the first MDC. However, the 7T MRI confirmed these lesions in nine patients, leading to direct resection in two patients with concordant electrophysiological and metabolic results (P3 and P28), and guided depth electrodes implantation and complete resection in seven patients (P5, P7, P11, P12, P16, P33, and P35). In these nine patients, histopathology revealed FCD IIa (P5, P33, and P35), FCD IIb (P3, P7, P11, and P28), gliosis (P16), and oligodendroglial hyperplasia (P12). We found that 7T image with post-processing could clearly reflect subtle dysplastic cortex of FCD (Figure 3). For the two patients (P13 and P15) whose suspicious 3T lesions were excluded by 7T imaging, the scheme of depth electrodes implantation was altered to focus more on ictal semiology. It was noteworthy that subsequent invasive EEG confirmed these two putative lesions were both non-epileptogenic.

An example of link between MRI and pathology. (a) Sagittal T1W image shows gray–white matter boundary blurring at the bottom of right inferior frontal sulcus (red crosshair) in the P28. The axial 7T T1W image (b) and junction map (c) clearly reflect the dysplastic lesion in gross specimen (white arrow in d, corresponding to the dotted circle in b). (e) Histopathological sections of hematoxylin and eosin staining (left) and immunostaining of vimentin (right) reveal dysmorphic neurons and balloon cells, suggesting FCD type IIb.
In the 3T MRI-negative group, the positive findings on 7T MRI modified the original implantation schemes of P2 and P31 to cover the newly identified lesions. It also promoted two patients (P10 and P24), previously considered as inappropriate surgical candidates, to accept invasive EEG evaluation and resection. Invasive EEG monitoring validated that these four lesions were all epileptogenic, and histopathology revealed FCD in all of them (type IIa for P10, P24, and P31; type IIb for P2). In contrast, of the 22 patients who were negative on 7T MRI (including two patients whose suspicious lesions were excluded at 7T), only six (27.3%) underwent invasive EEG evaluation and four (18.2%) finally accepted resection, which was significantly lower than patients with newly identified lesions on 7T MRI (Fisher’s exact test, p = 0.005). Histopathology reported FCD IIIc (P8) and normal (P4, P13, and P22) in these four MRI-negative patients. Resection was not feasible in two patients due to diffuse (P15) or bilateral (P34) seizure onsets.
A total of 17 patients (48.6%) underwent surgical resection. In the latest follow-up, 12 patients achieved ILAE class 1 outcome at a median of 24.5 months follow-up (range 12–29 months). Three patients also kept seizure-free but the follow-up period was less than 1 year (3 months for P31 and P33, 2 months for P35). One patient (P10) achieved ILAE class two outcome at 19 months follow-up, and one patient (P22) had no worthwhile improvement (ILAE class 5) after 15 months follow-up.
Comparison of 7T and 3T images
Retrospective inspection of the 11 pathologically proven FCD type II lesions revealed blurred gray–white matter boundary was the most frequent sign (9/11 at 3T; 11/11 at 7T), followed by focal cortical thickening (7/11 both at 3T and 7T). No cases showed cortical/subcortical hyperintensity on T2W/FLAIR images or transmantal sign. The occurrence rates of blurred gray–white matter boundary were different among different sequences at 7T (Cochran’s Q test, p = 0.008) and 3T (p = 0.037). Post-hoc pairwise tests demonstrated the 7T T1W images (11/11, 100%) showed blurred gray–white matter boundary in more cases than the T2W (6/11, 54.5%; McNemar test, p = 0.031) and FLAIR images (5/11, 45.5%; p = 0.016), but statistical significance was not reached in pairwise comparisons between 3T sequences (McNemar test, p = 0.063 both in T1W versus T2W and in T1W versus FLAIR; Figure 4a). No significant difference was observed in the occurrence rates of cortical thickening among different sequences at 3T (Cochran’s Q test, p = 0.11) or 7T (p = 0.11). Subjective comparisons between 3T and 7T images demonstrated the 7T T1W image was uniformly superior to 3T T1W image in showing blurred gray–white matter boundary (sign test, p < 0.001) and cortical thickening of FCD (p = 0.016; Figure 4b). The post-processing junction map (7/11 at 3T; 10/11 at 7T) highlighted more lesions than the extension map (2/11 at 3T; 1/11 at 7T) and thickness map (0/11 both at 3T and 7T; Figure 4c).
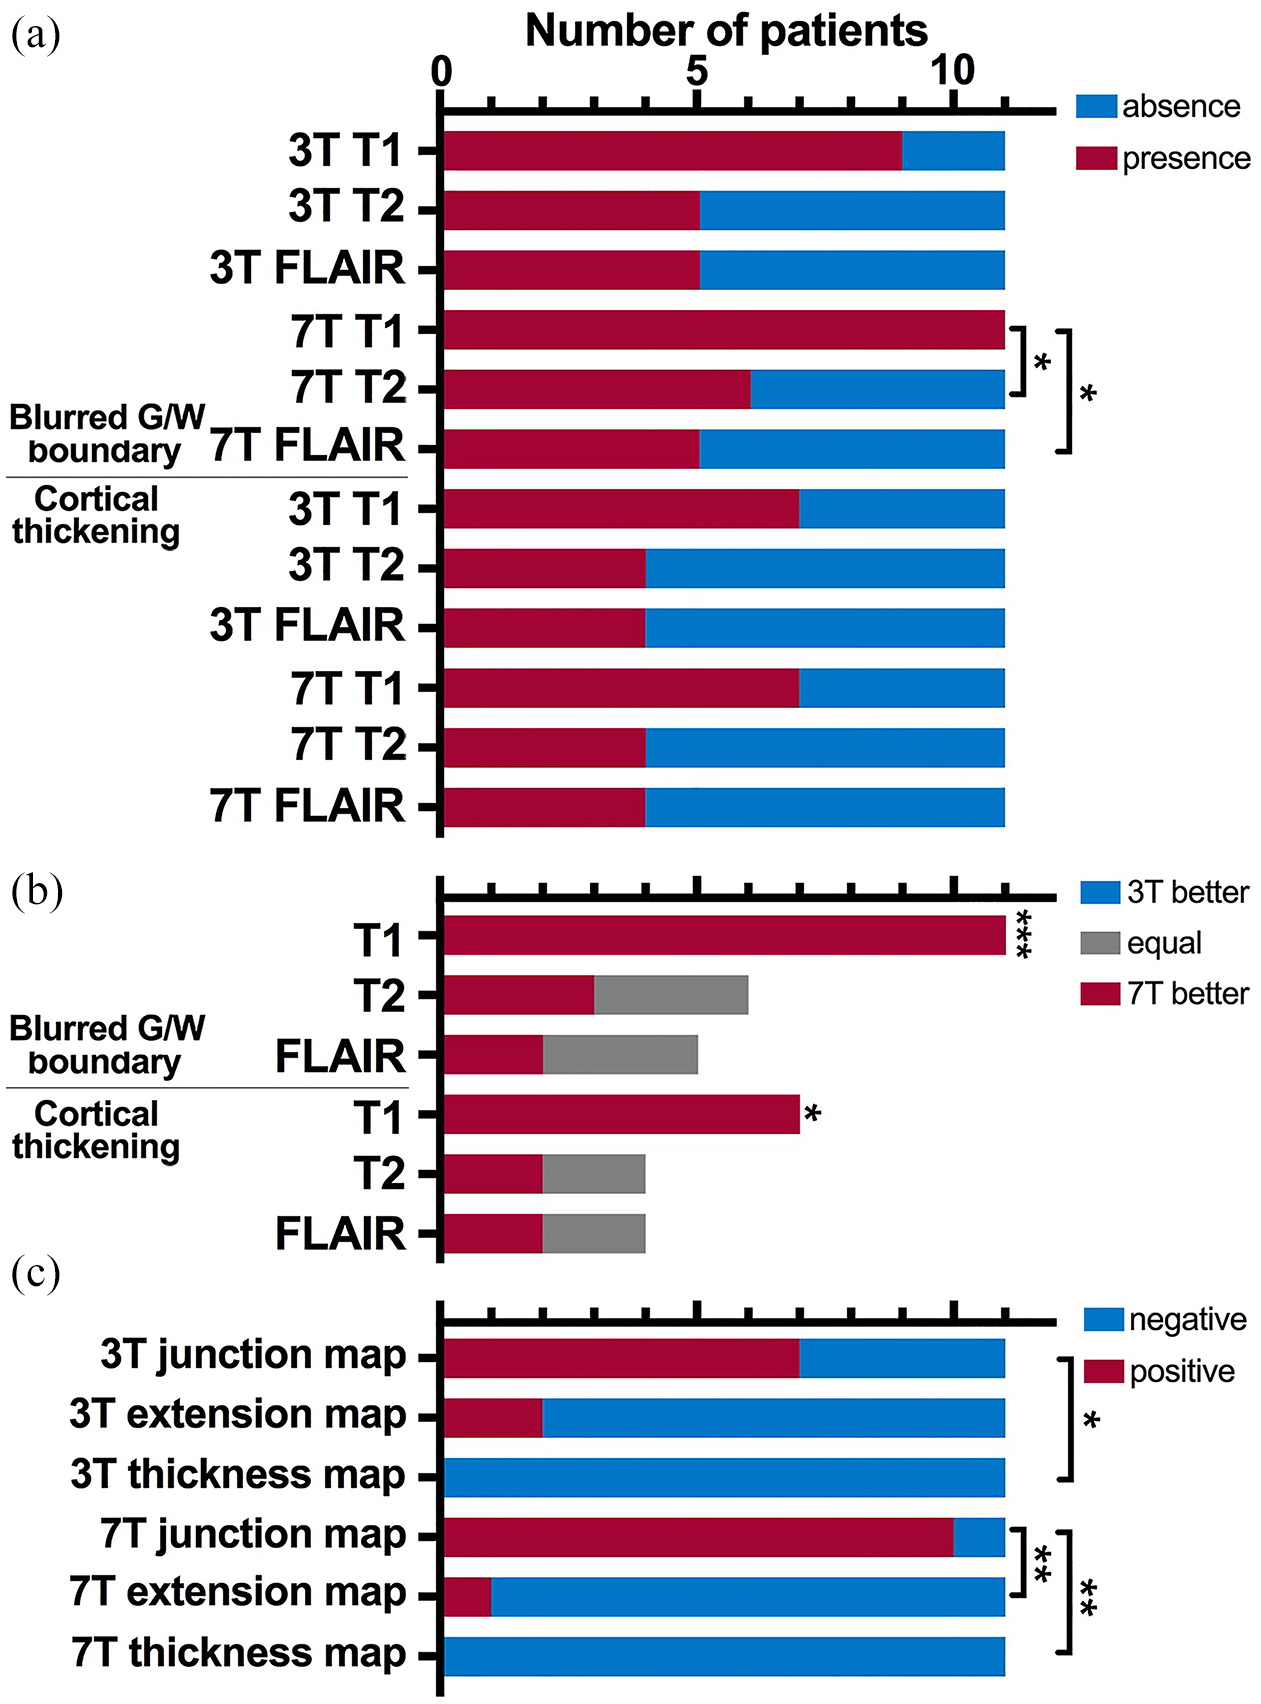
Comparisons of different MRI sequences and MAP feature maps. (a) The occurrence rates of blurred gray–white matter boundary and cortical thickening in T1-weighted, T2-weighted, and FLAIR images. (b) Subjective comparisons between 3T and 7T images in showing blurred gray–white matter boundary and cortical thickening (Sign test: *p < 0.05, ***p < 0.001). (c) The positive rates of different MAP feature maps in detecting FCD.
Quantitative analysis revealed that 3D T1W image at 7T manifested higher cerebral white/gray matter signal ratio than at 3T (paired Wilcoxon test, p = 0.003), suggesting sharper gray–white matter contrast at 7T. The raw white/gray matter signal ratios of FCD were still higher at 7T (p = 0.003). However, after normalizing the cerebral ratios, the 7T image had lower white/gray ratios in FCD than 3T (p = 0.004; Figure 5d–f), indicating that the 7T images exhibited more obvious gray–white matter blurring in FCD. This advantage of 7T was also reflected in post-processing. The 7T junction map had larger positive volumes (p = 0.026) and higher peak z-scores (p = 0.041; Figure 5g–h) within the region of FCD than the 3T junction map, suggesting that the 7T junction map had larger and brighter true-positive clusters in detecting FCD, as shown in Figures 1 and 2. In addition, the 7T junction map had a trend of fewer false-positive clusters than the 3T junction map (p = 0.075; Figure 5i).

Comparison of MRI with post-processing at 3T and 7T. (a) Cerebral segmentation on 7T T1W image of a patient (P24) with FCD at the right lateral occipital lobe. (b) The manually drawn regions of gray matter (red) and subcortical white matter (yellow) of FCD in the same section. (c) The positive region with z-scores ⩾4 (red) on the junction map. Group comparisons indicate that the 7T T1W images had higher cerebral white/gray matter signal ratios (d), higher raw white/gray matter ratios in FCD (e), and decreased normalized white/gray matter ratios in FCD (f). The 7T junction map has larger positive regions (g) and higher peak z-scores (h), as well as a trend of fewer false-positive clusters (p = 0.075, (i) than the 3T.
Discussion
We evaluated the diagnostic value of 7T MRI with post-processing in a cohort of epilepsy surgical candidates whose 3T MRI results were negative or inconclusive after comprehensive evaluation. We found the T1W image at 7T was superior to the T2W and FLAIR images in showing subtle dysplastic cortex, and the junction map of post-processing was more sensitive than the extension map and thickness map in detecting FCD. Together, the 7T T1W image and junction map played a key role in revealing subtle FCD lesions that were overlooked or invisible on conventional field MRI. Successful detection of epileptogenic lesions on 7T MRI could optimize surgical planning and facilitate surgical treatment for patients with focal epilepsy.
MRI-negativity and the detection rate of 7T MRI
It should be noted that the criteria of MRI-negativity are variable in different studies. This depends on the purpose of research as well as the quality and methods of MRI analysis. For instance, studies aiming to assess the diagnostic value of FDG-PET for focal epilepsy usually take normal or non-specific radiological reports as the criterion of MRI-negativity,8,9 while the study investigating the pathological spectrum of MRI-negative focal epilepsy adopted multimodal images to confirm MRI-negativity. 17 In our center, 7T MRI serves as the final attempt to detect potential epileptogenic lesions before invasive EEG evaluation. In this study, we adopted the results of the first MDC as the criterion of MRI-negativity, which had integrated multimodal imaging data and electroclinical information to help uncover the potential epileptogenic lesions on 3T MRI. Therefore, our results truly reflected the diagnostic value added by 7T MRI in presurgical evaluation of focal epilepsy.
The detection rate of epileptogenic lesions on 7T MRI in our strictly MRI-negative group (4/24, 16.7%) was slightly lower than that in previous studies (21.6–43%).13–16,27 This difference is likely attributed to different criteria of MRI-negativity. Previous studies might recruit patients with subtle lesions that could have been identified on conventional field MRI with the aid of post-processing and co-registered PET. In our cohort, all patients initially had negative or non-specific radiological reports except the P12, in whom the radiological report pointed out the lesion at the middle frontal gyrus but missed the mesial frontal lesion. However, after multimodal imaging evaluation, 11 patients were found to have suspicious lesions on 3T images and were no longer classified as MRI-negative cases.
7T MRI sequences
One major difference between previous 7T MRI studies and our current study is that we mainly relied on the 3D T1W sequence and post-processing to identify FCD, whereas previous 7T MRI studies depended on the T2W and related sequences, such as T2* GRE and FLAIR sequences to identify lesions.13–16,31 In general, high-resolution 3D T1W sequence is better to demonstrate morphological abnormalities, while the FLAIR sequence is more sensitive in showing signal alteration in FCD. 7 However, post-processing of the 3D T1W sequence can partially offset its weakness in reflecting signal abnormality. One study indicated the 7T FLAIR sequence could display hyperintensity along the abnormal cortex and gray–white matter boundary in FCD, and the T2* GRE sequence could even detect intracortical abnormality. 13 A recent study revealed that an intracortical hypointense band could be found in FCD type IIb, but not in FCD type I or IIa, by the 7T T2* GRE and susceptibility-weighted angiography sequences. Incomplete resection of this intracortical hypointense band could result to seizure recurrence. 36 Contrary to these studies, the 7T T2W and FLAIR sequences in our study failed to highlight FCD lesions, as they not only lacked obvious cortical/subcortical hyperintensity, but also were inferior to the 3D T1W image in showing blurred gray–white matter boundary and cortical thickening. Transmantal sign was also absent in our FCD cases. It might be caused by the fact that our cohort was highly selective. FCD with transmantal sign or abnormal increased signal on T2W and FLAIR images was usually more obvious, which might have been sensitively detected on 3T MRI and thereby not recruited in this study.
MRI post-processing
The junction map at 7T possessed larger and brighter true-positive clusters than at 3T. This superiority of 7T MRI post-processing can be explained by the inherent greater signal-to-noise ratio, higher tissue contrast, and higher imaging resolution of 7T images. However, 7T MRI has some weaknesses. In the P35, whose FCD was located at the mesial orbitofrontal region, the junction map showed abnormally lower peak z-score at 7T. The signal loss induced by B1 field inhomogeneity and susceptibility artifacts due to proximity to air-filled cavities were both more severe at 7T, 37 leading to decreased gray–white matter contrast at orbitofrontal region and temporal lobes. Therefore, the gray–white matter contrast of FCD in these regions might not significantly deviate from controls on 7T images, resulting in low z-score in post-processing. False-positive findings (artifacts) is one of the major limitations in the clinical application of MRI post-processing. 38 In MAP feature maps, false-positive clusters could be caused by white matter inhomogeneity and other non-specific lesions such as vascular malformations, enlarged perivascular spaces, periventricular nodules, etc.39,40 In clinical practice, the numerous positive clusters in MAP need to be carefully reviewed to rule out artifacts and non-specific lesions. Quantitative analysis of FDG-PET is a useful method to filter the multiple MAP-positive regions. 41 However, this method may exclude true FCD lesions showing normal metabolism. Another study applied different thresholds to post-processing and found that stricter thresholds could increase specificity but decrease sensitivity. 20 Recently, applying an artificial neural network classifier to the feature maps produced by MAP was reported to achieve robust automated detection of FCD. 26 Our results demonstrated that 7T MRI post-processing had larger and brighter true-positive clusters in detecting FCD with possibly fewer false-positive clusters, implying that application of MRI post-processing to 7T images may improve not only sensitivity but also specificity. 7T MRI ruled out two suspicious lesions that were positive on 3T junction map in our cohort. Although the underlying pathological results were unavailable, these two suspicious lesions were not involved in seizure onset as disclosed by invasive EEG evaluation. We speculated that these lesions were most likely caused by the partial volume effect.
FCD location and metabolism
Type II FCD occurs more frequently in the frontal and central regions, and fewer than 5% of surgical cases are located in the occipital lobe.42–44 Besides, subtle FCD is prone to occur at the bottom of sulci.45,46 In our cohort, three of the four newly identified FCD lesions were located at the posterior cortical region (P2, P10, and P24), and two of them (P2 and P24), together with other two subtle FCD type II cases (P7 and P35), were located at the crown of gyri instead of the bottom of sulci. Their unusual location made them more likely to be missed during presurgical evaluation. These cases suggest that FCD at unusual locations may have been underestimated in clinical practice, and re-inspection to the uncommon regions is necessary when FCD is suspected but the initial MRI evaluation is negative. Another atypical feature of FCD in our cohort was that up to 63.6% (7/11) of the FCD type II lesions showed normal metabolism on interictal FDG-PET. This high proportion of negative PET results may be due to the high selectivity of our cohort. Co-registered PET has been reported to correctly localize 72.6–89.3% of FCD type II cases.28,29,43 Occasionally, there are remote hypometabolic regions on PET, 43 which often occurs in the temporal lobe and may mislead the detection of extratemporal FCD, as with cases P2 and P10 in our cohort.
Limitations
Our study has a few limitations: First, this study was based on a cohort from a single center. The diagnostic yield of 7T MRI with post-processing and its value for surgical planning need to be validated in larger samples from different centers. Furthermore, although the positive lesions on 7T MRI were verified through invasive EEG and histopathology, the post-operative follow-up periods for some patients are short. Second, the sequences of the 3T and 7T MRI were slightly different; however, we think it had a negligible effect on results, as the diagnostic value was mainly derived from the 3D T1W sequence and post-processing. Besides, the different scanners and parameters of 3T and 7T T1W sequences might disturb the quantitative comparison of gray–white matter contrast. Therefore, when comparing the gray–white matter contrast of FCD, we corrected the global white/gray matter signal ratio to eliminate the innate differences between the 3T and 7T T1W images. Finally, the patients were younger than the healthy controls at the group level. However, each patent’s T1W image was individually compared with the normal database during post-processing. Given that most adult patients were comparable with the controls in age, and the pediatric subgroup (age ⩽ 16 years; 6/12) showed a trend of higher positive rate in 7T MRI post-processing than adult patients (4/23; Fisher’s exact test, p = 0.059), we think the inclusion of pediatric patients would not significantly impact the results.
Conclusions
Our study demonstrates that 3D T1W image at 7T can reveal subtle FCD more sensitively and obviously than the T2W and FLAIR images as well as the conventional field images. Furthermore, the junction map in post-processing of 7T T1W image is more sensitive in detecting FCD than the other two feature maps. 7T T1W image with post-processing helps to disclose subtle FCD missed on conventional field MRI. Therefore, 7T MRI with post-processing may be a promising tool to improve the detection of subtle epileptogenic lesions and to optimize surgical planning for patients with pharmacoresistant focal epilepsy.
Supplemental Material
sj-pdf-1-tan-10.1177_17562864211021181 – Supplemental material for 7T MRI with post-processing for the presurgical evaluation of pharmacoresistant focal epilepsy
Supplemental material, sj-pdf-1-tan-10.1177_17562864211021181 for 7T MRI with post-processing for the presurgical evaluation of pharmacoresistant focal epilepsy by Cong Chen, Juan-Juan Xie, Fang Ding, Ya-Si Jiang, Bo Jin, Shan Wang, Yao Ding, Hong Li, Biao Jiang, Jun-Ming Zhu, Mei-Ping Ding, Zhong Chen, Zhi-Ying Wu, Bao-Rong Zhang, Yi-Cheng Hsu, Hsin-Yi Lai and Shuang Wang in Therapeutic Advances in Neurological Disorders
Footnotes
Acknowledgements
We would like to acknowledge the Zhejiang University 7 T Brain Imaging Research Center for all the help and support.
CC drafted the manuscript. FD, JMZ, MPD, ZC, BRZ, HYL and Shuang Wang contributed to conception and design of the study. CC, JJX, FD, YSJ, YD, JMZ, MPD, ZYW and Shuang Wang contributed to acquisition of data. CC, B Jin, Shan Wang, HL, B Jiang, HYL and Shuang Wang contributed to analysis of data. YCH, HYL and Shuang Wang revised the manuscript.
Conflict of interest statement
Dr. Y-C. Hsu is a senior research scientist in Siemens Healthcare, Shanghai, China. The other authors report no disclosures relevant to the manuscript.
Funding
The authors disclosed receipt of the following financial support for the research, authorship, and/or publication of this article: This work was supported by the National Natural Science Foundation of China (grant number: 81971207, 61673346, 81527901, 81971208 and 82001366) and National Key R&D Program of China (grant number: 2018YFA0701400).
Supplemental material
Supplemental material for this article is available online.
References
Supplementary Material
Please find the following supplemental material available below.
For Open Access articles published under a Creative Commons License, all supplemental material carries the same license as the article it is associated with.
For non-Open Access articles published, all supplemental material carries a non-exclusive license, and permission requests for re-use of supplemental material or any part of supplemental material shall be sent directly to the copyright owner as specified in the copyright notice associated with the article.