
Abstract
Background:
We explored the effect of teriflunomide on cortical gray matter (CGM) and whole brain (WB) atrophy in patients with clinically isolated syndrome (CIS) from the phase III TOPIC study and assessed the relationship between atrophy and risk of conversion to clinically definite MS (CDMS).
Methods:
Patients (per McDonald 2005 criteria) were randomized 1:1:1 to placebo, teriflunomide 7 mg, or teriflunomide 14 mg for ⩽108 weeks (core study). In the extension, teriflunomide-treated patients maintained their original dose; placebo-treated patients were re-randomized 1:1 to teriflunomide 7 mg or 14 mg. Brain volume was assessed during years 1–2.
Results:
Teriflunomide 14 mg significantly slowed annualized CGM and WB atrophy versus placebo during years 1–2 [percent reduction: month 12, 61.4% (CGM; p = 0.0359) and 28.6% (WB; p = 0.0286); month 24, 40.2% (CGM; p = 0.0416) and 43.0% (WB; p < 0.0001)]. For every 1% decrease in CGM or WB volume during years 1–2, risk of CDMS conversion increased by 14.5% (p = 0.0004) and 47.3% (p < 0.0001) during years 1–2, respectively, and 6.6% (p = 0.0570) and 35.9% (p = 0.0250) during years 1–5. In patients with the least (bottom quartile) versus most (top quartile) atrophy during years 1–2, risk of CDMS conversion was reduced by 58% (CGM; p = 0.0024) and 58% (WB; p = 0.0028) during years 1–2, and 42% (CGM; p = 0.0138) and 29% (WB; p = 0.1912) during years 1–5.
Conclusion:
These findings support the clinical relevance of CGM and WB atrophy and early intervention with teriflunomide in CIS.
Introduction
In patients with clinically isolated syndrome (CIS), gray matter (GM) and whole brain (WB) atrophy predict conversion to clinically definite MS (CDMS), and GM atrophy is associated with disability accumulation and cognitive impairment.1–6 Studies of CIS and early MS indicate cortical pathology may be present from the earliest stages of the disease. Imaging and histopathological studies of CIS and early MS demonstrate that cortical demyelinating lesions can occur prior to the development of white matter (WM) lesions, are highly inflammatory, and are topographically associated with meningeal inflammation, suggesting that the cortex may be a target of an early disease process that is, at least partially, distinct from that mediating later and longer-term phases of MS.7–11
Teriflunomide is a once-daily oral immunomodulator for relapsing forms of MS in adults (including CIS, relapsing-remitting disease, and active secondary progressive disease according to the local label). 12 In the phase III TOPIC study, 13 teriflunomide 14 mg significantly reduced risk of CDMS conversion over 108 weeks in CIS patients (McDonald 2005 criteria) versus placebo. Recent evidence in relapsing MS patients suggests teriflunomide may slow cortical GM (CGM) and WB atrophy.14–16
Structural Image Evaluation using Normalisation of Atrophy Cross-sectional, multi-time-point (SIENAX-MTP) is an MRI analysis technique that quantitates GM and white matter (WM) atrophy separately. 17 We applied SIENAX-MTP and SIENA to images from TOPIC to explore the effect of teriflunomide on CGM and WB atrophy and evaluate the relationship between CGM and WB atrophy and risk of CDMS conversion. 18 The TOPIC dataset provides a unique opportunity to examine these issues, as no placebo-controlled clinical studies to date have evaluated the impact of CGM or WB atrophy on long-term CDMS conversion and clinical progression in patients with CIS. We also examined the utility of CGM atrophy, WB atrophy, cumulative number of new/enlarging T2 lesions, and gadolinium (Gd)+ lesions as predictors of CDMS conversion.
Methods
Study participants and design
Details of the TOPIC study [ClinicalTrials.gov identifier: NCT00622700] design were published previously. 13 Briefly, patients with CIS (per McDonald 2005 criteria) were randomized (1:1:1) and treated daily with oral placebo, teriflunomide 7 mg, or teriflunomide 14 mg for ⩽108 weeks (core study). 19 Patients who completed the core study or were treated with placebo and converted to CDMS after ⩾24 weeks could participate in the open-label extension. Teriflunomide-treated patients continued to receive their original dose; placebo-treated patients were re-randomized 1:1 to receive teriflunomide 7 mg or 14 mg. The extension period continued until teriflunomide was commercially available in the patient’s country of residence or until the sponsor stopped the study (planned after a period of 390 weeks). Screening of patients for TOPIC stopped following an amendment to the protocol on 24 May 2011, as a result of the 2010 revisions to the MS diagnostic criteria enabling earlier diagnosis of MS. 20 The first patient was enrolled in the core study on 13 February 2008, and the last patient completed the core study on 17 December 2012.
MRI protocol
MRI imaging of brain tissue was done at baseline and months 6, 12, 18, and 24 in the core study. Standard MRI acquisition parameters were used, including axial dual-echo spin density- and T2-weighted, sagittal and axial fluid-attenuated inversion recovery (FLAIR), 3D volumetric SPGR (3-dimensional spoiled gradient recalled) acquisition, and axial T1-weighted spin-echo acquisition before and after the administration of Gd. The data extracted from the multimodal image dataset included the number and volume of Gd+ T1 lesions, volume of T2 lesions, and volume of hypointense pre-Gd T1 lesions. The imaging data were collected at MRI facilities associated with each of the clinical sites and were sent on electronic media to a reading center for post-acquisition processing, tissue and lesion segmentation, and data extraction.
In this post hoc blinded analysis of atrophy during the core TOPIC study, baseline CGM volume (CGMV) and WB volume (WBV) was calculated using SIENAX, and longitudinal changes of CGM and WB volumes were assessed using SIENAX-MTP and SIENA.17,18 All MRI analyses underwent multi-level quality control and were reviewed (by author NB) at all critical points of segmentation.
Statistical analysis
Analyses were carried out using data from the modified intention-to-treat (ITT) population (defined as all randomized patients who received ⩾1 dose of study drug) who had ⩾1 postbaseline MRI measure of CGM or WB (referred to as the CGM and WB analysis populations, respectively). Patients without ⩾1 postbaseline MRI measure did not have sufficient data to be included in the analysis.
To examine the effect of teriflunomide treatment on CGM and WB atrophy during years 1–2, data from months 6, 12, 18, and 24, standardized for follow-up duration, were analyzed relative to baseline. Nonparametric analysis of adjusted covariance (rank ANCOVA) models assessed treatment effects on CGM and WB change at each time point separately, and longitudinal rank ANCOVA evaluated the overall cumulative treatment effect. In a subgroup analysis, patients were stratified according to absence/presence of Gd+ lesions at baseline with a treatment-by-subgroup interaction term.
To examine the association between CGM or WB atrophy during years 1–2 and CDMS conversion during years 1–5, irrespective of treatment group, two different statistical models were used. In one, annualized CGM or WB atrophy was treated as a continuous variable and analyzed using a Cox proportional hazards model adjusted for geographical region, treatment, baseline monofocal/multifocal lesion status, and baseline CGMV or WBV. In the other, CGM or WB atrophy was treated as a categorical variable, using the interquartile range (IQR) of CGM or WB atrophy in placebo-treated patients: Group 1, least 25% atrophy in placebo-treated patients; Group 2, IQR of atrophy in placebo-treated patients; Group 3, greatest 25% atrophy in placebo-treated patients. For CGM atrophy, groups were defined as ⩽0.206% reduction from baseline (Group 1); 0.207% to 1.879% reduction from baseline (Group 2); and ⩾1.880% reduction from baseline (Group 3). For WB atrophy, groups were defined as ⩽0.0064% reduction from baseline (Group 1), 0.0065% to 0.66% reduction from baseline (Group 2); and ⩾0.67% reduction from baseline (Group 3). The probability of CDMS conversion was derived from Kaplan–Meier estimates and compared between groups using a Cox proportional hazards model adjusted for region, treatment, baseline monofocal/multifocal lesion status, and baseline CGMV or WBV.
The utility of CGM and WB atrophy versus MRI lesions (Gd+ and new/enlarging T2 lesions) as predictors of conversion to CDMS during years 1–2 was assessed using Cox proportional hazards models. Models were adjusted for treatment arm, baseline monofocal/multifocal lesion status, region, baseline CGMV or WBV, baseline number of Gd+ lesions, annualized percent change in CGMV or WBV, cumulative number of new/enlarging T2 lesions per scan, and cumulative number of Gd+ lesions per scan. C-statistics were calculated to assess the ability of CGMV or WBV change, new/enlarging T2 lesions per scan, and cumulative number of Gd+ lesions per scan (alone and in combination) to distinguish patients with and without CDMS. Values for this measure range from 0.5 to 1.0, with higher values indicating better predictive models.
Standard protocol approvals, registrations, and patient consents
The study was done in accordance with the International Conference on Harmonisation Guidelines for Good Clinical Practice, the Declaration of Helsinki, and local laws and regulations. Independent ethics committees or institutional review boards provided written approval for the study protocol and all amendments. Participants provided written informed consent. This trial is registered with ClinicalTrials.gov [ClinicalTrials.gov identifier: NCT00622700].
Data availability
Qualified researchers may request access to patient-level data and related study documents including the clinical study report, study protocol with any amendments, blank case report form, statistical analysis plan, and dataset specifications. Patient-level data will be anonymized and study documents will be redacted to protect the privacy of the trial participants. Further details on Sanofi’s data-sharing criteria, eligible studies, and process for requesting access can be found at https://www.clinicalstudydatarequest.com.
Results
Study population
The CGM analysis population included a total of 485 patients, with 159, 156, and 170 receiving placebo, teriflunomide 7 mg, and teriflunomide 14 mg, respectively. The WB analysis population included a total of 482 patients, with 159, 154, and 169 receiving placebo, teriflunomide 7 mg, and teriflunomide 14 mg, respectively. Baseline characteristics of the CGM and WB analysis populations were similar across treatment arms (Table 1).
Baseline characteristics of the CGM and WB analysis populations. a

Defined as randomized patients who received ⩾1 dose of study drug and had least 1 postbaseline MRI measure; bTotal volume of hyperintense lesions on T2 plus hypointense lesions on T1 as measured using MRI; cn = 158; dn = 156; en = 169; fn = 483; gn = 154; hn = 168; in = 480; jn = 142; kn = 141; ln = 159; mn = 442; nn = 140; on = 440; pn = 153; qn = 167; rn = 478; sn = 157; tn = 151; un = 166; vn = 474.
CGM, cortical gray matter; EDSS, Expanded Disability Status Scale; Gd, gadolinium; MS, multiple sclerosis; SD, standard deviation; WB, whole brain.
Patients were categorized into three groups based on CGMV and WBV loss in placebo-treated patients. Applying these thresholds to teriflunomide-treated patients, more were categorized into the group with the least atrophy (Group 1) versus most atrophy (Group 3). Baseline characteristics were similar across subgroups irrespective of teriflunomide dose in both the CGM and WB analysis populations; the group with the most atrophy, however, had numerically more Gd+ lesions and higher lesion volume (Table 2).
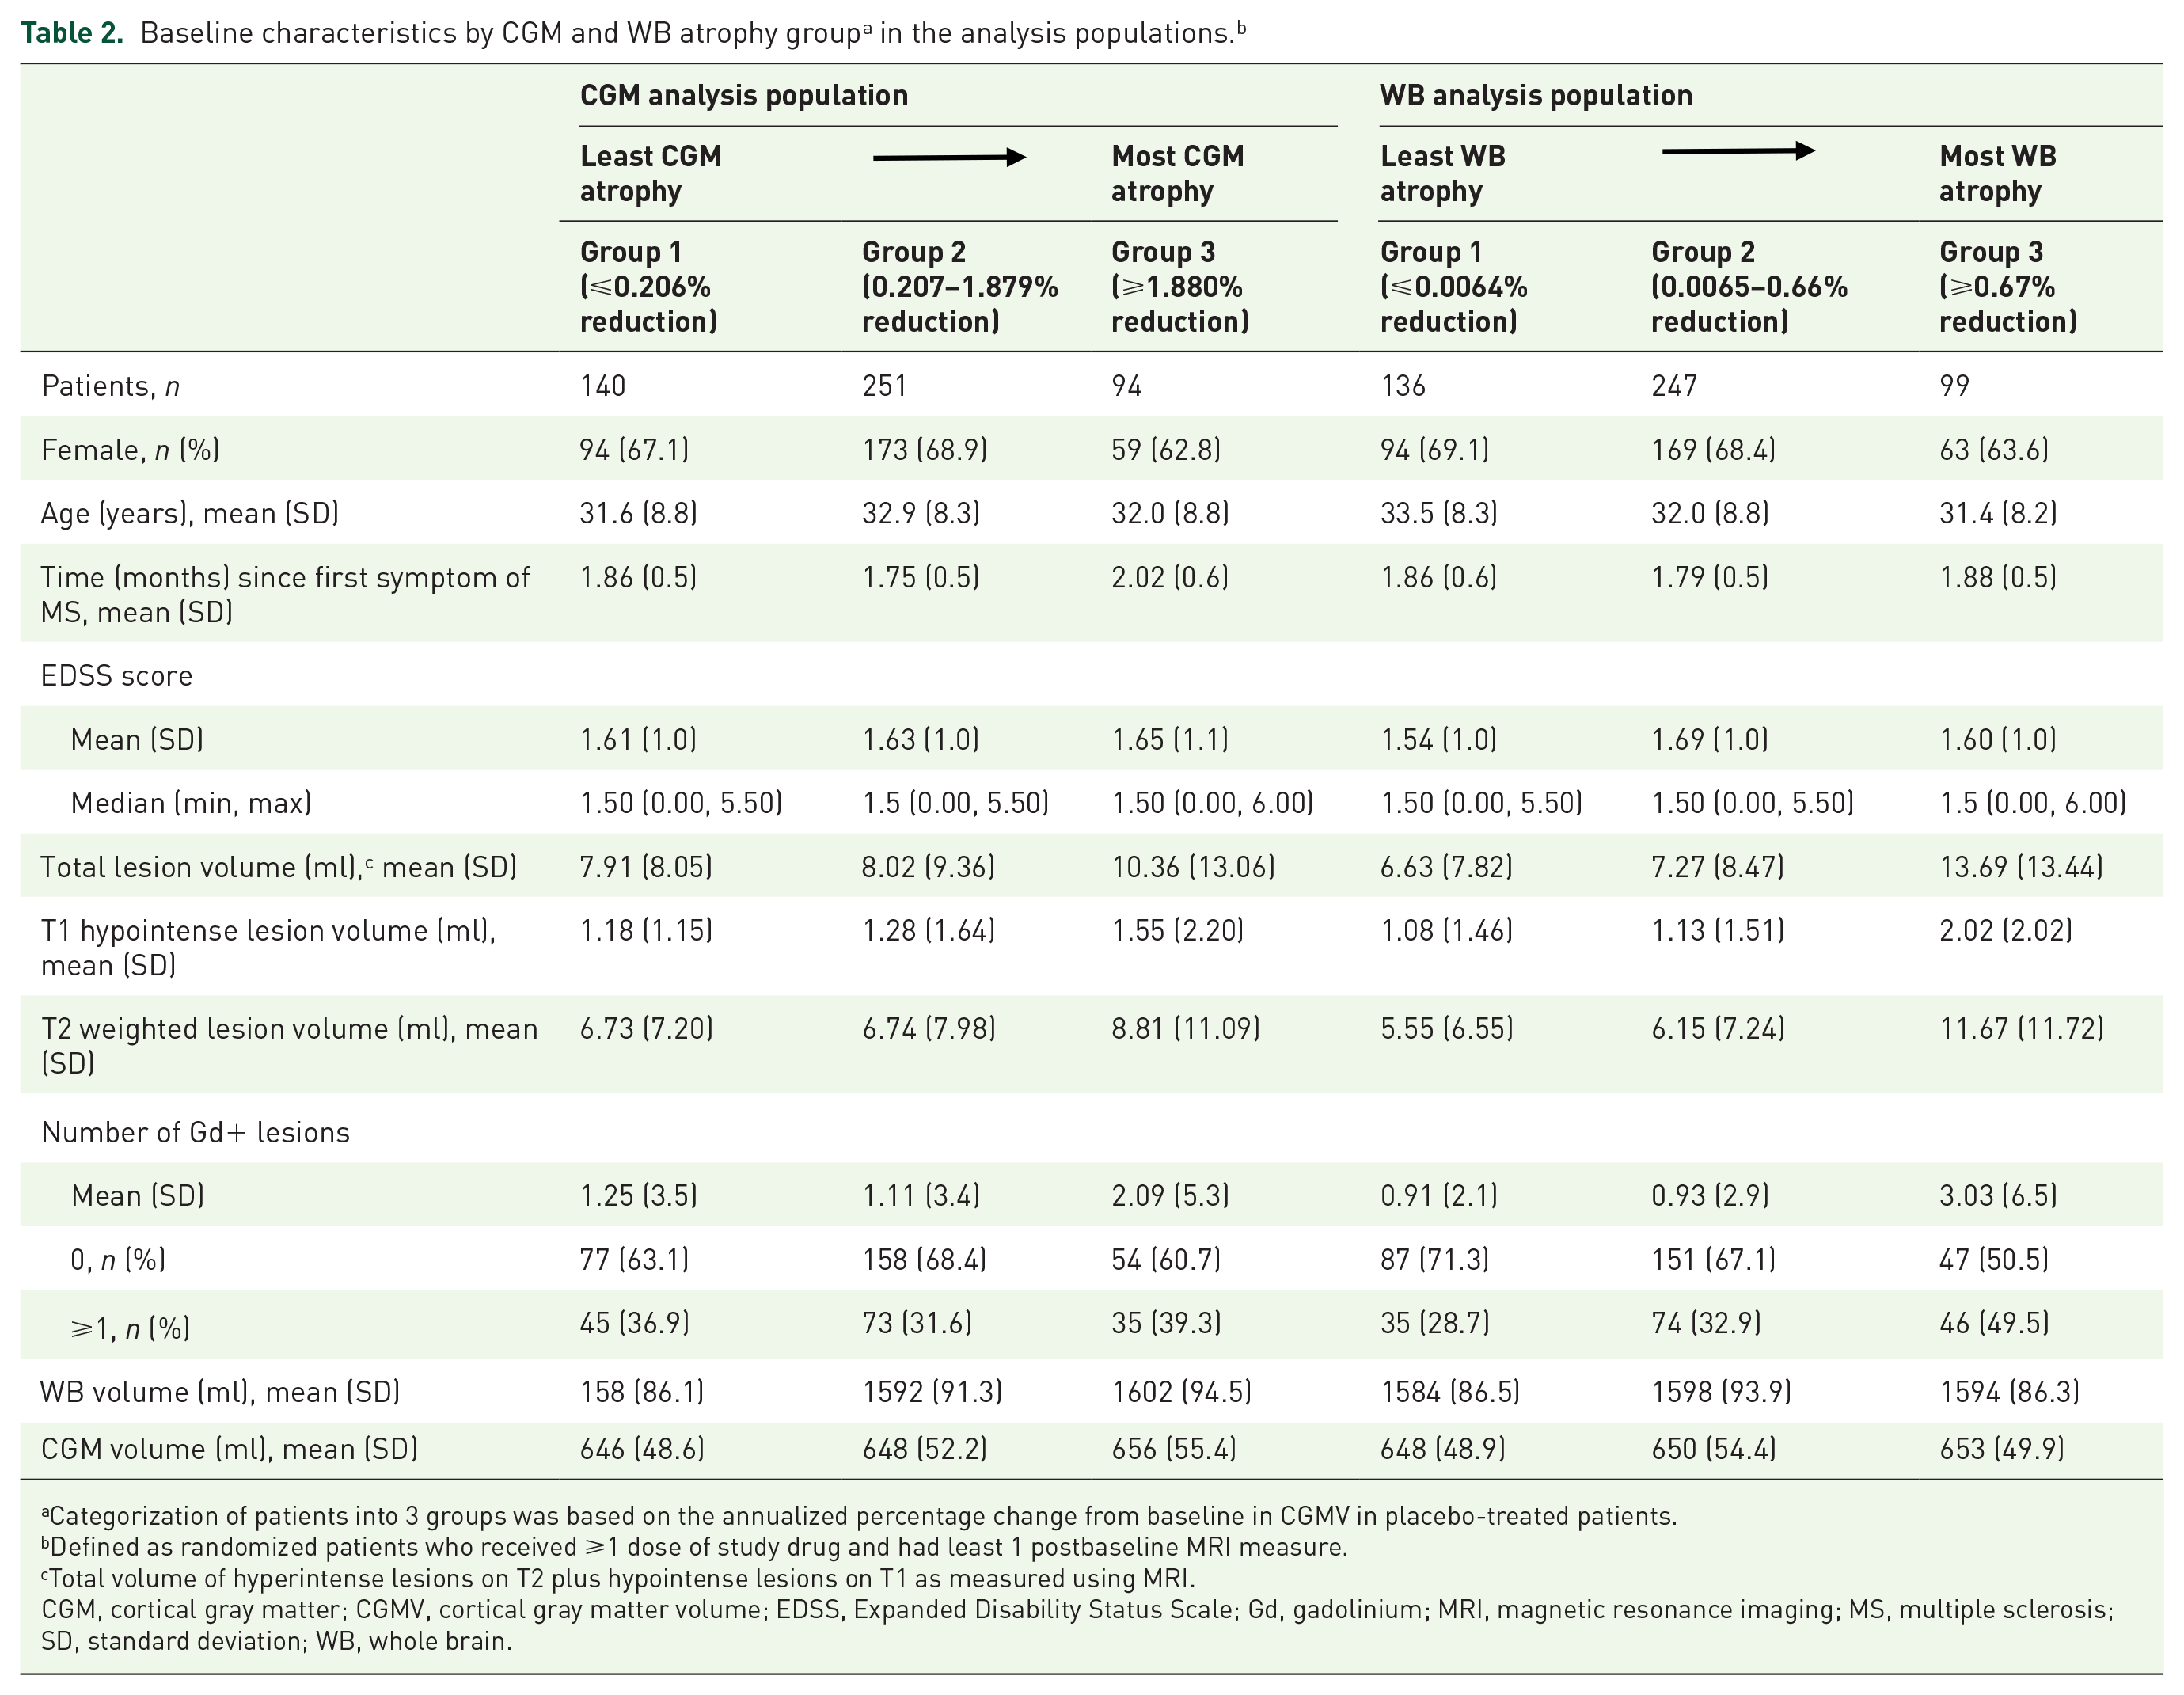


Categorization of patients into 3 groups was based on the annualized percentage change from baseline in CGMV in placebo-treated patients.
Defined as randomized patients who received ⩾1 dose of study drug and had least 1 postbaseline MRI measure.
Total volume of hyperintense lesions on T2 plus hypointense lesions on T1 as measured using MRI.
CGM, cortical gray matter; CGMV, cortical gray matter volume; EDSS, Expanded Disability Status Scale; Gd, gadolinium; MRI, magnetic resonance imaging; MS, multiple sclerosis; SD, standard deviation; WB, whole brain.
Effect of teriflunomide on CGM and WB atrophy
Teriflunomide significantly slowed annualized CGM and WB atrophy during the core study (Figure 1). At all time points, teriflunomide 14 mg significantly reduced median percentage CGMV change (month 6: 119.2% reduction, p = 0.0185; month 12: 61.4%, p = 0.0359; month 18: 66.8%, p = 0.0027; month 24, 40.2%, p = 0.0416; Figure 1a) and WBV change (month 6: 87.4% reduction, p = 0.0244; month 12: 28.6%, p = 0.0286; month 18: 36.1%, p = 0.0003; month 24: 43.0%, p < 0.0001; Figure 1b) versus placebo. Results with teriflunomide 7 mg were similar, except that reductions with teriflunomide versus placebo were only statistically significant at months 18 and 24 (Figure 1).

Effect of teriflunomide on CGM and WB volume. Median percent change from baseline in CGM (a) and WB volume (b) over 2 years in patients receiving placebo, teriflunomide 7 mg, or teriflunomide 14 mg. Derived using rank ANCOVA adjusted for baseline value, 2D or 3D scan (for CGM), and adjusted for baseline value, time, optic neuritis status (Y/N), age, baseline monofocal/multifocal, interaction between time and treatment (for WB).
Overall, there was a significant cumulative treatment effect of teriflunomide versus placebo on annualized CGMV and WBV change from baseline over 2 years. In the placebo group, least squares (LS) mean change was −1.29% (CGMV) and −0.43% (WBV). LS mean change was −0.60% (CGM; p = 0.0089) and −0.29% (WB; p < 0.0001) in the teriflunomide 7 mg group and −0.64% (CGM; p = 0.0052) and −0.30% (WB; p < 0.0001) in the teriflunomide 14 mg group.
In patients with Gd+ lesions at baseline, CGM and WB atrophy were accelerated, whereas patients without Gd+ lesions at baseline did not experience this effect (Figure 2). No significant teriflunomide treatment effect on atrophy was observed for either Gd+ lesion subgroup [treatment-by-subgroup interaction: p = 0.5195 (CGM) and p = 0.2311 (WB)]. In patients with no baseline Gd+ lesions, CGMV loss (Figure 2a) was reduced significantly with teriflunomide 14 mg versus placebo at all time points except month 24 (month 6, p = 0.0301; month 12, p = 0.0311; month 18, p = 0.0224). In patients with ⩾1 baseline Gd+ lesion, CGMV loss reduction did not reach statistical significance at any time point. With teriflunomide 7 mg versus placebo, the reduction in CGMV change was statistically significant at month 18 (p = 0.0456), but not at other time points, in patients with no baseline Gd+ lesions, and did not reach statistical significance at any time point in patients with ⩾1 baseline Gd+ lesion. WBV change (Figure 2b) was reduced significantly with teriflunomide 14 mg versus placebo at all time points in patients with no baseline Gd+ lesions (month 6, p = 0.0284; month 12, p = 0.0013; month 18, p < 0.0001; month 24, p < 0.0001). In patients with ⩾1 baseline Gd+ lesion, the reduction did not reach statistical significance at any time point. With teriflunomide 7 mg versus placebo, there was a statistically significant reduction at months 18 and 24 in both patients without baseline Gd+ lesions (p = 0.0004 and p < 0.0001, respectively) and patients with ⩾1 baseline Gd+ lesion (p = 0.0005 and p < 0.0001, respectively), but not at earlier time points.

Teriflunomide effect on CGM and WB volume depending on Gd+ lesions. Median percent change from baseline in CGM (a) and WB (b) over 2 years in patients receiving placebo, teriflunomide 7 mg, or teriflunomide 14 mg, stratified according to the presence or absence of baseline Gd+ lesions. Derived using rank ANCOVA adjusted for baseline value, 2D or 3D scan (for CGM), and adjusted for baseline value, time, optic neuritis status (Y/N), age, baseline monofocal/multifocal, interaction between time and treatment (for WB).
Association between CGM or WB atrophy and CDMS conversion
Irrespective of treatment group, CGM and WB atrophy during years 1–2 was associated with conversion to CDMS during years 1–2 and years 1–5. In the continuous analysis, for every 1% decrease in CGMV or WBV during years 1–2, the risk of CDMS conversion increased by 14.5% [CGM; hazard ratio (HR) 0.855, p = 0.0004] and 47.3% (WB; HR 0.527, p < 0.0001) during years 1–2, and by 6.6% (CGM; HR 0.934, p = 0.0570) and 35.9% (WB; HR 0.641, p = 0.0250) during years 1–5.
In the categorical analysis (Figure 3), patients with lower CGM atrophy during years 1–2 were significantly less likely to convert to CDMS during years 1–2 compared with patients with the most CGM atrophy [Group 1 (least atrophy) versus Group 3 (most atrophy), 59% risk reduction (RR), p = 0.0014; Group 2 (intermediate atrophy) versus Group 3, 24% RR, p = 0.2757], and during years 1–5 (Group 1 versus Group 3, 42% RR, p = 0.0138; Group 2 versus Group 3, 33% RR, p = 0.0275; Figure 3a). Similarly, patients with lower WB atrophy during years 1–2 were significantly less likely to convert to CDMS during years 1–2 compared with patients with the most WB atrophy (Group 1 versus Group 3, 58% RR, p = 0.0028; Group 2 versus Group 3, 54% RR, p = 0.0004; Figure 3b). The lower WB atrophy groups were also less likely to convert to CDMS during years 1–5, although the effect was statistically significant for Group 2 versus Group 3 (42% RR, p = 0.0062) but not Group 1 versus Group 3 (29% RR, p = 0.1912).
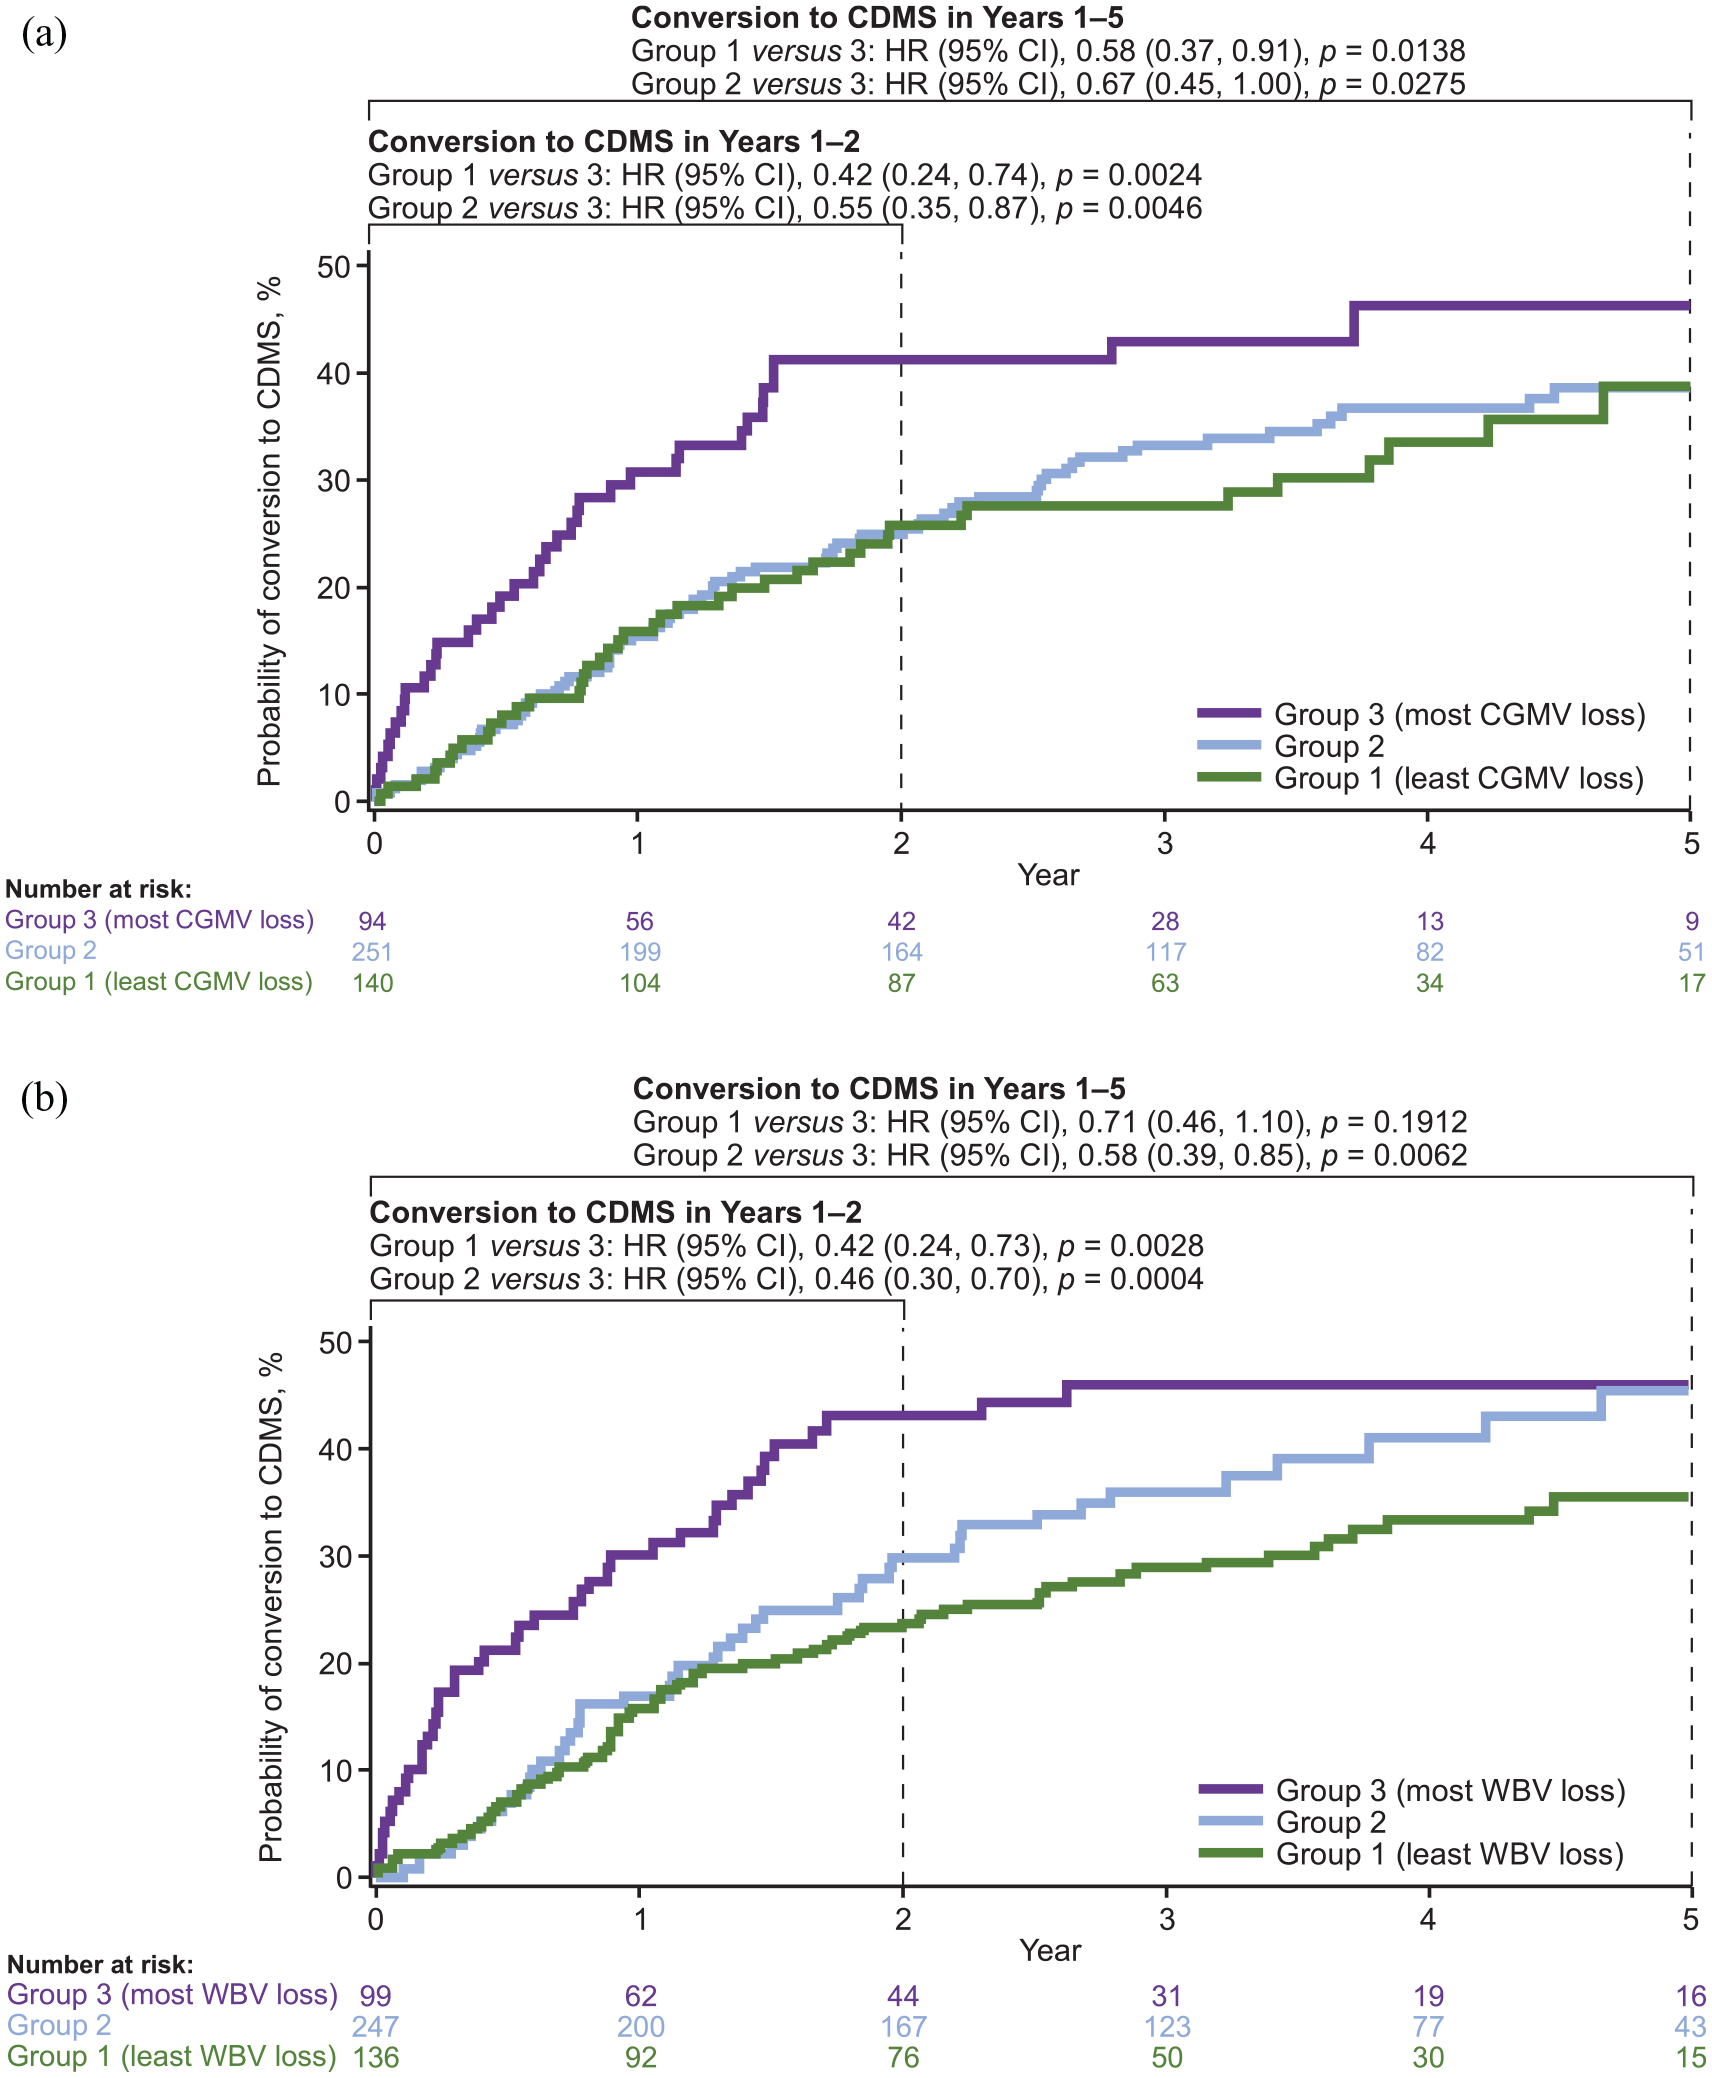
Association between CGM or WB atrophy and CDMS conversion. Probability of relapse-determining conversion to CDMS over 5 years, irrespective of treatment, in groups defined by annualized percentage CGM (a) or WB (b) change from baseline in placebo-treated patients. Analysis based on pooled data from placebo and active treatment groups (total population). Categorization of patients into three groups was based on the annualized percentage change from baseline in CGMV or WB in placebo-treated patients. Probability plots were derived from Kaplan–Meier estimates. CI was calculated using normal approximation. Hazards ratio was derived using Cox proportional hazard model with region, baseline monofocal/multifocal status, baseline CGM (for a) or WB (for b) and quartile categories of last available CGM (for a) or WB (for b) percent change from baseline annualized to year 1 as covariates.
Utility of CGM and WB atrophy versus MRI lesions as predictors of CDMS conversion
In Cox proportional hazard models of the CGM analysis population, development of CDMS was associated significantly with the cumulative number of new/enlarging T2 lesions per scan (HR = 1.25; p = 0.0003) but not with the cumulative number of Gd+ lesions per scan (HR = 1.01; p = 0.8869), or the annualized percentage change in CGMV (HR = 0.95; p = 0.3727). When new/enlarging T2 lesions, Gd+ lesions, and CGM atrophy were assessed separately for their ability to discriminate between patients who did or did not develop CDMS, the C-statistic for each parameter was poor (0.5638, 0.5641, and 0.5365, respectively). However, the combination of all three parameters in a single Cox model increased the predictive utility (C-statistic, 0.6831; Supplemental Table e-1).
Similarly, in Cox proportional hazard models of the WB analysis population, development of CDMS was associated significantly with the cumulative number of new/enlarging T2 lesions per scan (HR = 1.25; p = 0.0003), but not with the cumulative number of Gd+ lesions per scan (HR = 1.00; p = 0.9720) or the annualized percentage change in WBV (HR = 1.01; p = 0.7567). When new/enlarging T2 lesions, Gd+ lesions, and WB atrophy were assessed for their ability to discriminate between patients who did or did not develop CDMS, the combination of all three parameters had the highest predictive utility (C-statistic, 0.6872; Supplemental Table e-2) versus individual parameters.
Discussion
Identification of patients with CIS who are at high risk of conversion to CDMS is critical to facilitate early intervention and mitigate disease progression. Previously, teriflunomide was shown to delay conversion to CDMS in patients with CIS, but effects on brain atrophy were not detected with methods used at the time. 13
The present study assesses teriflunomide effects on brain atrophy in patients with CIS using a well-established MRI analysis technique for detecting longitudinal brain volume changes with a low error rate (SIENA), which has been used previously to show reduction in brain volume loss in teriflunomide-treated patients with relapsing MS. 14 We observed that teriflunomide significantly slowed CGM and WB atrophy over years 1–2 of the TOPIC study compared with placebo. Teriflunomide 14 mg significantly reduced CGMV and WBV change at all time points compared with placebo from baseline to year 2. Results for teriflunomide 7 mg were significant only at the 18- and 24-month timepoints. These data are consistent with previous studies showing greater overall efficacy of the 14-mg dose compared with the 7-mg dose. 13 CGM and WB atrophy was increased in patients with Gd+ lesions at baseline compared with patients without Gd+ lesions at baseline, suggesting those patients had more aggressive disease. Alternatively, it is possible that resolution of inflammation after treatment initiation led to a higher pseudoatrophy effect. Numerical reductions in CGM and WB atrophy with teriflunomide versus placebo were apparent in both subgroups, although many comparisons did not reach statistical significance, potentially due to small numbers of patients in the subgroups and the relative resistance of CGM to pseudoatrophy compared with WB as we have previously shown. 15
Collectively, these results extend previous findings of a reduction in brain atrophy with teriflunomide in patients with relapsing MS to those patients with CIS, and align with new data suggesting that teriflunomide-treated MS patients had slower rates of whole brain, GM, WM, and thalamic atrophy over 12 months versus age- and sex-matched healthy controls.14–16,21 Moreover, compared with dimethyl fumarate, a recent head-to-head study suggested that teriflunomide had a superior effect on the preservation of CGM and WB volume over 15−24 months.15,16
We also found that slower rates of CGM and WB atrophy in years 1–2 of the TOPIC study were associated with a lower risk of conversion to CDMS over the 1–2 and 1–5-year timeframes. For every 1% decrease in CGM, the risk of CDMS conversion increased by 14.5% (years 1–2) and 6.6% (years 1–5), while for every 1% decrease in WB, the risk of CDMS conversion increased by 47.3% (years 1–2) and by 35.9% (years 1–5).
The increase in CDMS risk during years 1–5 was significant only for WB, not CGM. This may suggest a nonlinear relationship between CGM atrophy and CDMS conversion, such that patients above a certain threshold of CGM loss have an increased risk of conversion. In the categorical analysis, patients with the least CGM and WB atrophy were significantly less likely to convert to CDMS compared with patients with the most CGM and WB atrophy, both during years 1–2 and during years 1–5. Together with the primary finding from TOPIC that teriflunomide decreases the risk of conversion to CDMS, 13 these findings highlight the clinical relevance of CGM atrophy in patients with CIS and link it to longer-term effects on conversion to CDMS. These results align with previous findings of an association between early GM atrophy and long-term disability accumulation and cognitive impairment.3–5
A prediction model showed that CGM or WB atrophy was not, by itself, a significant predictor of CDMS conversion. However, when combined with the number of Gd+ lesions and new/enlarging T2 lesions in a single model, predictive utility increased, suggesting that simultaneous consideration of all three parameters in patients with CIS can have clinical application in predicting risk for developing CDMS. Perhaps consistent with this, a new subtype of MS, referred to as myelocortical MS, was recently identified and is characterized by demyelination of spinal cord and cortex in the absence of cerebral WM demyelination. 22
In this study, CGM atrophy was assessed using SIENAX-MTP, an MRI image analysis technique that allows for longitudinal quantification of GM and WM atrophy. 17 Similar to Jacobian integration and other inherently longitudinal techniques, this method links analyses between time points in one unified statistical model, rather than analyzing each image independently. 23 This allows for improved precision, which is particularly important for regions like the cortex that experience substantial partial voluming even on high-resolution MRI – a technique that has been shown to reduce classification errors between time points, decrease SD of longitudinal percentage volume changes, and improve effect size in detection of GM atrophy up to 68% compared with cross-sectional approaches.17,24
This analysis has certain limitations that should be taken into account when interpreting the findings. First, the data set was not powered for these post hoc analyses. Second, in TOPIC, patients were diagnosed as having CIS or MS based on the 2005 McDonald criteria, which were in use at the time the core study was conducted (2008–2012). 19 Since then, there have been two additional revisions of criteria, one in 2011, 20 and a most recent one in 2017. 25 In these revisions, diagnosis of MS could be made in patients with CIS with only one MRI scan, which is key to earlier diagnosis and subsequent therapeutic intervention that could slow disease progression. 26 Thus, under current diagnostic guidelines (McDonald criteria, 2017 revision), 25 some patients initially classified as having CIS would have been diagnosed with MS. However, it should be noted that the efficacy of teriflunomide in patients with CIS was confirmed when TOPIC data were reanalyzed using 2010 McDonald criteria, suggesting that the TOPIC population may still be representative of a contemporary CIS population.20,27 A third limitation is that the associations between CGM atrophy and conversion to CDMS were determined using data from pooled treatment arms (teriflunomide and placebo), potentially confounding the association. Fourth, although treatment was considered as a covariate in the analysis, both transitioning from placebo to active drug after year 2 and the unblinding of patients could have impacted the findings. Fifth, following the original analysis, region was not considered as a covariate in the ANCOVA model. 14 Sixth, thalamus and other deep GM structures were not considered in this analysis. As thalamic atrophy is also associated with the development of CDMS, 11 future analyses should explore the effect of teriflunomide on deep GM and the relationship between atrophy of those structures and conversion to CDMS. Finally, short-term pseudoatrophy may have had a confounding effect in the evaluation of the results. However, the fact that there was already significant difference of teriflunomide 14 mg in slowing down loss of brain volume versus placebo in the first 6 months would argue against this hypothesis. Similar results were found in the TEMSO trial, where teriflunomide showed a significant decrease in brain volume loss compared with placebo, with no significant pseudoatrophy effect. 28
This is the first study to assess the effect of teriflunomide on CGM and WB atrophy in patients with CIS, and expands on the role that early CGM and WB atrophy play in MS disease progression. The findings support the clinical relevance of CGM and WB atrophy and early treatment with teriflunomide in patients with CIS.
Supplemental Material
Table_e-1 – Supplemental material for Slowing of brain atrophy with teriflunomide and delayed conversion to clinically definite MS
Supplemental material, Table_e-1 for Slowing of brain atrophy with teriflunomide and delayed conversion to clinically definite MS by Robert Zivadinov, Michael G. Dwyer, Ellen Carl, Elizabeth M. Poole, Steve Cavalier, Paraskevi Briassouli and Niels Bergsland in Therapeutic Advances in Neurological Disorders
Supplemental Material
Table_e-2 – Supplemental material for Slowing of brain atrophy with teriflunomide and delayed conversion to clinically definite MS
Supplemental material, Table_e-2 for Slowing of brain atrophy with teriflunomide and delayed conversion to clinically definite MS by Robert Zivadinov, Michael G. Dwyer, Ellen Carl, Elizabeth M. Poole, Steve Cavalier, Paraskevi Briassouli and Niels Bergsland in Therapeutic Advances in Neurological Disorders
Footnotes
Acknowledgements
The authors thank the patients, their families, and all investigators involved in this study. The manuscript was reviewed for scientific accuracy by Darren P. Baker, and Jonathan Valenzano, of Sanofi, Cambridge, MA, USA. Statistical analysis was carried out by Elizabeth M. Poole, of Sanofi. Additional statistical support was provided by Karthinathan Thangavelu, of Sanofi. Editorial support was provided by Eloquent Scientific Solutions and was funded by Sanofi. The sponsor was involved in the study design, collection, analysis, and interpretation of data, as well as verification of the data presented in the manuscript. The authors had unrestricted access to study data, were responsible for all content and editorial decisions, and received no honoraria related to the development of this publication. The authors are grateful to the following co-investigators for their help with the study: Aaron Miller, John King, Richard Macdonell, Caron Chapman, Cameron Shaw, Bruce Taylor, Eva-Maria Maida, Thomas Berger, Gerhard Ransmayr, Marin Daskalov, Milena Milanova, Paraskeva Stamenova, Ivan Staikov, Ekaterina Titianova, Dimitar Maslarov, Hristo Lilovski, Mark Freedman, Francois Grand’Maison, Marcelo Kremenchutzky, Paul O’Connor, Jean-Pierre Bouchard, François Evoy, Charles Ayotte, Liesly Lee, Pablo Venegas, Nelson Barrientos, Gustav Rohde, Cristian Luco, Ivan Rektor, Radomir Talab, Jan Mares, Olga Zapletalova, Thor Petersen, Egon Stenager, Katrin Gross-Paju, Juha-Pekka Erälinna, Tuula Pirttilä, Mikko Kallela, Pierre Clavelou, Christine Lebrun Frenay, William Camu, Philippe Damier, Sandrine Wiertlewski, Jérôme De Seze, Patrick Vermersch, Eric Berger, Lucien Rumbach, Marc Debouverie, Pierre Labauge, Patrick Oschmann, Martin Berghoff, Martin Marziniak, Hans Diener, Armin Grau, Jörg Von Schrader, Klaus Jendroska, Eckart Lensch, Gerd Reifschneider, Klaus Tiel-Wilck, Gyula Pánczél, Gábor Jakab, László Bartos, Zita Kovács, Mária Sátori, Rasa Kizlaitiene, Lina Malciene, Sigla Sceponaviciute, Juan Jose, Lopez Prieto Jose Ruiz, Anna Kaminska, Hubert Kwiecinski, Anna Czlonkowska, Jerzy Kotowicz, Adam Stepien, Waldemar Fryze, Andrzej Glabinski, Marina Ticmeanu, Ioan Marginean, Ovidiu Bajenaru, Lacramioara Perju-Dumbrava, Mihaela Simu, Alexander Gustov, Irina Sokolova, Farit Khabirov, Anna Belova, Yury Trinitatsky, Miroslav Odinak, Denis Sazonov, Egemen Idiman, Husnu Efendi, Muhtesem Gedizlioglu, Yahya Celik, Ayse Kocaman, Ayşe Nur Yüceyar, Balcı Belgin Petek, Nerses Bebek, Mefkure Eraksoy, Zeki Agca, Ulku Turk Boru, Recai Turkoglu, Vildan Altunayoğlu, Cavit Boz, Volodymyr Golyk, Olena Moroz, Ganna Rusina, Nataliya Buchakchyyska, Sergii Moskovko, Valentyna Yavorska, Yanosh Sanotskyy, Volodymyr Lebedynets, Serhiy Kareta, Larysa Sokolova, Lytvynenko Nataliya, Elena Statinova, Mykola Potolochnyy, Benjamin Turner, Sian Price, David Barnes, Nikos Evangelou, David Bates, David Rog, John Zajicek, Carolyn Young, Edward Fox, James Stevens, William Honeycutt, Alireza Minager, Lawrence Goldstick, Teresa Tracy DeAngelis, Fred Lublin, Angela Applebee, Robert Hamill, Hillel Panitch, Florian Thomas, Craig Herrman, Hemanth Rao, Stephen Flitman, Bradley Evans, Corey Ford, Alberto Vasquez, Denise Campagnolo, Christopher Glisson, David Kaufman, Tamara Miller, Pavle Repovic, Christopher Laganke.
Author contributions
RZ, MGD, EC, SC, NB: Design and conceptualized study; data acquisition; interpreted the data; revised the manuscript for intellectual content. EMP: Design and conceptualized study; data analysis; interpreted the data; revised the manuscript for intellectual content. PB: Revised the manuscript.
Conflict of interest statement
RZ reports speaking and consultant fees from Bristol Myers Squibb, EMD Serono, Sanofi, Keystone Heart and Novartis; member of the editorial boards of Journal of Neuroimaging, BioMed Research International, BMC Medicine, Clinical CNS Drugs, and Veins and Lymphatics; and reports financial support for research activities from Bristol Myers Squibb, Sanofi, Keystone Heart, Mapi Pharma, V-VAWE Medical, Novartis, and Protembis. MGD reports being a member of a scientific advisory board for EMD Serono and institutional grant support from Celgene and Novartis; he is a member of the editorial board of Journal of Neuroimaging. EC reports no disclosures. EMP is a former employee of Sanofi that reported receiving personal compensation during study conduct and analysis. SC is a former employee of Sanofi with ownership interest. PB is an employee of Eloquent Scientific Solutions. NB is a member of the editorial board of PLOS One, Journal of Neuroimaging, and Journal of Magnetic Resonance Imaging.
Funding
The authors disclosed receipt of the following financial support for the research, authorship, and/or publication of this article: This study and the development of the manuscript were supported by Sanofi.
Supplemental material
Supplemental material for this article is available online.
References
Supplementary Material
Please find the following supplemental material available below.
For Open Access articles published under a Creative Commons License, all supplemental material carries the same license as the article it is associated with.
For non-Open Access articles published, all supplemental material carries a non-exclusive license, and permission requests for re-use of supplemental material or any part of supplemental material shall be sent directly to the copyright owner as specified in the copyright notice associated with the article.