
Abstract
Brain imaging is increasingly used to support clinicians in diagnosing multiple sclerosis (MS) and monitoring its progression. However, the role of magnetic resonance imaging (MRI) in MS goes far beyond its clinical application. Indeed, advanced imaging techniques have helped to detect different components of MS pathogenesis in vivo, which is now considered a heterogeneous process characterized by widespread damage of the central nervous system, rather than multifocal demyelination of white matter. Recently, MRI biomarkers more sensitive to disease activity than clinical disability outcome measures, have been used to monitor response to anti-inflammatory agents in patients with relapsing–remitting MS. Similarly, MRI markers of neurodegeneration exhibit the potential as primary and secondary outcomes in clinical trials for progressive phenotypes. This review will summarize recent advances in brain neuroimaging in MS from the research setting to clinical applications.
Introduction
In the last decade, magnetic resonance imaging (MRI) has emerged as a fundamental imaging biomarker for multiple sclerosis (MS). Currently, MRI plays a key role in several aspects of the disease including diagnosis, 1 prognosis 2 and treatment response assessment. 3
Over the last few years, developments in brain imaging acquisition and post-processing have advanced the field and have made tremendous contributions to our understanding of disease-specific pathogenetic mechanisms. 4 This has improved the accuracy of MS diagnosis and differentiation from other inflammatory diseases of the central nervous system (CNS). 5 Furthermore, promising imaging biomarkers are now used to reflect pathological processes occurring in progressive MS. 6 This has culminated in the recent use of advanced imaging technique measures as outcomes in phase II and III MS clinical trials of disease-modifying and neuroprotective therapies. 7
There is expanding scientific literature on brain imaging in MS. Therefore, we constrained our review to the clinical advances in human brain MRI achieved over the last 5 years in the MS field. Although positron emission tomography (PET) 8 and optical coherence tomography (OCT) 9 are currently emerging as key tools in the understanding of MS pathophysiology and in monitoring the disease, these neuroimaging techniques were not included in our search criteria.
The aim of this review was to describe advances in brain MRI imaging used to support the diagnosis of MS and to characterize the pathological mechanisms underlying clinical activity and progression. Finally, we intended also to present the recent impact of these advances on clinical trials in MS. For these purposes, the review was conducted using literature from Embase and PubMed using the following keywords: multiple sclerosis; magnetic resonance imaging; brain; pathogenesis; diagnosis; progression. As regards clinical trials, we focused on completed phase II and III trials in relapsing–remitting MS (RR-MS) or progressive MS using clinical trials databases, such as ClinicalTrials.gov and ClinicalTrialsRegister.eu.
Recent advances in neuroimaging considering different brain locations are listed in Figure 1.
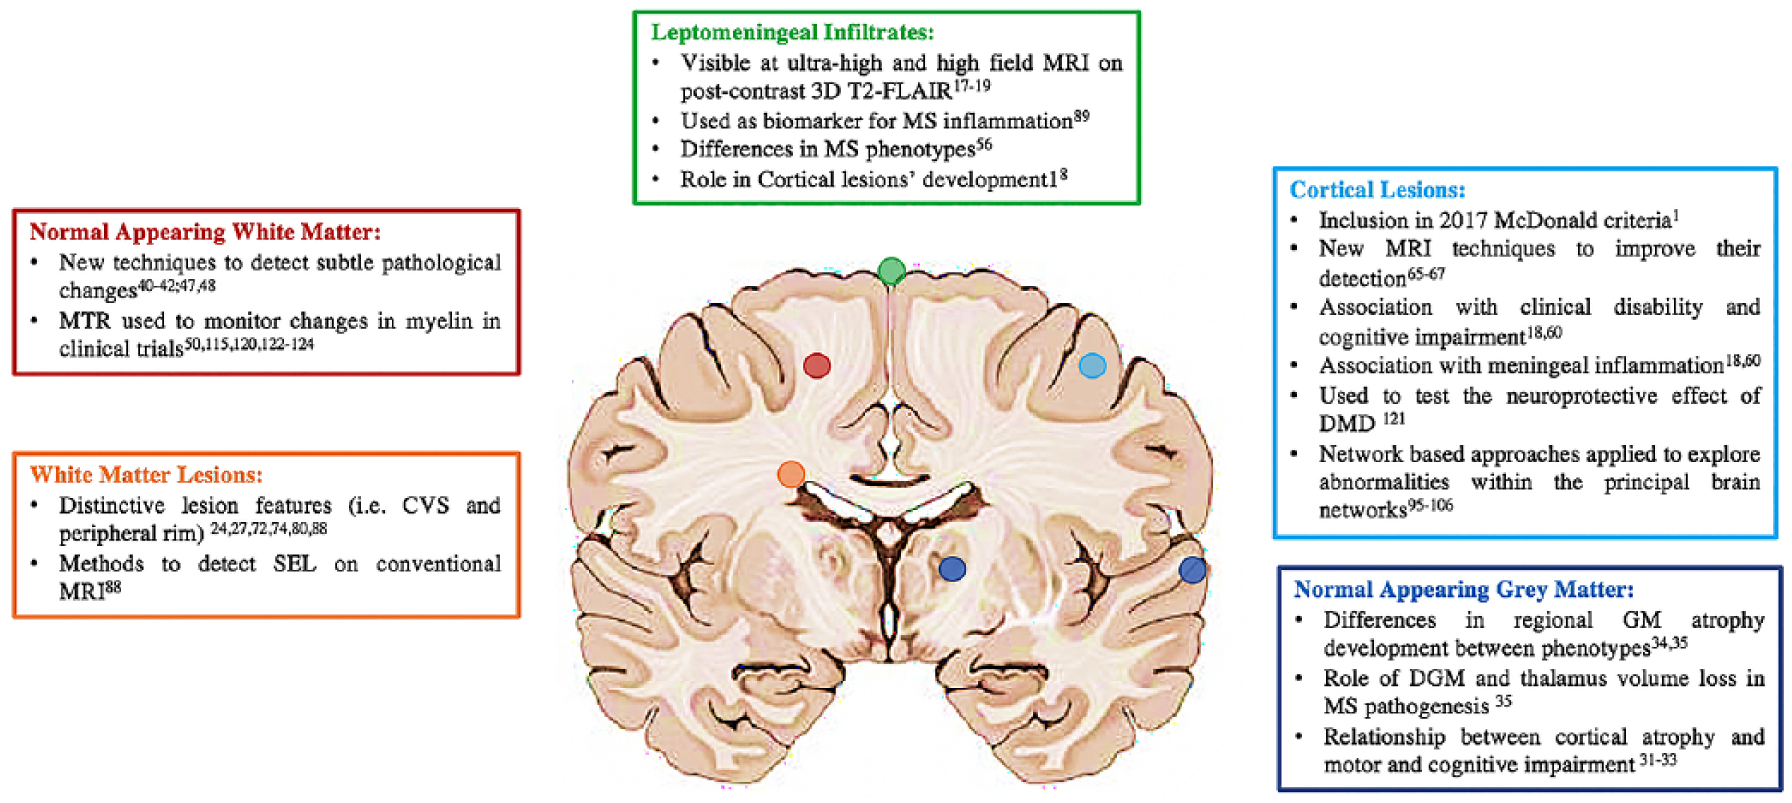
Advances in brain imaging in multiple sclerosis in different brain locations.
Advances in understanding disease mechanisms
Considered originally as the focal demyelination of white matter (WM), 10 MS pathology is now understood to result from heterogeneous processes causing both focal and widespread damage in the entire CNS. These pathologies result from a dynamic cascade of inflammation (e.g. cell infiltration and microglial activation), demyelination and neurodegeneration (axonal and neuronal loss) occurring in varying degrees during the course of MS. 11 The use of advanced imaging techniques has contributed to our understanding in vivo of these different pathogenic components.
Early pathological studies showed that inflammation in MS is characterized by immune cell infiltrates, particularly lymphocytes and plasma cells, found around demyelinated lesions. 12 In vivo, the most frequently used MRI measure to estimate inflammatory activity has been the presence of T1 gadolinium-enhancing WM lesions, indicating a breakdown of the blood–brain barrier in the CNS. However, gadolinium enhancement reflects only focal and transient inflammation of the WM. 13 It is now recognized that these infiltrates are present not only in active lesions but also, albeit to a lesser extent, in chronic WM lesions, in normal-appearing WM and in grey matter (GM). 14 These immune cell infiltrates, particularly lymphocytes and plasma cells, can be present in the leptomeninges,15,16 where they aggregate with features of tertiary lymphoid tissue, ectopic lymphoid follicle-like structures (ELFs). ELFs appear to drive cortical damage, particularly demyelination and neuroaxonal loss. Recent advances in brain imaging have allowed the in vivo study of these aggregates by detecting foci of leptomeningeal contrast enhancement (LME). Several studies have employed postcontrast three-dimensional (3D) T2-fluid-attenuated inversion recovery (FLAIR) MRI acquired at least 10 minutes after intravenous gadolinium administration.17–19 Interestingly, LME was more prevalent in patients with progressive MS than RR-MS and was related to cortical atrophy at 5 years and high disability.20,21 Furthermore, LME persisted over time in patients, even with disease-modifying treatments. 20 In conclusion, LME can represent a potential biomarker for inflammation in the different MS subtypes. It can be demonstrated using delayed postcontrast 3D T2-FLAIR and a recent study showed that subtraction imaging can improve its accuracy and reduce the acquisition time, making it suitable for the clinical use.
Previously, immunological research in MS focused on the adaptive immune system; however, there has been recent interest in the innate immune system, which is emerging as a major contributor to disease pathogenesis. 22 In particular, monocytes and brain microglia can switch between proinflammatory and regulatory phenotypes contingent on environmental factors, thereby influencing demyelination, neurodegeneration, and remyelination. 23 WM lesions surrounded by an inflammatory rim of activated microglia and macrophages seem to show chronic inflammatory activity. 24 This can be visualized with susceptibility weighted imaging in the form of iron deposits. 25 The recent introduction of an ultra-high-field MRI scanner and an automated method for their detection are allowing better characterization of this phenomenon.26,27
Neurodegeneration affects the CNS in MS from its earlier stages, characterized by axonal loss in the WM and neuronal death in the GM. 28 It is related to disability progression and particularly during the progressive stage of the disease, determines tissue loss and atrophy. 29 A precise understanding of the mechanisms of neurodegeneration in progressive MS is an essential prerequisite for achieving therapeutic progress. Structural MRI can reflect neurodegeneration, usually measured by calculating brain volume, which is believed to reflect irreversible tissue damage and brain atrophy, or measures of cortical thickness, which reflects the integrity of GM.
MRI-derived measurement of percentage brain volume changes (PBVCs), 30 from registration-based techniques, is considered the most robust method to assess brain atrophy and it has been widely used to quantify neurodegeneration in MS; however, in the last few years, challenges for measurement and interpretation of GM atrophy in MS have emerged. 31
Concerning the methodological challenges, one of the main issues relates to the translation of brain volume loss measurements from group-level analyses in the research setting to the individual patient in the clinical practice. Approaches taking into account the within-patient fluctuation have been developed 32 as well as cutoffs that could be used in the future in clinical practice. 33
When interpreting this measure, it should be noted that GM atrophy is not specific to the pathological events underlying it and, additionally, in the early stage of the disease, atrophy may not yet be easily detectable, but neuroaxonal loss may have already started. 14 Therefore, over the last few years, studies have focused on neuroaxonal loss in specific GM regions as well as on advanced MRI techniques able to provide insight into the pathological substrates of GM atrophy.
A recent MRI study in a large cohort of patients with MS at different stages of the disease used a data-driven approach to show that GM regions become atrophic in a specific sequence across different MS phenotypes. 34 Furthermore, deep GM appears to drive disability progression. 35
Other MRI techniques have been used to detect pathogenetic processes associated with neurodegeneration. For example, molecular and metabolic MRI metrics can reflect changes such as mitochondrial dysfunction. Activated microglia and macrophages produce reactive oxygen species and nitric oxide that could induce mitochondrial injury eventually leading to toxic calcium influx and neuronal cell death. 36
Over the last decade, proton magnetic resonance spectroscopy (1H-MRS) has been used to explore in vivo the role of mitochondrial dysfunction and specific recommendations for its use have been provided by the MAGNIMS (Magnetic Resonance Imaging in MS) European network. 27 The concentration of N-acetylaspartate (NAA) has been used to estimate neuronal energy metabolism in the CNS; it is decreased after acute injury and then can partially recover. 37 1H-MRS has been also used to evaluate the contribution of other metabolites to neurodegeneration in MS. In particular, glutamate toxicity, as detected by an increase in glutamate concentration, was found to be related to brain volume loss and disability accrual, 38 while a decrease in gamma-aminobutyric acid levels, possibly upregulating axonal firing, correlated with decreased motor function in progressive MS patients. 39
More recently, another metabolic imaging technique has emerged to assess mitochondrial dysfunction. Intracellular sodium increase is one of the key steps in the cascade leading to energy failure in neuronal cells. 40 Sodium imaging, by estimating total sodium concentration (TSC) in the brain of patients with MS can provide an indirect estimate of neuroaxonal dysfunction preceding neurodegeneration. Initially, with this technique, it was not possible to distinguish between intracellular accumulation and increases in the extracellular component (where sodium is present in higher concentration), for phenomena such as edema or neuroaxonal loss.41,42 Recently though, using a novel method, Fleysher and colleagues 43 were able to directly quantify intracellular sodium concentration by measuring TSC and intracellular sodium molar fraction at ultra-high-field MRI (7T) in healthy people. A recent study 44 applied this technique to an MS cohort and healthy controls. It showed that in the normal-appearing WM and GM of patients with MS there was an increased intracellular sodium concentration and a concomitant decrease in the intracellular sodium volume fraction compared with healthy controls. This suggests that neuroaxonal dysfunction coexists with possible expansion of the extracellular space and provides further insights into MS metabolic pathogenetic mechanisms.
Diffusion-weighted imaging (DWI) characterizes the microscopic Brownian motion of water molecules in biological tissues and can be used to investigate the tissue microstructure. The standard technique used to investigate CNS pathology has been a form of DWI, diffusion tensor imaging (DTI). However, the DTI model oversimplifies the diffusive behavior of water in complex media and its metrics lack the sensitivity and specificity to subtle pathological changes taking place in MS. 45 New DWI models have been developed to overcome these limitations. Neurite orientation dispersion and density imaging (NODDI) is a multi-compartment model developed in 2012 by Zhang and colleagues 46 that enables the estimation of more specific indices, such as neurite density, orientation, and a free-water [cerebrospinal fluid (CSF)-like] component. NODDI has shown higher specificity and sensitivity to neurodegeneration compared with DTI measurements in MS.47,48
Magnetization transfer (MT) imaging is utilized to measure myelination and tissue damage by estimating interactions between free water molecules and the CNS macromolecules, such as the lipids in myelin. The MT ratio (MTR) is a semi-quantitative measure of the MT effect and it changes with myelin and axonal content. In MS, MTR can help to detect signs of WM damage beyond demyelinating lesions. 49 Patients with MS have lower MTR in normal-appearing WM than healthy controls and patients with secondary progressive MS (SP-MS) seem to have lower MTR than patients with RR-MS. These structural abnormalities are greater near the ventricles, potentially supporting CSF or ependymal-mediated pathogenesis.50,51
The pathological specificity of MTR is limited since the signal can be influenced by water content (i.e. edema, inflammation) as well as activated microglia. MTR indices are also dependent on differences in acquisition and scanner parameters. Recent developments in quantitative MT (qMT) methods attempt to reduce these confounding influences by providing more tissue-specific indices. 52 Another promising technique is inhomogeneous magnetization transfer (ihMT) 53 which appears to be specific to CNS lipids, which enrich myelin. Myelin water imaging (MWI) is another MRI technique designed to detect myelin alterations. 54 It is based on the assumption that T2 relaxation times of water depend upon the physical size of the water environment; when water is tightly confined it exhibits a shorter T2. Histologically a strong correlation has been demonstrated between myelin water fraction (MWF) and myelin staining, supporting MWI as a potential in vivo biomarker for demyelination. MWI has demonstrated the evolution of demyelination and remyelination processes in MS plaques 55 and diffuse alterations in the normal-appearing WM. 49 A recent study has employed MWF to monitor possible changes in myelin in patients with MS after 24 months of alemtuzumab; however, no changes in MWF were found in the lesions nor in normal-appearing WM. 56
Advances in MS diagnosis and differential diagnosis
MRI has become a key investigation for diagnosing MS at an early stage. It can provide evidence of dissemination in space and time (DIT) in patients with clinically isolated syndrome (CIS) and assist in excluding other conditions. In 2016, modifications to the MRI diagnostic criteria were validated by MAGNIMS and they guided revisions of the McDonald criteria. 57 Changes to the MRI criteria, which were incorporated into the 2017 McDonald criteria, included combining cortical and juxtacortical lesions and removing the distinction between symptomatic and asymptomatic lesions. Suggestions were also provided to refine future iterations of the criteria for example, incorporation of lesion characteristics such as presence of the central vein sign (see below), researching optic nerve involvement, advanced imaging neurophysiological and body fluid markers. 1
Cortical lesions are well described as distinctive features of MS 58 and they have also been detected in patients with paediatric-onset MS, supporting the concept of early cortical involvement in the disease.59,60 In MS, recent MRI studies suggest an association between leptomeningeal inflammation and subpial cortical demyelination. Leptomeningeal inflammatory infiltrates can be visualized with delayed high-resolution postcontrast T2-FLAIR MRI, closely associated with subpial demyelination and cortical atrophy. They show high prevalence in progressive patients (33% in SP-MS versus 19% in RR-MS) and tend to remain stable over time.18,21,61 Although cortical lesions can be seen in some systemic autoimmune disorders, such as systemic lupus erythematosus 62 and some inherited leukodystrophies 63 they are typically absent in other neurological disorders that can mimic MS at disease onset, such as neuromyelitis optica spectrum disease (NMOSD). 64
However, conventional MRI currently has limited ability to detect both cortical lesions and meningeal inflammation or distinguish cortical lesions in MS from those with other causes. Other MRI techniques have been proposed to improve cortical lesion detection, including double inversion recovery, 65 phase-sensitive inversion recovery 66 and magnetization-prepared rapid acquisition with gradient echo.67,68
The evidence that the inclusion of symptomatic lesions in patients with CIS with brainstem or spinal cord onset increase the sensitivity with little or no reduction in specificity of the diagnostic criteria69,70 led to simplification of the MRI diagnostic criteria removing this distinction between symptomatic and asymptomatic lesions.
The identification of distinctive imaging features for MS can help to differentiate it from alternative diagnoses when MS is suspected. The presence of a white matter lesions (WML) central vein, identified as a hypointensity relative to the surrounding lesion on T2* or FLAIR* images and known as the central vein sign (CVS), is more characteristic of MS lesion. 71 This represents the imaging equivalent of perivenous inflammatory demyelination, a histopathologic finding that is relatively specific for MS-related WM lesions. 72 Over the past few years, high-field MRI has demonstrated a higher frequency of MS lesions with the CVS when compared with WM lesions seen in NMOSD, 73 inflammatory vasculopathies, 74 migraine75,76 and microangiopathic disease. 77 Based on these studies, a cutoff threshold of 40% (where ⩾40% of WM lesions demonstrate the CVS) has been proposed to distinguish MS from non-MS disease 78 and more recently, a simpler set of diagnostic rules for CVS was introduced such as the ‘rule of 6’, where if more than 6 WM lesions demonstrate the CVS, MS can be distinguished from other WM disorders.77,79
Recently, it has been shown that the CVS can be detected even on more widely available 1.5T MRI scans with indistinguishable results when compared with 3T. 74
However, although promising as a distinctive MRI feature for MS, there is a need to identify standardized imaging protocols to make the detection of the CVS clinically and routinely available. 71
Nonconventional MRI techniques more sensitive and specific to pathological mechanisms in MS could provide additional information and new markers to make the diagnosis of MS more accurate and to improve the differential diagnosis. For example, MRI shows promise as a tool for the noninvasive staging of lesions 80 and may add information about their chronicity beyond the presence or absence of gadolinium enhancement, which at the moment is the only available MRI feature that can help to demonstrate DIT at the time of first assessment. 1 Recently, Absinta and colleagues demonstrated that the paramagnetic rims in nonenhancing lesions on susceptibility imaging at 3T, can identify so called ‘chronic active’ lesions and suggested the implementation of the rims for MS diagnosis. 27 Second, the inclusion in a clinical setting of MRI sequences able to detect brain atrophy, especially in the cortical GM and thalamic changes can be useful to differentiate MS from its mimics.81,82 These GM measures obtained from clinical MRI scans can distinguish MS from NMOSD using machine learning algorithms. 83 However, because of several technical issues, these techniques are not yet available in clinical practice. 84
Finally, in patients with a suspected acute demyelinating event such as acute disseminated encephalomyelitis (ADEM), optic neuritis, NMOSD or a CIS, an earlier interval brain MRI scan may help to distinguish MS from other demyelinating conditions, such as myelin antibody glycoprotein (MOG)-associated disease. In a paediatric cohort, WM signal changes on conventional MRI completely resolved in 58.8% seropositive patients with MOG after the first clinical event, some of them with a follow-up study within the first month already showing a dramatic improvement. 85 Therefore, in selected cases, MRI would support a diagnosis of MOG-associated disease even before receiving the results of MOG antibody testing with the consequence that appropriate immunosuppressive therapy can be commenced; however, this requires further validation in larger cohorts including adult patients.
Advances in monitoring MS progression
Conventional brain imaging is increasingly used to support clinicians in monitoring the progression of MS. 6 In early MS, the radiological picture is characterized by the development of new WM lesions, as markers of inflammation and active demyelination. A higher number of WM lesions at disease onset and the increase in lesion volume over the first 5 years after CIS increases the risk of clinically definite MS and worse disability in studies on large multicenter cohorts with long-term follow up.86,87 In contrast, in progressive MS, new active lesions are rare, but pre-existing T2 lesions may show slowly expanding lesions (SELs), reflecting tissue loss in the absence of ongoing acute inflammation, revealed by the presence of a rim of iron-containing cells at the lesion border, thought to represent activated microglia/macrophages. 80 This iron rim at the edge of MS lesions is predominantly seen in SELs, less frequently in inactive lesions, not seen in active and hardly in remyelinated lesions. 88 Recently, Elliot and colleagues developed a method for the automatic detection of SELs on conventional brain MRI and suggested SELs as a potential imaging biomarker for chronic inflammation in MS. 89
In MS, GM atrophy helps to drive the progressive loss of brain volume. 90 Global cortical atrophy is more evident in the progressive forms of the disease, and correlates with clinical disability (both motor and cognitive components) in cross-sectional and longitudinal studies.87,90 A recent study, demonstrated that atrophy does not follow the same spatiotemporal pattern in all MS phenotypes and that temporal cortical GM shows accelerated atrophy in the SP-MS phenotype. 34 The demyelination of deep grey matter (DGM) nuclei is also a pathological hallmark of the disease, reported by Eshaghi and colleagues on a large patient sample including all MS phenotypes with an average follow up of 2.4 years. Regional analysis of the GM atrophy rate revealed DGM nuclei atrophy as the main driver of disability accumulation (i.e. Expanded Disability Status Scale [EDSS] worsening). The DGM atrophy rate was higher in patients with progressive MS (both SP-MS and primary progressive MS) than in those with CIS and healthy controls. 35
Advanced MRI sequences, quantifying structural changes within and outside focal lesions in WM and GM, have been used to obtain information about disease progression. Longitudinal studies suggest that the magnetization transfer ratio (MTR) MRI has the potential to be used as a marker of progression in primary progressive MS: in patients with early primary progressive MS, lower normal-appearing WM MTR values at baseline predict progression of disability over 1 and 3 years. 91 DTI studies have reported more pronounced WM diffusion abnormalities in patients with SP-MS than in those with RR-MS. 92 Also, in progressive MS, DTI-derived parameters detected significant worsening over 1 year of follow up, with normal-appearing GM damage occurring independently of T2 lesions and brain atrophy. 93 The greater increase in diffusivity in progressive MS than in other phenotypes is thought to be due to a combination of axonal damage and demyelination widespread within WM and GM. Remyelination as a mechanism of tissue repair may explain the shrinking of lesions in longstanding MS, seen by Sethi and colleagues using proton density MRI sequences on conventional imaging. 94 However, the relationship between lesion contraction and clinical change over time requires further evaluation.
Over the last few years, network-based approaches have been developed to assess the dynamic relationships between network brain structure and function and clinical markers of disease using MRI-based connectomics. 95 With this technique, the brain is macroscopically modelled as a network of nodes connected by edges, from which various graph-related network metrics can be derived. Structural network-based techniques have used diffusion-weighted MRI to explore connection behavior between parcellated brain regions. A cross-sectional study comparing healthy controls with different MS phenotypes showed network alterations in MS, particularly in the SP-MS form. Interestingly, these changes in brain network metrics correlated with neurological and cognitive measures (i.e. EDSS and symbol digit modalities test) beyond conventional MRI metrics (i.e. atrophy measures and WM lesions). 96 Structural cortical thickness networks can also be derived and investigated using T1 volumetric imaging. For example, in patients with CIS who experienced a conversion to clinically definite MS within the first year, longitudinal changes in brain structural covariance networks (SCNs), which are based on the anatomical similarity at the group level between different cortical areas, were detected in the absence of cortical atrophy. These findings suggest that SCNs may reveal important features of GM dynamics, otherwise hidden. 97 Finally, functional MRI (fMRI) studies have investigated functional connectivity abnormalities within the principal brain networks in patients with MS, to provide clinically relevant information about MS pathology and to define the trajectory of changes over disease stages. 98 Resting-state fMRI (rsfMRI) has proved to be a powerful tool for studying whole brain neural connectivity by assessing the correlations of spontaneous fluctuations of blood oxygen level-dependent signals between different regions of the brain. 99 RsfMRI has identified a number of abnormal functional connectivity (FC) networks in patients with MS.100,101 In paediatric MS, increased resting-state FC was associated with a loss of WM microstructural integrity, suggesting a potentially compensatory activation in the early phases of the disease. 102 However, in adult patients with paediatric-onset MS with no or minimal disability, selective FC networks were reduced, which may reflect the exhaustion over time of a functional reserve. 103 In addition, decreased FC between thalamus and several cortical regions, while increased intra- and inter-thalamic connectivity in patients with MS have been identified which were independent from thalamic volume loss and could be a substrate for early cognitive change in patients with MS. 104 Finally, in the progressive forms of MS, resting-state FC abnormalities in the major brain networks, were found to be more pronounced and helped to explain the clinical manifestations of the disease, such as fatigue.105,106
Advances in clinical trials
Lesion-derived metrics are still the most frequently used primary outcomes in phase II trials and secondary outcomes in phase III trials when assessing disease-modifying treatments (DMTs) targeting inflammation. 7 These include the number of new or enlarged T2 lesions and the number of T1 gadolinium-enhancing lesions. T2 lesions assessed in different scans over time can capture the accumulation of inflammation better than T1 gadolinium-enhancing lesions, which are only transient. 13 New advances in imaging post-processing, such as image subtraction technique,107,108 are improving the reproducibility of the identification of T2 lesions. However, T2 WM lesions are not specific to inflammation, as they can also reflect axonal loss, demyelination, and remyelination. 109 Therefore, specific MRI outcomes related to inflammation are still needed.
As discussed, LME is emerging as a potential biomarker for inflammation in MS. Postmortem studies have shown that LME identified by MRI comprise meningeal vessel aggregates of lymphocytes and macrophages associated with subpial areas of cortical demyelination. 110 As the last decade has seen the development and approval of monoclonal antibodies targeting B-cells (rituximab, ocrelizumab, and ofatumumab), not only for RR-MS but also for progressive MS, dedicated and relevant imaging biomarkers such as LME could have a potential value in monitoring therapy efficacy.
To date, clinical trials of anti-CD20 antibodies in MS have used lymphocyte B levels in the serum and CSF to monitor pharmacological efficacy. A recent phase I trial 111 explored the effect of intrathecal rituximab in patients with progressive MS and postcontrast 3D T2-FLAIR was used to select patients with LME who were then selected for rituximab treatment and evaluated over 24 weeks. However, no change in LME following rituximab treatment was observed. This could reflect either the transient nature of B-cell depletion in the CSF caused by rituximab or LME may not sensitive to the changes caused by the drug. Further studies and histopathological correlations are still needed before this potential imaging biomarker can be used.
At present, brain atrophy is the most popular imaging biomarker used to assess neurodegeneration in clinical trials with DMTs in MS. 112 Recently, it has also been included in a combined index of the absence of disease activity together with the absence of new T2 or gadolinium-enhanced T1 lesions. 113 The PBVC 30 has been the most employed technique to quantify treatment effects on brain volume loss. 114 Regional metrics, such as WM and GM volumes, have been also used recently in clinical trials. 115 At the moment these procedures can be fully automated and they have good inter-centre reproducibility, 116 so they are used as outcomes in phase II and phase III clinical trials. However, brain atrophy measures can be influenced also by inflammation and edema and they are not specific to the substrate of neurodegeneration. 117
Only recently, some clinical trials have adopted advanced MRI techniques as possible outcomes of neurodegeneration. NAA concentration derived from 1H- MRS has been used 115 and phase II trials have used TSC 118 derived from sodium imaging and NODDI- derived 119 metrics that reflect microstructural changes in brain tissues.
Imaging outcomes specifically targeting demyelination/remyelination in MS clinical trials are scarce. Regional and whole brain MTR115,120–125 has been used in a few studies but has not achieved popularity.
However, there still remain challenges regarding the translation of the advances in MRI outcomes achieved in clinical trials to clinical practice. Even robust metrics, such as brain atrophy measured with registration-based techniques, may be affected by confounding factors related to image acquisition 126 and post-processing, 127 thus interfering with the clinical interpretation at an individual level.
Table 1 summarizes the most recent phase II and III clinical trials in MS using advanced imaging biomarkers as outcomes.
Advances in imaging outcomes in phase II and III clinical trials in multiple sclerosis.
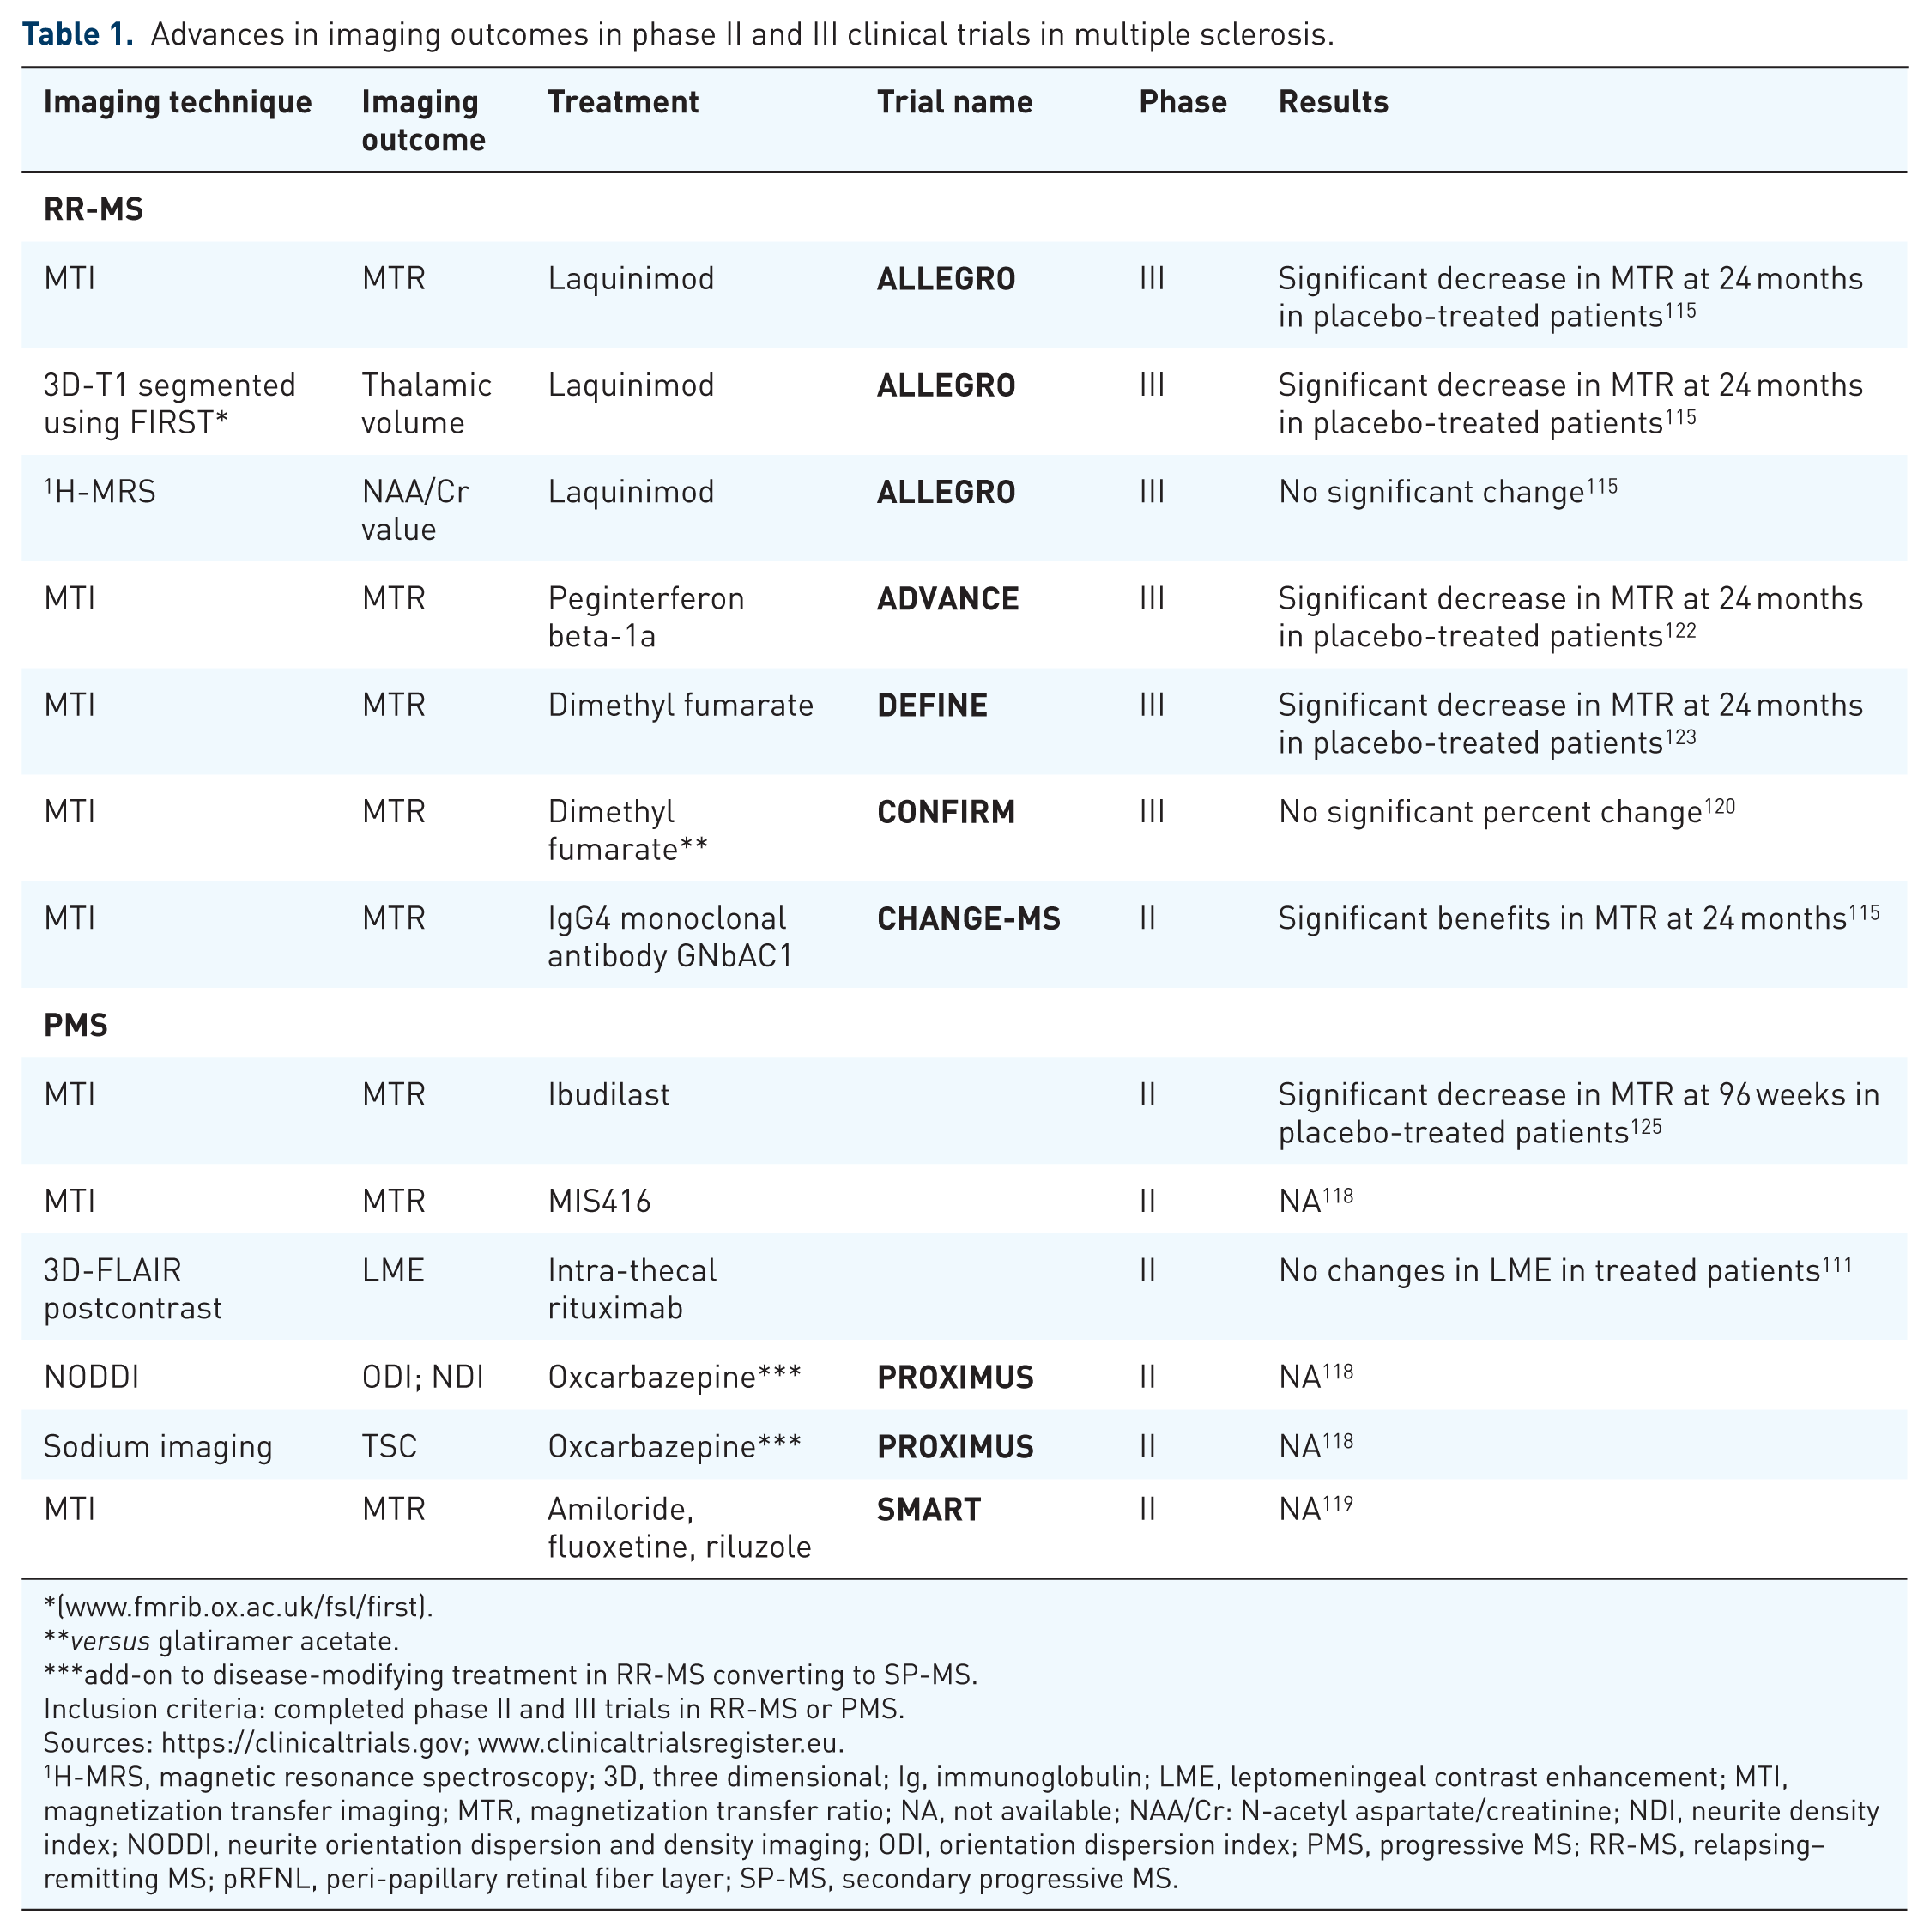
versus glatiramer acetate.
add-on to disease-modifying treatment in RR-MS converting to SP-MS.
Inclusion criteria: completed phase II and III trials in RR-MS or PMS.
1H-MRS, magnetic resonance spectroscopy; 3D, three dimensional; Ig, immunoglobulin; LME, leptomeningeal contrast enhancement; MTI, magnetization transfer imaging; MTR, magnetization transfer ratio; NA, not available; NAA/Cr: N-acetyl aspartate/creatinine; NDI, neurite density index; NODDI, neurite orientation dispersion and density imaging; ODI, orientation dispersion index; PMS, progressive MS; RR-MS, relapsing–remitting MS; pRFNL, peri-papillary retinal fiber layer; SP-MS, secondary progressive MS.
Conclusion and future directions
In recent years, advances in brain MRI have provided valuable contributions to the understanding of MS and promising MRI approaches have been developed that may be introduced into clinical practice in the near future. However, further research should be undertaken to make these changes feasible both in clinical and research settings, such as the standardization of parameters related to image acquisition, the development of clinically available detection methods for nonconventional MRI techniques and a better definition of criteria for the validation of distinctive MS lesion characteristics.
As a consequence of the advances described in this review, it is highly likely that in the near future, emerging imaging biomarkers could be promoted as a primary outcome in clinical trials and new techniques will translate to clinical practice, aiding the diagnosis and monitoring of MS.
Footnotes
Acknowledgements
Rosa Cortese and Sara Collorone contributed equally to this review.
Funding
The authors received no financial support for the research, authorship, and/or publication of this article.
Conflict of interest statement
RC has no conflict of interest. SC received an ECTRIMS-MAGNIMS fellowship in 2015. OC is a National Institute for Health Research (NIHR) research professor; is supported by the NIHR University College London Hospitals (UCLH) Biomedical Research Centre (BRC); has received grants from the UK MS Society, National MS Society, NIHR UCLH, BRC, Progressive MS Alliance, Bioclinica, GE Neuro, the EU, Spinal Cord Research Foundation, and Rosetrees Trust; has received personal fees from Novartis, Teva, Roche, Biogen, and Merck; and has received an honorarium from the journal Neurology. ATT has received speaker honoraria from Biomedia, Sereno Symposia International Foundation, Bayer and meeting expenses from Biogen Idec and is the UK PI for two clinical trials sponsored by MEDDAY pharmaceutical company [MD1003 in optic neuropathy (MS-ON) and progressive MS (MS-SPI2)].