
Abstract
Background:
Whole brain atrophy (WBA) estimates in multiple sclerosis (MS) correlate more robustly with clinical disability than traditional, lesion-based metrics. We compare Structural Image Evaluation using Normalisation of Atrophy (SIENA) with the icobrain longitudinal pipeline (icobrain long), for assessment of longitudinal WBA in MS patients.
Methods:
Magnetic resonance imaging (MRI) scan pairs [1.05 (±0.15) year separation] from 102 MS patients were acquired on the same 3T scanner. Three-dimensional (3D) T1-weighted and two-dimensional (2D)/3D fluid-attenuated inversion-recovery sequences were analysed. Percentage brain volume change (PBVC) measurements were calculated using SIENA and icobrain long. Statistical correlation, agreement and consistency between methods was evaluated; MRI brain volumetric and clinical data were compared. The proportion of the cohort with annualized brain volume loss (aBVL) rates ⩾ 0.4%, ⩾0.8% and ⩾0.94% were calculated. No evidence of disease activity (NEDA) 3 and NEDA 4 were also determined.
Results:
Mean annualized PBVC was −0.59 (±0.65)% and −0.64 (±0.73)% as measured by icobrain long and SIENA. icobrain long and SIENA-measured annualized PBVC correlated strongly, r = 0.805 (p < 0.001), and the agreement [intraclass correlation coefficient (ICC) 0.800] and consistency (ICC 0.801) were excellent. Weak correlations were found between MRI metrics and Expanded Disability Status Scale scores. Over half the cohort had aBVL ⩾ 0.4%, approximately a third ⩾0.8%, and aBVL was ⩾0.94% in 28.43% and 23.53% using SIENA and icobrain long, respectively. NEDA 3 was achieved in 35.29%, and NEDA 4 in 15.69% and 16.67% of the cohort, using SIENA and icobrain long to derive PBVC, respectively.
Discussion:
icobrain long quantified longitudinal WBA with a strong level of statistical agreement and consistency compared to SIENA in this real-world MS population. Utility of WBA measures in individuals remains challenging, but show promise as biomarkers of neurodegeneration in MS clinical practice. Optimization of MRI analysis algorithms/techniques are needed to allow reliable use in individuals. Increased levels of automation will enable more rapid clinical translation.
Keywords
Introduction
Multiple sclerosis (MS) is an autoimmune central nervous system disease characterized by both inflammatory and neurodegenerative processes. 1 In current MS clinical practice, magnetic resonance imaging (MRI) biomarkers of inflammatory disease activity exist in the form of newly gadolinium-enhanced T1 lesions, and new or enlarging T2 lesions.1,2 However, biomarkers of neurodegeneration, MRI or otherwise, are not used as part of the clinical routine. 2 MRI brain atrophy (BA) measurement is a widely studied, albeit imperfect, biomarker of neurodegeneration in MS 3 at the group level. Further investigation and optimization of MRI BA measurement techniques are warranted to assist with their translation into future MS clinical practice.
Whole brain volume loss (BVL) in patients with untreated MS is estimated, using Structural Image Evaluation using Normalisation of Atrophy (SIENA), to occur at a rate of 0.5–1.35% per year. 3 This is more rapid than in age-matched healthy individuals where the rate of BVL is 0.1–0.3% per year.3,4 The rate of BVL in MS patients treated with disease-modifying therapy (DMT) differs, depending on individual disease and treatment-related factors. 5 At the group level, increased rates of BVL in MS correlate with, and are predictive of, worse future physical and cognitive disability. 3 There is a growing literature focused specifically on grey matter (GM) volume loss, and at the group level, there is evidence that GM atrophy may, precede whole brain atrophy (WBA),6–8 and correlate more closely with disability than WBA. 8 However, there remains a paucity of longitudinal data focused on GM atrophy related at least in part to specific challenges associated with the currently available measurement techniques. 9
Numerous manual, semiautomated and fully automated algorithms capable of measuring whole brain volume (WBV) and atrophy from MRI scans have been developed over the past 2 decades. 10 SIENA is a freely available software tool [part of the Functional MRI of the Brain (FMRIB) Software Library (FSL); www.fmrib.ox.ac.uk] that is widely used by expert MRI reading centres to measure the percentage WBV change (PBVC) between two time points in MS studies.10–12 SIENA uses a registration-based algorithm to measure longitudinal PBVC between two MRI scans from the same subject.10–12 Longitudinal registration-based methods, such as SIENA, have a low measurement error (median 0.15–0.2%) and are robust to scan quality.3,11,13,14 SIENA has and continues to be used extensively in longitudinal MS studies, 5 but implementation in routine clinical practice is limited by the need for manual image preprocessing by trained image analysts and lack of a nonexpert user interface. SIENA is freely available, but not currently approved as a medical device in any jurisdiction.
Recent technological advances have made it possible to aim for brain volume and atrophy assessment methods that are fast, fully automated (minimal observer dependency), accurate, reproducible, and that are applicable to both clinical trial and routine clinical practice settings.15–19 icobrain (icometrix, Leuven, Belgium) is a fully automated, Conformité Européenne (CE)-marked and US Food and Drug Administration (FDA)-approved proprietary method that performs unsupervised tissue and lesion segmentation using 3D T1-weighted (T1) and fluid-attenuated inversion-recovery (FLAIR) MRI images.15–17 It is a commercial product supplied through icometrix, and was previously known as ‘MSmetrix’. The icobrain longitudinal pipeline (icobrain long) incorporates a Jacobian integration technique to facilitate longitudinal BA assessment. 17 Smeets and colleagues demonstrated that this technique has a low measurement error (median 0.13%) and in a cohort of 20 MS patients, the BA measures were highly comparable with SIENA, performed without prior lesion inpainting. 17
A study by Steenwijk and colleagues included a comparison of PBVC as measured by icobrain long with SIENA and the FreeSurfer 5.3 (http://surfer.nmr.mgh.harvard.edu, Laboratory for Computational Neuroimaging, Charlestown, United States of America) longitudinal pipeline, in 50 MS patients with a mean follow up time of 4.92 (±0.95) years. 20 The authors commented on significant differences between measurement techniques and made particular note of proportional errors. icobrain long was found to best agree with SIENA in terms of PBVC measurements. A major limitation of this study was a hardware upgrade which took place between the performance of the baseline and follow-up MRI scans. The longitudinal data from this study should therefore be interpreted with care, as the hardware upgrade was found to affect all of the MRI analysis techniques investigated. 20 Storelli and colleagues recently published a study that compared PBVC measurements assessed by icobrain, SIENA, Advanced Normalization Tools (ANTs) (http://stnava.github.io/ANTs) and Statistical Parametric Mapping (SPM) (http://www.fil.ion.ucl.ac.uk/spm/software/spm12) in 24 MS patients over a mean period of 12 months. 21 In this cohort, significant agreement was demonstrated for PBVC measurements between SIENA and SPM, and icobrain and ANTs, but not SIENA and icobrain. 21
In future MS clinical practice, MRI brain volume and atrophy measurements have the potential to be important biomarkers in terms of optimizing individual patient management by: (a) supplying prognostic information early in the disease; and (b) providing additional efficacy information during treatment monitoring. This is because accelerated/pathological range MRI BA may occur in the absence of any detectable clinical changes [relapses, Expanded Disability Status Scale (EDSS) progression] or in the absence of MRI lesion activity [new or enlarging lesions, or newly gadolinium-enhanced lesions (GELs)] on conventional (clinical) MRI.22–24 Recent research has focused on establishing clinically relevant pathological WBA cut offs that can be used in MS clinical practice for individual patient treatment monitoring. 25 The proposed pathological cut off of ⩾0.4% annualized BVL (as measured by SIENA) has been incorporated into the criteria for ‘no evidence of disease activity’ (NEDA)4.22,26 However, the use of this specific annualized BVL pathological cut off in individual MS patients has recently been brought into question by work from Andorra et al. 27 and others.28,29 The study from Opfer and colleagues proposes the use of a new pathological cut off which takes into account within-patient fluctuation, consisting of intrinsic technique measurement error (SIENA) and short-term biological fluctuations of brain volumes. 29 It was found that to identify at least a 0.4% annualized BVL after 1 year, the measured BVL needed to exceed 0.94%. 29 This information may prove helpful in interpreting individual MS patient BVL data in the future.
In this study, we compared SIENA analysis, including expert manual image preprocessing, to a fully automated web-based tool, icobrain long, in the assessment of longitudinal PBVC in a cohort of 102 real-world MS patients, and correlated both methods with clinical data. No hardware upgrades were performed over the study period and all individual MS patients were scanned on the same MRI scanner using the same protocol. For completeness, comparisons of fully automated (icobrain) and semiautomated MRI analysis techniques for the measurement of cross-sectional WBV and FLAIR lesion volume were also performed as part of the study.
Methods
Patients
A total of 102 patients were recruited from a single MS clinic in Sydney, Australia. At baseline, 99 subjects had relapsing–remitting MS (RRMS), based on the McDonald 2010 diagnostic criteria for MS, 30 2 had secondary progressive MS (SPMS) as defined by Lublin et al. 31 and 1 had clinically isolated syndrome (CIS).30,31 The subject with CIS at baseline fulfilled the McDonald 2010 diagnostic criteria for RRMS at follow up. Clinical patient data, including the EDSS score at both time points, were recorded. All patients had provided written informed consent and ethical approval was through the University of Sydney Human Research Ethics Committee (2012/1047, 2014/054, 2015/317).
MRI scan acquisition
All clinical MRI scans were acquired on the same General Electric Discovery MR750 3.0T scanner located at a specialist neuroradiology center. Precontrast inversion-recovery fast spoiled-gradient echo (IR-FSPGR) 3D T1 sequences were acquired using one of three clinical protocols. Protocol A (n = 73) involved sagittal acquisition with repetition time (TR) = 7.2 ms, echo time (TE) = 2.8 ms, inversion time (TI) = 450 ms, flip angle = 12, acquisition matrix = 256 × 256, field of view (FOV) = 230 mm2 and 0.9 mm slice thickness; protocol B (n = 15) scans were acquired axially with TR = 7.0 ms, TE = 2.6 ms, TI = 450 ms, flip angle = 12, acquisition matrix = 240 × 240, FOV = 240 mm2 and 1.0 mm slice thickness; and protocol C (n = 14) scans were acquired axially with TR = 8.1 ms, TE = 3.2 ms, TI = 900 ms, flip angle = 10, acquisition matrix = 256 × 256, FOV = 256 mm2 and 1.0 mm slice thickness. While three 3D T1 acquisition protocols were included in this study, the same sequence parameters were used for individual patients at baseline and follow up (approximately 12 months later). Postcontrast 3D T1 sequences were acquired at baseline and follow up for each subject, using the protocols aforementioned, for GEL assessment. Again, the same sequence parameters were used at both time points for each individual subject.
FLAIR sequences were performed in all subjects at baseline and follow up for FLAIR lesion assessment using one of two clinical protocols. Protocol A (n = 88) involved sagittal 3D acquisition with TR = 8000 ms, TE = 162 ms, TI = 2182 ms, flip angle = 90, acquisition matrix = 256 × 224, FOV = 240 mm2 and 1.2 mm slice thickness; and protocol B (n = 14) involved axial 2D acquisition with TR = 8500 ms, TE = 120 ms, TI = 2100 ms, flip angle = 111, acquisition matrix = 256 × 256, FOV = 256 mm2 and 3 mm slice thickness. In all individual patients, the same sequence parameters were used for both MRI scans.
MRI scan volumetric analysis
WBV and WBA determination
Cross-sectional WBV measurements were calculated from MRI scans using two different MRI volumetric analysis methods, SIENA cross sectional (SIENAX), as described by Smith et al., 12 and the cross-sectional icobrain pipeline (icobrain cross) as described by Jain et al. 15 and Smeets et al. 17 Longitudinal WBA measurements, between the two time points, were calculated from MRI scans using two analysis methods, SIENA, as described by Smith et al., 12 and icobrain long as described by Smeets et al.16,17 No subjects were excluded from the study before or after MRI scan volumetric analysis, and there were no failures of the analysis pipelines used.
SIENAX/SIENA
SIENAX and SIENA were performed at the Sydney Neuroimaging Analysis Centre using optimized analysis pipelines by a trained neuroimaging analyst. Specifically, lesion inpainting was performed using the FSL lesion-filling tool, to minimise tissue misclassification due to focal MS pathology. 32 Lesion masks were first delineated from coregistered FLAIR images using JIM 6.0 software (Xinapse Systems, Essex, UK). Then, intensity nonuniform correction 33 was performed, followed by brain extraction using the FSL BET tool,34,35 separately from conventional SIENAX and SIENA analyses. Brain extraction results were examined to ensure nonbrain tissue was excluded (venous sinuses, skull, etc.) prior to standard automated SIENAX and SIENA analyses being performed. SIENAX was used to measure normalized whole brain volume (NBV) and SIENA was used to calculate PBVC.
icobrain cross/icobrain long
icobrain cross and icobrain-long analyses were performed by uploading precontrast 3D T1 and FLAIR sequences to a secure web-based icometrix portal. From this point, the pipeline algorithms operated in a fully automated fashion without external intervention. icobrain cross 15 was applied to the MRI scans at both time points in each subject, resulting in segmentations for GM, white matter, cerebrospinal fluid and lesions, as well as the bias-field-corrected skull-stripped FLAIR. The output file included quantitative measurements for NBV and FLAIR lesion volume.
Following on from icobrain cross analyses, the longitudinal pipeline, icobrain long, was automatically initiated to evaluate longitudinal changes in a consistent way. 17 In particular, the pipeline provided measurements for PBVC and changes in FLAIR lesion volume.15,17 icobrain long took the segmentations and bias-field-corrected skull-stripped images of icobrain cross as input, and measured PBVC using a registration-based approach applying Jacobian integration, 17 while lesion changes were evaluated using a joint probabilistic segmentation model making use of the difference in images. 36 A quality assessment of the final analysis output images was performed, but no alterations (manual or otherwise) were made to the analysis data.
Lesion volume measurement techniques
FLAIR lesions were segmented separately using two analysis pipelines: semiautomatically by a trained neuroimaging analyst using JIM 6.0 software on coregistered FLAIR images and by the fully automatic icobrain cross based on coregistered T1 and FLAIR images15,17 (see above). Total FLAIR lesion volume and volume changes were calculated by the two approaches independently. Total FLAIR lesion volume change was calculated by subtracting the lesion volume at baseline from that at follow up, as measured by JIM, and as measured by icobrain cross. The volume of new and enlarging FLAIR lesions was assessed using the icobrain-long pipeline only 36 (see above).
Annualized whole brain atrophy: pathological cut offs
The percentage of the cohort with an annualized BVL ⩾ 0.4%, as measured by SIENA and as measured by icobrain long, was calculated. Calculations were then repeated for rates of annualized BVL ⩾ 0.8% and ⩾0.94%.
No evidence of disease activity (NEDA)
For all 102 subjects, NEDA 3 status over the study period was determined using clinical data (clinical relapses and EDSS scores) and MRI lesion data (newly gadolinium-enhanced T1 lesions and new/newly enlarging T2/FLAIR lesions). The MRI lesion data were derived from formal semiautomated segmentation by a trained MRI analyst and made use of automated subtraction and visual comparison of coregistered baseline and follow up MRI images.
NEDA 4 status was then determined for all subjects as well. NEDA 4 criteria were met if NEDA 3 status was achieved and in addition, the annualized rate of whole BVL over the study period was less than 0.4%. The NEDA 4 status of subjects was ascertained three times; once using the annualized PBVC as measured by SIENA, once as measured by icobrain long, and once as measured by both techniques. The more detailed criteria used to establish NEDA 3 and NEDA 4 status can be found in Table 1.
NEDA 3 and NEDA 4 definitions.

EDSS, Expanded Disability Status Scale; NEDA, No Evidence of Disease Activity.
Statistical evaluation
The quantitative MRI brain volumetric and atrophy measurement techniques were statistically compared using Pearson correlation analysis, Bland–Altman plots as described by Bland and Altman, 37 Kendall Tau rank correlation analysis, intraclass correlation coefficient (ICC) analysis and leave-one-out cross validation (LOOCV). ICC consistency was used to verify whether techniques both measured high values for the same subjects and low values for other subjects. ICC agreement was used to verify whether techniques had the same scale. Pearson and Kendall Tau rank correlation analyses were used to compare MRI and clinical outcome data. p values < 0.05 were considered statistically significant for all analyses performed. Due to the exploratory nature of this study, the p values reported have not been corrected for multiple testing/false discovery rate. Statistical analysis was performed using R version 3.3.0 Statistical Software (R Core Team, Vienna, Austria, https://www.r-project.org). 38
Results
Patient cohort characteristics
The study cohort was predominantly female (80.39%) and 97.06% had relapsing–remitting disease. The mean age of first clinical symptom onset was 30.44 (±7.96) years. At baseline MRI, the mean disease duration was 7.35 (±7.39) years. The median EDSS score was 2.0 [interquartile range (IQR) 1.875] at baseline, consistent with mild–moderate disability. Table 2 and Table 3 present the demographic- and disease-related characteristics of the study cohort in detail. The mean time between baseline and follow up MRI scans was 1.05 (±0.15) years. This cohort was relatively active with around a third (32.35%) of patients having a clinical relapse within the 3 months prior to the baseline MRI, approximately one quarter (25.49%) had GELs present at baseline, and around one quarter (24.51%) of the cohort experienced at least one clinical relapse during the study period.
Demographic and MS disease characteristics of the patient cohort.
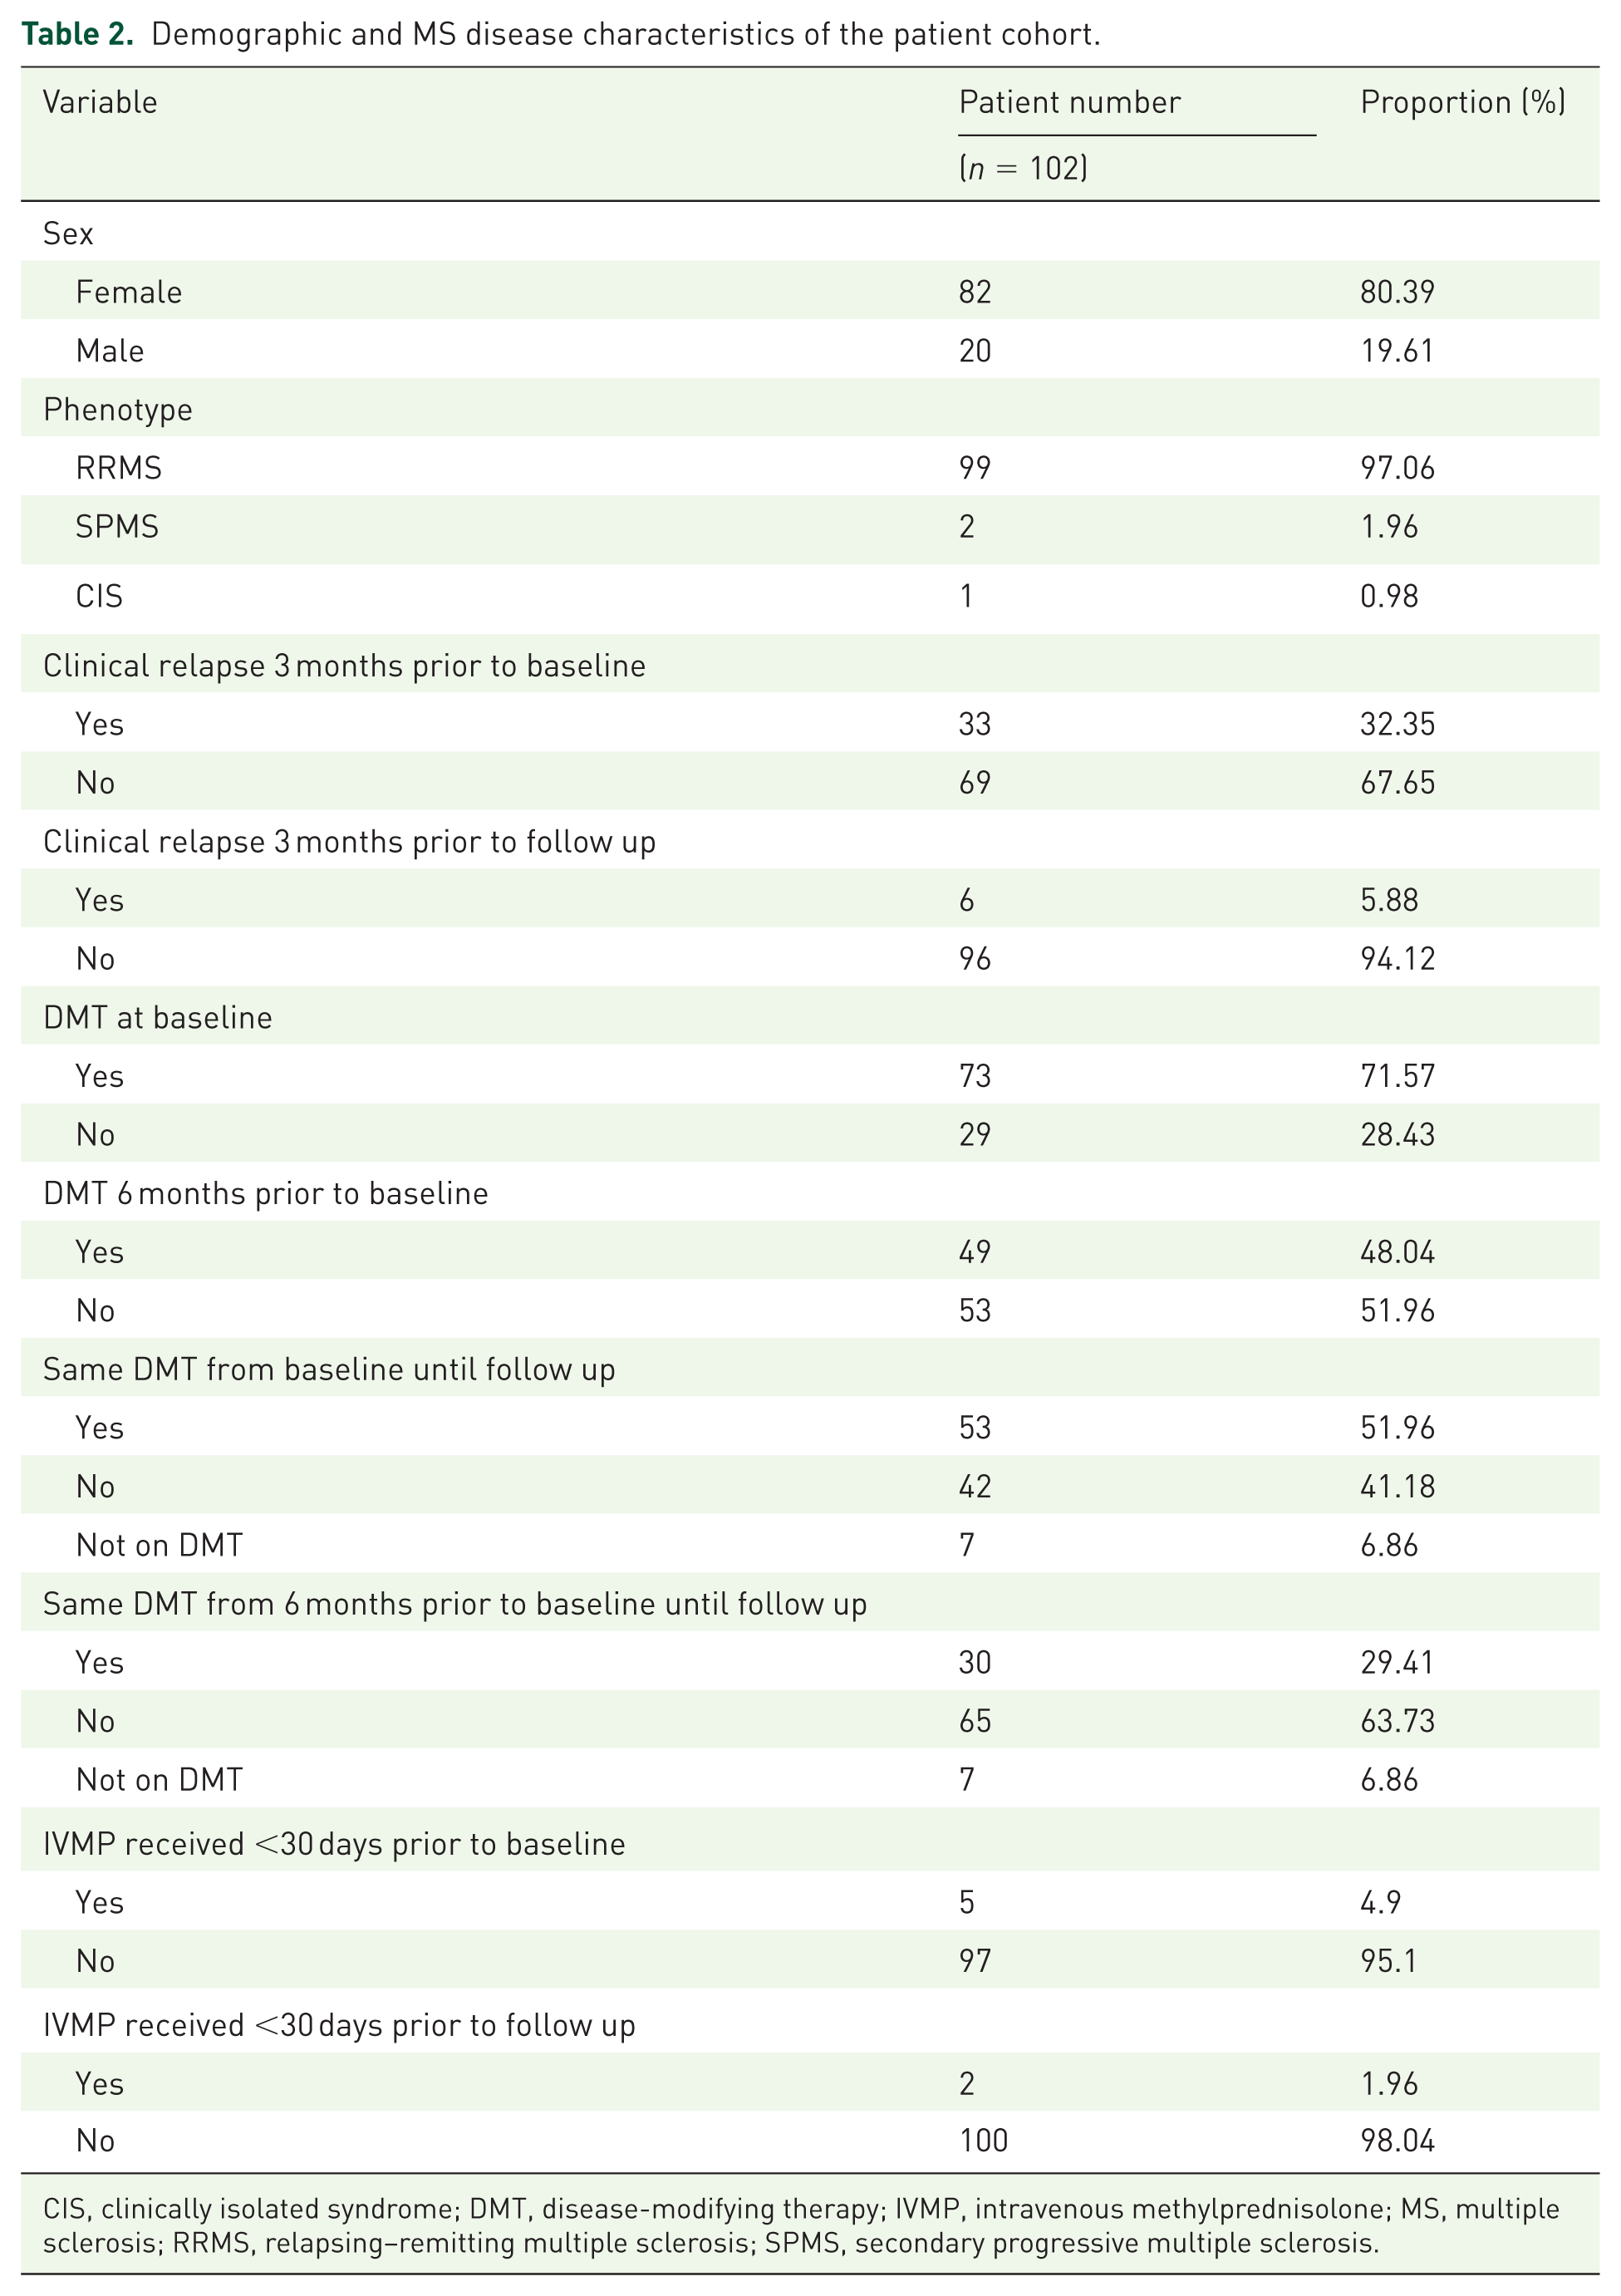
CIS, clinically isolated syndrome; DMT, disease-modifying therapy; IVMP, intravenous methylprednisolone; MS, multiple sclerosis; RRMS, relapsing–remitting multiple sclerosis; SPMS, secondary progressive multiple sclerosis.
Demographic and MS disease characteristics of the patient cohort.

EDSS, Expanded Disability Status Scale; IQR, interquartile range; MRI, magnetic resonance imaging; MS, multiple sclerosis; SD, standard deviation.
Disease-modifying therapy use
Treatment varied within the patient population; 48.04% were on a DMT 6 months prior to study enrolment and by baseline MRI, this had increased to 71.57% (Table 2). Of the 73 patients on therapy at baseline; 21 were taking interferon beta-1a (17 Avonex®, 4 Rebif®), 7 interferon beta-1b (Betaferon®), 12 glatiramer acetate (Copaxone®), 2 teriflunomide (Aubagio®), 24 fingolimod (Gilenya®) and 7 were receiving natalizumab (Tysabri®). At follow up, 92.16% were on therapy: 18 were treated with interferon beta-1a (15 Avonex®, 3 Rebif®), 7 interferon beta-1b, 12 glatiramer acetate, 1 teriflunomide, 3 dimethyl fumarate (Tecfidera®), 37 fingolimod, 12 natalizumab, 2 alemtuzumab (Lemtrada®), and 2 had undergone autologous haematopoietic stem cell transplantation (auto-HSCT) 6 months prior to the follow up MRI. During the study period, 51.96% were on the same DMT, and 29.41% were on the same DMT from 6 months prior to the baseline MRI through to follow up (Table 2).
Quantitative MRI volumetric measurements
Table 4 displays the quantitative MRI volumetric measurement results for the different techniques. The mean (SD) annualized PBVC was −0.64 (±0.73)% and −0.59 (±0.65)% as measured by SIENA and icobrain long, respectively, for the entire patient cohort. In the two subjects that had auto-HSCT, annualized PBVC values were −2.75% and −2.78% as measured by SIENA, and −1.62% and −1.77% as measured by icobrain long, between the baseline and follow up MRIs. These findings were consistent with recently published data that indicate accelerated BA following auto-HSCT. 39
Quantitative MRI volumetric measurements.

Semiautomated lesion inpainting has been performed as part of preprocessing.
FLAIR, fluid-attenuated inversion recovery; JIM, lesion-delineating software; MRI, magnetic resonance imaging; SD, Standard deviation; SIENA, Structural Image Evaluation using Normalisation of Atrophy; SIENAX, SIENA cross-sectional.
Comparison of MRI volumetric measurement techniques and MRI metrics
Correlation and reliability analyses were performed to compare the quantitative MRI measurement techniques for multiple different variables; the results are summarized in Table 5. Absolute differences between the techniques for multiple MRI metrics are displayed in Table 6.
Comparison of quantitative MRI measurement techniques: correlation and reliability analyses.

All p values < 0.001.
Semiautomated lesion inpainting has been performed as part of preprocessing.
ICC, intraclass coefficient; FLAIR, fluid-attenuated inversion recovery; JIM, lesion-delineating software; LOOCV, leave-one-out cross validation; max. diff., maximum difference; MRI, magnetic resonance imaging; SIENA, Structural Image Evaluation using Normalisation of Atrophy; SIENAX, SIENA cross sectional.
Comparison of quantitative MRI measurement techniques: absolute differences.

Semiautomated lesion inpainting has been performed as part of preprocessing.
FLAIR, fluid-attenuated inversion recovery; JIM, lesion-delineating software; Max. diff., maximum difference; Min. diff., minimum difference; MRI, magnetic resonance imaging; PBVC, percentage brain volume change; SD, standard deviation; SIENA, Structural Image Evaluation using Normalisation of Atrophy; SIENAX, SIENA cross sectional.
Baseline NBV measured by SIENAX correlated strongly with measurements using icobrain cross, r = 0.736, and there was also good consistency (ICC = 0.700) and agreement (ICC = 0.696) between the techniques (p < 0.001). Comparison of SIENAX and icobrain cross in terms of baseline absolute WBV revealed an excellent correlation, r = 0.965, level of consistency (ICC = 0.964) and level of agreement (ICC = 0.955; p < 0.001).
Annualized PBVC as measured by icobrain long correlated strongly with SIENA measurements, r = 0.805 (Figure 1), and consistency (ICC = 0.801) and agreement (ICC = 0.800) between techniques were excellent (p < 0.001). Difference scores between SIENA and icobrain long annualized PBVC were normally distributed (Shapiro–Wilk W = 0.98, p = 0.074). Hence, the Bland–Altman plot (Figure 2) demonstrates that the WBA rates were comparable between methods with a difference of −0.05 (±0.44)% (Table 6), and there was no evident proportional difference. On evaluation of the nonannualized PBVC measurements, the strength of the correlation (r = 0.797), levels of consistency (ICC = 0.793) and agreement (ICC = 0.793), and absolute difference, were all very similar to that for annualized PBVC (p < 0.001) (Figure 1 and Figure 2; Table 5 and Table 6). The maximum differences in LOOCV were low for all of the comparisons and correlations (Table 5). This indicates data stability and robustness, and a lack of outlier effects.

Scatter plots comparing SIENA and icobrain long measured annualized PBVC and nonannualized PBVC.

Bland–Altman plots comparing SIENA and icobrain long measured annualized PBVC and nonannualized PBVC.
The association between the semiautomated JIM measurements and icobrain cross for FLAIR lesion metrics were strong for baseline lesion volume, τ = 0.798, and the levels of consistency (ICC = 0.781) and agreement (ICC = 0.757) were also good (p < 0.001). The results were less impressive for change in FLAIR lesion volume, τ = 0.246 (p < 0.001), as measured by subtracting the FLAIR lesion volume at baseline from that at follow up. Measurement consistency (ICC = 0.494) and agreement (ICC = 0.496) were poor to moderate in terms of FLAIR lesion volume change. Four outlier cases were identified when the techniques were compared for baseline lesion volume. On review of the segmentation images, the measurement discrepancies were due to icobrain cross, including more diffuse T2/FLAIR signal change, consistent with ‘dirty-appearing white matter’ (DAWM), 40 that was not included on MRI analyst assessment.
For both the semiautomated and fully automated pipelines, baseline FLAIR lesion volume correlated with baseline NBV (JIM/SIENAX, τ = −0.313; icobrain cross, τ = −0.379; p < 0.001), annualized PBVC (JIM/SIENA, τ = −0.300, p < 0.001; icobrain cross/icobrain long, τ = −0.209, p = 0.002), and nonannualized PBVC (JIM/SIENA, τ = −0.297, p < 0.001; icobrain cross/icobrain long, τ = −0.200, p = 0.003). Baseline gadolinium lesion count correlated with annualized PBVC using both techniques (SIENA, τ = −0.263, p < 0.001; icobrain long, τ = −0.199, p = 0.01), and nonannualized PBVC using both techniques (SIENA, τ = −0.246, p < 0.001; icobrain long, τ = −0.181, p = 0.02).
Change in total FLAIR lesion volume weakly correlated with annualized PBVC for icobrain only (τ = 0.134, p = 0.046). The results for JIM/SIENA and nonannualized PBVC values were not statistically significant. New lesion volume, as measured by icobrain, did not correlate with annualized PBVC (τ = 0.01, p = 0.895) or nonannualized PBVC (τ = 0.02, p = 0.787), measured by icobrain long. Enlarging lesion volume weakly negatively correlated with annualized PBVC (τ = −0.171, p = 0.011) and nonannualized PBVC (τ = −0.175, p = 0.009), as measured by icobrain long. Refer to Figure 3 for a graphical summary of results for this section.

Pairwise comparisons of baseline whole brain and FLAIR lesion volumes, and volume changes.
Comparison between quantitative MRI data and clinical outcome data
There were some statistically significant associations noted between the quantitative MRI and EDSS data using Kendall Tau rank correlation. Baseline NBV measured by SIENAX negatively correlated with baseline EDSS, τ = −0.148 (p = 0.038; maximum difference = 0.120), and follow up EDSS, τ = −0.269 (p < 0.001; maximum difference = 0.195). Baseline NBV measured by icobrain cross negatively correlated with baseline EDSS, τ = −0.152 (p = 0.033; maximum difference = 0.112), and follow up EDSS, τ = −0.236 (p = 0.001; maximum difference = 0.149). SIENA and icobrain long measured annualized and nonannualized PBVC did not significantly correlate with EDSS at either time point. icobrain long measured nonannualized PBVC correlated with EDSS change only (τ = 0.148; p = 0.041; maximum difference = 0.085). Baseline EDSS correlated with baseline FLAIR lesion volume assessment by JIM only, τ = 0.150 (p = 0.036; maximum difference = 0.081).
Brain atrophy pathological cut offs and NEDA
Of the 102-participant cohort, 55.88%, 57.84% and 70.59% reached pathological range annualized BVL of ⩾0.4%, as measured by SIENA, icobrain long and SIENA ± icobrain long, respectively. Around a third of the patient group were identified as having an annualized rate of BVL ⩾ 0.8% according to SIENA and icobrain long. Annualized BVL was ⩾0.94% in 28.43% using SIENA, in 23.53% using icobrain long, and in 29.41% according to one or both methods. In this patient cohort, 35.29% were found to fulfil NEDA 3 criteria (Table 1). NEDA 4 criteria (Table 1) was fulfilled in only 15.69%, 16.67%, and 12.75%, as measured by SIENA, icobrain long, and both SIENA and icobrain long, respectively. The results for this section are summarized in Table 7.
Annualized whole brain atrophy pathological cut off data and NEDA status.
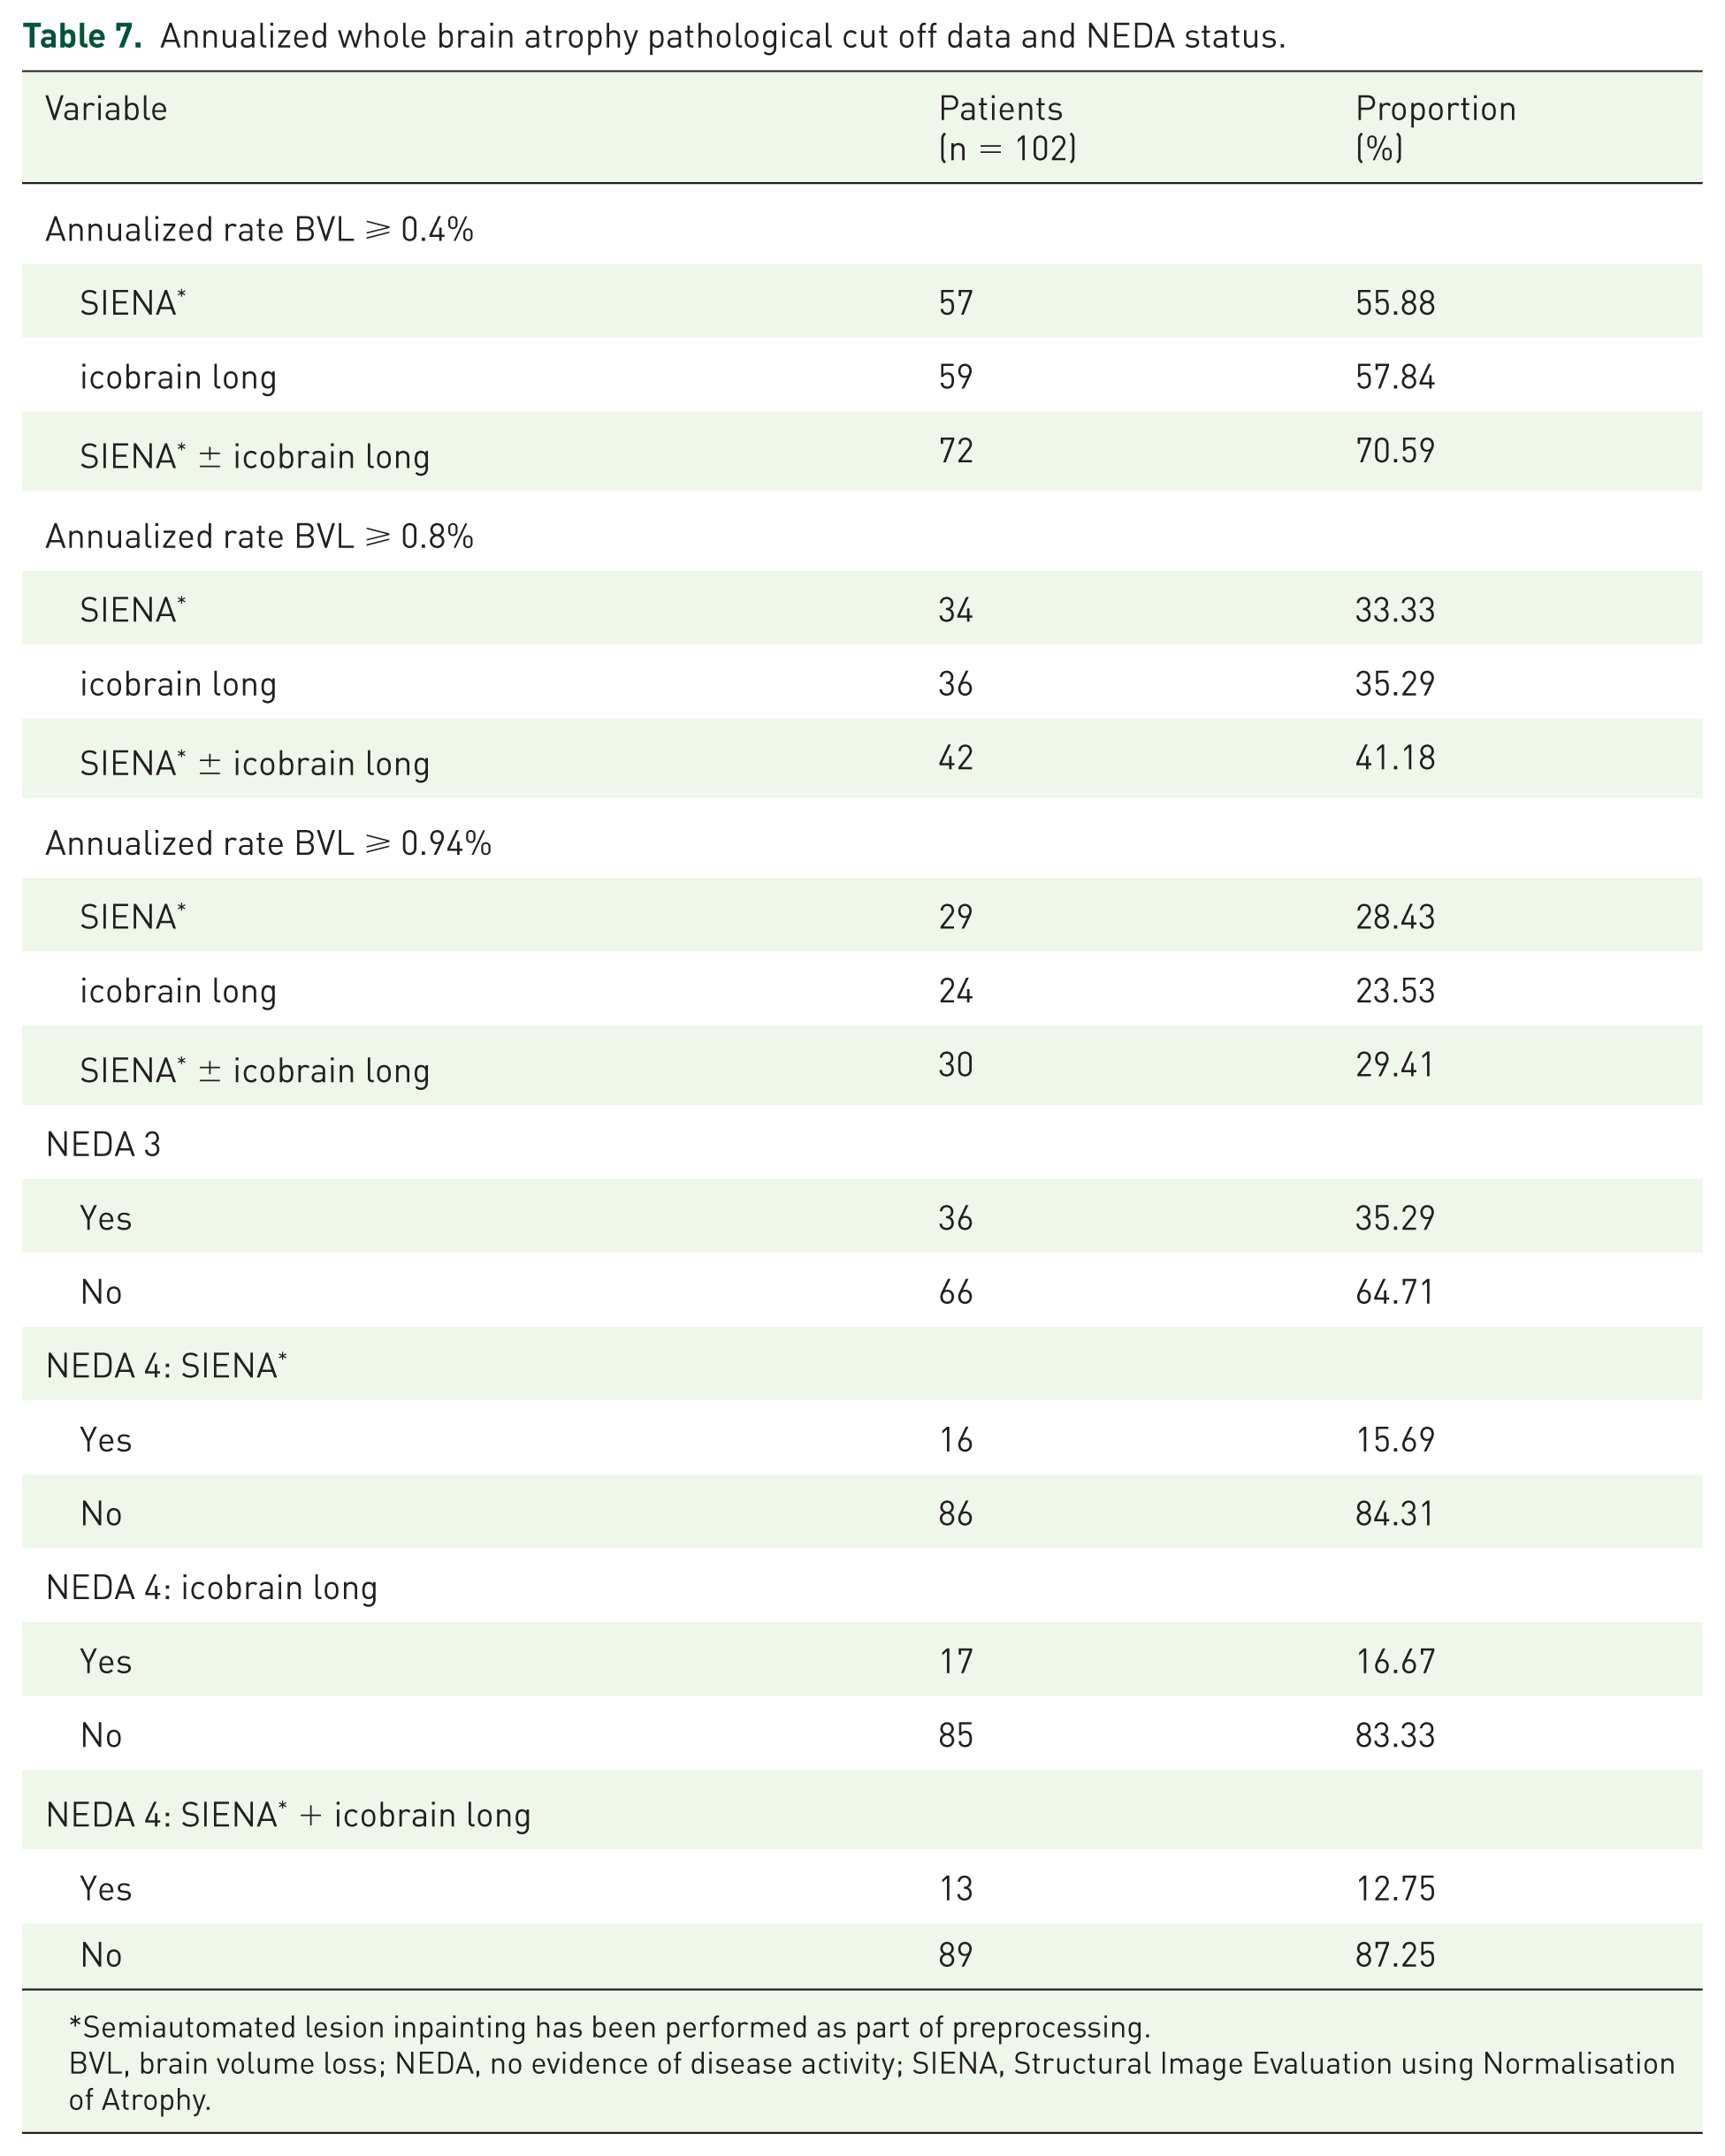
Semiautomated lesion inpainting has been performed as part of preprocessing.
BVL, brain volume loss; NEDA, no evidence of disease activity; SIENA, Structural Image Evaluation using Normalisation of Atrophy.
Discussion
Management of patients with MS has been hampered by the absence of validated, easily implementable biomarkers of neurodegeneration and predictors of future disability. There is clear evidence at the group level that both low baseline WBV and accelerated WBA early in disease correlate with a higher risk of future disability.41–43 There is also growing evidence that many of the currently available DMTs used in the treatment of relapsing MS reduce the rate of BA.5,44,45 Translation of MRI-based brain volume and atrophy measures into clinical practice therefore has the potential to assist with both disease prognosis and treatment monitoring in individual patients. There are currently multiple barriers to these techniques being utilized in routine clinical care which are further discussed below.
The primary focus of this study was to compare icobrain long, a novel, web-based analysis platform, with SIENA, a widely accepted gold-standard method, for the measurement of PBVC. icobrain long is a registration-based, fully automated tool that requires no manual image preprocessing or user expertise, features that are appealing when considering implementation in routine clinical practice. This study shows that annualized PBVC measured by icobrain long correlated strongly with SIENA (with prior lesion inpainting) in a group of patients whose scans were acquired in the course of routine clinical care. The level of statistical consistency and agreement between icobrain long and SIENA for measuring annualized PBVC was also good. It should be noted that all patients in the study had their baseline and follow up MRIs acquired on the same MRI scanner using the same acquisition protocols; and there were no hardware changes between scans. The nonannualized PBVC comparisons did not notably differ from those using the annualized data as the average duration between MRI scans in the cohort was just over 1 year [1.05 (±0.15) years]. The registration-based nature of both the SIENA and icobrain long pipelines is thought to explain the strong correlation, agreement and consistency between these techniques in measuring PBVC. However, in this study, notable discrepancies in measurements between the two techniques did occur in a portion of the cohort. This is likely explained by differences in the pipeline algorithms, however, the exact underlying reasons remain unclear. Outlier cases, where the measurement discrepancies between methods were greatest, were carefully reviewed and evaluated in terms of MRI acquisition, quality assessment of analyses, MRI features and clinical characteristics. Despite this, we were unable to identify any specific factors consistent among this subgroup of patients that predicted a wider measurement discrepancy between the two analysis pipelines. This highlights one of the ongoing challenges in this area of research. Although SIENA and icobrain long were well matched at the group level in measuring PBVC, it was not to the extent that these techniques could be used interchangeably (use one method at one time point and the other at the next) in a research setting or at the individual patient level.
While specific MRI acquisition sequence parameters are not required for successful analysis using SIENA/X or icobrain, an individual patient should ideally be imaged on the same MRI scanner using the identical protocol and parameters10,14 at baseline and follow up. Neither SIENA/X nor icobrain (nor any other currently available method), have been fully validated at the individual MS patient level, especially in situations where MRI parameters change, or the scanner changes, between acquisitions. Scenarios such as these are common in real-world MS clinical practice and thus need to be further addressed. However, validation studies for icobrain and NeuroSTREAM, another novel volumetric pipeline developed by the Buffalo Neuroimaging Analysis Center, suggest that both techniques are able to withstand change in MRI scanner at the group level.16,17,46 Further studies replicating these findings at other centres and on other MRI scanners are needed to further substantiate this. NeuroSTREAM has cross-sectional and longitudinal iterations which specifically measure lateral ventricular volume and volume change, but not WBV and volume change. 46 While the majority of MRI brain volume and atrophy measurement techniques are dependent on the acquisition of a precontrast 3D T1 sequence, NeuroSTREAM requires only FLAIR images (2D or 3D), which are universally acquired in MS clinical MRI protocols. 46
Single time-point or cross-sectional WBV measurement techniques have also been utilized in this study. Two prominent issues that impede these segmentation-based methods being used in clinical practice are unacceptable measurement error and the lack of large normative data sets for comparison. Many research groups are trying to address these issues by: (a) collecting MRI brain volumetric data from normal participants and MS patients using standardized protocols; (b) continuing to develop/improve methods to reduce measurement error; and (c) developing predictive models based on cross-sectional WBV measures.47,48 The use of high frequency MRI monitoring, over both 12- and 24-month periods and using a segmentation-based analysis method (ScanView, an in-house developed software from Charles University, Prague, Czech Republic), was recently explored by Uher et al. 49 It was concluded that high-frequency MRI performed over 12- and 24-month timeframes, may have a considerable effect on improving the precision of pathological BVL identification in individual patients. 49 However, the frequency of MRI acquisition required to gain optimal results (2-monthly MRI scans) would be impractical in a real-world clinical setting. The statistical association, consistency and agreement between the techniques used to measure absolute WBV in this study were excellent but were less impressive when normalized WBV measurements were compared. The most likely explanation for this is that SIENAX and icobrain cross utilize different normalization procedures. 20 This discrepancy was also noted in a recent study by Steenwijk et al. and future studies should investigate the reason/s underlying this.
The cross-sectional FLAIR lesion volume as measured by the two different techniques, the semiautomated approach by a trained MRI analyst and the fully automated icobrain cross, correlated well and showed good statistical consistency and agreement. However, the statistical correlation between these techniques for change in FLAIR lesion volume was poor, and the consistency and agreement, poor to moderate. On review of the lesion segmentation masks, it was apparent that the fully automated icobrain pipeline included areas of diffuse T2/FLAIR signal change or DAWM 40 that was not included in the MRI analyst assessments. Discordance in lesion volume change assessment between the two techniques may also be compounded by measurement error introduced at two time points, as opposed to just one. The exact mechanism underlying DAWM in MS remains unclear,40,50,51 and whether or not DAWM volume should be included as part of the T2/FLAIR hyperintense lesion volume, should be measured separately or not measured, currently remains unknown in both the research and clinical practice settings.
icobrain pipelines address some of the current barriers to integration of quantitative MRI technologies into routine clinical practice. Both preprocessing steps, including lesion delineation, and the main analysis algorithms, are fully automated. Expert image analysis skills are not required and the web-based user interface is accessible to clinicians in a real-world setting. Automation of the preprocessing steps for SIENA/X pipelines and development of a user-friendly interface could similarly enhance the accessibility of this platform. Direct integration of image analysis pipelines into MRI scanner consoles would further benefit translation to clinical practice by facilitating provision of quantitative MRI data to radiologists and clinicians in real-time.
In this study, the levels of agreement, consistency and correlation range from moderate to excellent for brain volume, FLAIR lesion volume and BA, as measured by the icobrain and the semiautomated MRI analyst pipelines (ranges from poor to moderate for FLAIR lesion volume change as discussed above). However, the measurement discrepancies reported here and elsewhere 20 are too great for the techniques to be used interchangeably. Subsequently, in ongoing research and possible future clinical practice, it is recommended that the same MRI analysis techniques and algorithms be utilized in individual MS patients.
In this study, weak correlations or a lack of statistically significant correlations, were noted between WBV and atrophy measurements and EDSS data. Overall, the correlations between MRI and EDSS outcomes were slightly better for the semiautomated MRI measures carried out by MRI analysts compared with those measured by icobrain, however, it is difficult to draw any meaningful conclusions from this. The weak or absent MRI clinical correlations in this study are at least partly explained by: (a) a short duration of follow up; (b) a heterogeneous patient cohort in terms of MS disease activity and MS treatment (see below); and (c) inherent issues associated with the EDSS as a clinical disability outcome measure. 52
In this study, annualized WBA measurements were found to be within the pathological range, annualized rate of BVL ⩾ 0.4%, 25 in over half of the cohort as measured by SIENA and icobrain long, individually. In around a third of the cohort, whole BVL per year was ⩾0.8%, as measured using both techniques. Depending on the technique used, between 23% and 29% of the cohort had an annualized rate of whole BVL ⩾ 0.94%. At all of these cut offs, there were discrepancies between the two techniques in some individual subjects. The cut off levels were strictly adhered to in this study, with no rounding of figures up or down, which may have influenced results. But even so, the presence of these between-method discrepancies highlights that there remains uncertainty as to the exact pathological cut off that should be used in individual MS patients. Recent work by Opfer and colleagues suggests that the pathological cut off, as measured by SIENA, should be an annualized rate of BVL ⩾ 0.94%, which takes into account both technique measurement error and short-term biological brain volume fluctuations. 29 Taking into account technique measurement errors is very important when considering pathological WBA cut offs. This is because even though the measurement errors for both SIENA and icobrain long are low,11,12,17 if the PBVC is small, the technique measurement error may be similar or greater than the actual PBVC value. This presents a notable challenge when attempting to use WBA data at the individual patient level and suggests that perhaps in the current circumstances, higher values of PBVC can be interpreted with more confidence than lower values. Other challenges associated with selecting single WBA pathological cut off values have also been discussed in the literature.27,53 It has been suggested that the patient age and stage of disease/disease duration should be considered when determining an appropriate pathological cut off,27,53,54 but this approach does of course introduce further complexity. The results of this current study, as well as a previous studies,25,27,28 suggest that pathological WBA cut offs may also need to vary depending on the technique used to measure the PBVC.25,27,28 In this study, the pathological WBA cut offs and NEDA 4 definition suggested in the literature, based on SIENA-measured PBVC, have also been applied to the icobrain long measurement technique. This is because at this stage, there is no published data on pathological WBA cut offs specifically for the icobrain long method. Further research is required to find optimal pathological cut offs to use in individual MS patients using the different WBA measurement techniques.
The overall high proportion of individual MS patients identified in this study cohort as having pathological range WBA over only a short 1-year period, indicates that this information may be relevant and important to consider in many real-world MS patients. This was further affirmed by the analysis of NEDA status in the study cohort. NEDA 3 status was achieved in 35.29%, but NEDA 4 status 22 was achieved in far fewer; 15.69% and 16.67%, where WBA was measured by SIENA and icobrain long, respectively.
Several factors can interfere with the evaluation of brain volume and atrophy measures, independent of the MRI analysis technique/s used. 55 Technical factors that affect image acquisition and subsequent image quality include artefacts, resolution, signal-to-noise ratio, tissue-contrast ratio, and imaging protocol and parameter variability between sites and across MRI machines. 10 Biological factors, such as hydration status and diurnal variation can affect the actual WBV.3,55 MS disease and treatment-related factors also influence WBV.3,55,56 Disease-related oedema and inflammation increases WBV, while pulse high-dose steroid therapy appears to reversibly decrease WBV. 57 DMT-related pseudoatrophy follows resolution of disease-related oedema and inflammation as a result of anti-inflammatory mechanisms.3,58 Pseudoatrophy is generally observed in the first 3–6 months after commencing DMT and stabilizes in the second year of treatment.3,56 However, the timing, duration and degree of pseudoatrophy varies, depending on the DMT. From this, it is clear that both the timing of DMT commencement and steroid administration need to be carefully considered in the interpretation of MS clinical trial BA data. These factors have an even greater impact on brain volume measurements in individual patients, and potentially confound the clinical interpretation of longitudinal brain volumetrics, particularly over short follow up periods. Further advances in imaging technology that ‘correct’ for biological, technical and treatment-related factors may facilitate the translation of this biomarker into routine MS clinical practice.
It is important to note that overall, this study cohort was relatively active (based on clinical relapse data and the baseline presence of GELs) and that a significant proportion of the cohort commenced or changed DMT during the study period or within 6 months prior to the baseline MRI. Subsequently, the average rates of BVL in this cohort may be greater than the average treated MS population because of the level of disease activity and the pseudoatrophy effect associated with DMT commencement. However, despite this the range of PBVC measurements in this cohort was still relatively wide, incorporating low and high values, as well as negative and positive values. In fact, this study suggests that the strong associations between PBVC measurements using SIENA and icobrain long are maintained for both small and large changes in brain volume over time. The possible effect of DMT-related pseudoatrophy also needs to be taken into account in the interpretation of the pathological WBA cut off and NEDA 4 data in this patient cohort. The number of patients in the pathological range for WBA may be higher and the proportion meeting NEDA 4 criteria lower, due to DMT-related pseudoatrophy affecting some of the patients. Ideally, assessments of WBA and NEDA 4 status are best performed, and are likely to be most clinically meaningful, when patients have continued on the same DMT and a rebaselining MRI has been performed after the period where DMT-related pseudoatrophy may significantly influence WBA measurements. However, it remains unclear as to the exact length of time that different DMTs may cause a pseudoatrophy effect in different circumstances. This creates a further challenge in effectively utilizing this data in real-world clinical MS practice in the future.
Conclusion
In this real-world clinical MS cohort, icobrain long, an automated web-based platform, quantified longitudinal WBA with a strong level of statistical agreement and consistency compared with SIENA, a well validated registration-based tool that has been used extensively in MS clinical trials and studies at the group level. A high proportion of this cohort, consisting of patients on and off treatment, had pathological range WBA; information which may be of clinical importance in individual patient scenarios.
While clinicians should be aware of the potential pitfalls, MRI brain volume and atrophy measurement in MS patients should not be discounted as a useful MRI biomarker of neurodegeneration and disability at the individual level. Although further optimization of MRI analysis algorithms and techniques, including the development of methods to correct for brain volume fluctuations, are required to allow ideal and reliable use in individual MS patients, it is likely that they will be integrated into routine clinical practice in the foreseeable future. Knowledge of biological and treatment-related fluctuations in brain volume, and monitoring patients over an appropriate follow up period, should allow clinicians to interpret quantitative MRI data with more confidence.
Fully automated, user-friendly, longitudinal platforms are likely to play a significant role in the translation of quantitative MRI brain volumetrics into MS clinical practice; particularly where the technique/s are sufficiently robust to clinical MRI protocol acquisitions and analysis pipelines can be directly incorporated into the local MRI scanner system. Both semiautomated and fully automated measurement algorithms may be implicated in future individual MS patient management.
Footnotes
Acknowledgements
The authors would like to thank patients from whom MRI scans were acquired for analysis. All authors edited the manuscript for intellectual content, provided guidance during manuscript development and approved the final version submitted for publication.
Author Contributions
All authors made substantial contributions to the design of the work, drafting the work, providing comments during draft development, and interpreting the data. Specific contributions include: Heidi N Beadnall and Michael H Barnett conceived the study; Chenyu Wang performed MRI scan analysis; Heidi N Beadnall collected clinical data, performed scan uploading to the automated icobrainMSmetrix system and drafted the manuscript; Annemie Ribbens and Thibo Billiet performed the statistical analysis and developed the figures.
Funding
The author(s) disclosed receipt of the following financial support for the research, authorship, and/or publication of this article: This study was part funded by a research grant from Novartis.
Conflict of interest statement
Heidi Beadnall has received compensation for education travel, speaker honoraria and/or consultant fees from Biogen, Novartis, Merck, Sanofi Genzyme and Roche. Chenyu Wang has nothing to disclose. Wim Van Hecke is the CEO and co-founder of icometrix. Annemie Ribbens and Thibo Billiet are employees of icometrix. Michael H Barnett has received institutional support for research, speaking and/or participation in advisory boards (Biogen, Novartis, and Sanofi Genzyme); research consultant (Medical Safety Systems).