
Abstract
Background:
Pancreatic cancer is a common and lethal malignancy, with the two primary subtypes being pancreatic ductal adenocarcinoma (PDAC) and pancreatic neuroendocrine tumors (pNET). Accurate diagnosis and effective treatment are crucial. Hyperspectral imaging (HSI) is a novel optical diagnostic technology that can capture spectral features inaccessible by traditional imaging techniques. With the aid of artificial intelligence (AI), HSI can provide richer information.
Objectives:
This study aims to develop a convolutional neural network (CNN) based on HSI to assist in the diagnosis of liquid-based cytology (LBC) specimens of PDAC and pNET obtained by endoscopic ultrasound-guided fine-needle aspiration (EUS-FNA).
Design:
We designed a deep learning model using HSI data to differentiate between PDAC and pNET specimens. The CNN model was developed and evaluated using a dataset of LBC slides.
Methods:
During the EUS-FNA procedure, we prepared LBC slides of PDAC and pNET specimens. These slides were scanned using HSI technology to acquire both spectral and spatial information. We employed a modified ResNet18 model to analyze this information and perform classifications. In addition, we used attribute-guided factorization visualization (AGF-visualization) to visualize the CNN’s decision-making process.
Results:
Based on samples from 59 patients, 2014 HSI images were acquired. The spectral curves of PDAC and pNET cells exhibited recognizable differences in the wavelength range of 520–600 nm. Our modified ResNet18 model processes images at approximately 9 images/s and achieves a sensitivity of 90.80%, a specificity of 94.68%, and an accuracy rate of 92.82% (area under the receiver operating characteristic curve = 0.9721). AGF-visualization confirmed that our CNN model classifies based on the features of the tumor cell nucleus.
Conclusion:
Our HSI-CNN model accurately differentiates PDAC and pNET in EUS-FNA specimens, aiding pathologists in diagnosis and reducing their workload.
Plain language summary
This study focused on developing a new method to help doctors diagnose two types of pancreatic cancer - pancreatic ductal adenocarcinoma (PDAC) and pancreatic neuroendocrine tumors (pNET). We used a technique called Hyperspectral Imaging (HSI) to capture unique features of the cancer cells that are not visible with regular imaging methods. By combining HSI with Artificial Intelligence (AI) and a type of AI called Convolutional Neural Network (CNN), we created a model that can quickly analyze these features and provide a diagnosis. During the study, we collected samples from 59 patients with PDAC or pNET. We prepared these samples on slides and scanned them using HSI to capture their spectral and spatial information. Then, we used a modified version of the ResNet18 model to analyze the data and classify the samples. Additionally, we used a visualization technique called Attribute-Guided Factorization Visualization (AGF-Visualization) to understand how the CNN made its decisions. The results showed that our model could quickly process images and accurately classify PDAC and pNET samples. It achieved a sensitivity of 90.80%, specificity of 94.68%, and an overall accuracy rate of 92.82%. The AGF-Visualization confirmed that the CNN was able to classify the samples based on the features of the tumor cell nucleus. In conclusion, our HSI-CNN model provides an accurate and efficient way to differentiate between PDAC and pNET in endoscopic ultrasound-guided fine needle aspiration (EUS-FNA) specimens. This tool can assist pathologists in their diagnostic process, potentially leading to better patient outcomes and reduced workload.
Keywords
Introduction
Pancreatic cancer originates from pancreatic cells and can be classified into two main types: exocrine pancreatic cancer and pancreatic neuroendocrine tumors (pNET). Exocrine pancreatic cancer develops from exocrine cells; the various types of exocrine pancreatic cancers make up more than 95% of all cancers of the pancreas, and one of the most common types is pancreatic ductal adenocarcinoma (PDAC). 1 Nonetheless, some patients present with symptoms stemming from exocrine pancreatic insufficiency, such as steatorrhea, malabsorption, unexplained weight loss, abdominal discomfort, and bloating. 2 Regrettably, the majority of patients remain asymptomatic during the early phases of the disease, often resulting in a delayed diagnosis. pNET is the second most common type of pancreatic tumors, arising from abnormal growth of islet cells that produce hormones in the pancreas. 3 These tumors are significantly less common than their exocrine counterparts, accounting for less than 5% of all pancreatic cancers. 4 pNETs exhibit distinct biological characteristics and typically demonstrate a relatively indolent clinical course. A subset of these tumors secrete excessive levels of biologically active hormones, designated as functional neuroendocrine tumors, with insulinomas and glucagonomas being the most frequently encountered. 3 Conversely, non-functional neuroendocrine tumors, which lack hormone overproduction, are more prevalent than functional tumors. 5 Nevertheless, their incidence has shown a gradual rise in recent years, potentially attributed to enhanced detection techniques and routine screenings. 6
Accurate preoperative differentiation between pNET and PDAC is essential, as it greatly assists in determining the most suitable treatment options and significantly impacts the patient’s overall prognosis. Unlike PDAC, which generally necessitates a more extensive surgical resection accompanied by lymph node dissection, the treatment approach for pNETs exhibits notable differences. 7 Previous studies involving pNET patients have indicated that aggressive surgical interventions may result in higher recurrence rates when compared to conservative resection techniques, without offering significant improvements in overall survival rates. 8 For patients with pNETs measuring less than 1 cm, initial consideration for a period of follow-up observation may be advisable. 9 However, it is important to note that surgical resection remains the only potentially curative method for pNETs. Consequently, surgical resection should generally be contemplated for all pNET patients, while carefully taking into account individual factors such as age, comorbidities, and physical condition, alongside an assessment of the tumor’s operability. 10 This holistic approach ensures that the best possible treatment outcome is achieved, tailored to each patient’s unique circumstances.
Endoscopic ultrasound-guided fine-needle aspiration/biopsy (EUS-FNA/B) has emerged as a dependable and efficient diagnostic tool for pancreatic solid masses, offering a viable alternative to surgical specimens for sample procurement. 11 However, the subtle morphological variations exhibited by pNETs pose a challenge in distinguishing them from well-differentiated PDAC. The limited nature of samples acquired through EUS-FNA/B further complicates the diagnosis of pNETs, especially those requiring immunohistochemical (IHC) analysis. Therefore, to optimize the utilization of these scarce puncture samples, there is a growing need to explore more precise diagnostic techniques.
In recent years, artificial intelligence (AI) has gradually transformed the landscape of the medical industry by enhancing the precision and reproducibility of image assessments while streamlining biomedical applications and diagnostic workflows. 12 Initially successful in cytological diagnoses of gynecological samples, the application of AI has progressively extended to EUS-FNA/B cytology for diagnosing non-gynecological malignancies such as lung cancer, thyroid cancer, and pancreatic cancer.13,14 In the realm of cytopathology, AI facilitates cell classification by extracting morphological features and leveraging algorithms for learning and training to identify and diagnose distinct cell types. Its integration into the diagnostic process holds promise for improving the accuracy and efficiency of pancreatic disease differentiation, particularly in cases where sample availability is limited.
In our research, we have spearheaded the integration of hyperspectral imaging (HSI) technology with AI algorithms. HSI is a sophisticated technique that systematically captures and analyzes information across the electromagnetic spectrum, deriving precise spectra for each pixel within an image. 15 Due to the diverse reactions of different substances to light, they exhibit unique spectral signatures. This innovative approach extends our examination capabilities beyond the visible range, encompassing wavelengths from 250 to 17,000 nm and thermal infrared, revealing a wealth of information that conventional imaging cannot match. 16 By processing and analyzing these spectral features, HSI reveals valuable insights into the chemical and physical properties of objects within the image, enabling accurate object identification. However, interpreting HSI information often requires the support of AI models, as clinicians are unable to directly decipher this information. Recently, HSIs have played a pivotal role in the classification of cancer cells, enhancing solid tumor diagnosis, and guiding surgical interventions. 17 In the field of cytology related to pancreatic lesions, HSI has demonstrated superior diagnostic accuracy compared to traditional imaging methods, offering significant advantages in disease identification. 18
Our study aims to develop a convolutional neural network (CNN) algorithm that harnesses the power of HSI technology. We seek to compare the classification accuracy achieved using HSI images versus traditional RGB images. Furthermore, our HSI-based CNN is used to assist pathologists in rapidly and effectively distinguishing between PDAC and pNET, particularly in cytological specimens prepared using liquid-based cytology (LBC) methods.
Materials and methods
Patient selection
This retrospective study encompassed patients who underwent pancreatic EUS-FNA/FNB at Ruijin Hospital, Shanghai Jiao Tong University School of Medicine, from January 2020 to April 2023, with later received pathological confirmations of either PDAC or pNET. The EUS-FNA/FNB samples were processed using the LBC method to make slides, which were then stained with hematoxylin and eosin (H&E). Two highly experienced cytopathologists independently examined the slides, adhering to the guidelines established by the Papanicolaou Society of Cytopathology. 19 The classification system used consisted of six categories: “Nondiagnostic,” “Negative,” “Atypical,” “Neoplastic,” “Suspicious,” and “Positive.” In our study, slides labeled as “Positive” represented the PDAC group, while those labeled as “Neoplastic” corresponded to the pNET subtype within the LBC preparation. The final diagnosis for each patient was confirmed through a combination of EUS-FNA/FNB pathology, surgical pathology.
The reporting of this study conforms to the Standards for Reporting Diagnostic Accuracy (STARD) statement.20,21 The ethics committee of Shanghai Jiao Tong University School of Medicine granted approval for this study protocol (Approval No. (2022) Linlun-213th), ensuring adherence to the ethical principles outlined in the World Medical Association’s Declaration of Helsinki. Prior to their inclusion in the study, written consent was obtained from all participants.
Image acquisition
The slides were meticulously scanned using an Aperio AT2 slide scanner (Leica Biosystems, Osaka, Japan), ensuring precise and comprehensive digital slide images. Two highly experienced cytopathologists (L.G. and B.Z., with over 10 years of work experience) utilized QuPath (v.0.3.0; University of Edinburgh, Edinburgh, UK) to annotate regions of interests (ROI) in the whole slide scanned images representing cytological features of pNET and PDAC cells. The pathologists rigorously screened and annotated each LBC slide, extracting at least 15 ROIs per patient, which were then seamlessly exported to local drives for further analysis.
Subsequently, a homemade Medical Hyperspectral Imaging (MHSI) system was employed for precise hyperspectral image measurements. 22 The system could offer unparalleled imaging capabilities, which integrated with an optical microscope, an image data acquisition board, and a computer (Figure 1). This microscope was equipped with a high-resolution Omron color charge-coupled device (CCD) camera, a precision Brimrose acousto-optic tunable filter (AOTF), and a superior Omron grayscale scientific Complementary Metal-Oxide-Semiconductor (sCMOS) camera mounted above. This innovative setup provided a design wavelength range of 450–750 nm with a remarkable spectral resolution of 7.5 nm.

Schematic diagram of MHSI system hardware configuration. The system integrates an optical microscope, an image data acquisition board, and a computer. The microscope is equipped with a high-resolution Omron color CCD camera, an AOTF, and a grayscale sCMOS camera mounted on it.
Prior to image acquisition, the MHSI system underwent rigorous spatial and spectral calibration to ensure optimal performance. During the image capture process, the slides were meticulously positioned on a stable platform, and the light source beneath the microscope was sequentially directed through the slide, microscope, AOTF, and sCMOS. Precise control instructions were transmitted from the computer to the serial port function model controller, adjusting the AOTF to generate continuous single-band light and irradiate the sample. Simultaneously, the computer synchronized the sCMOS to capture corresponding HSI data for each band, which was then seamlessly transmitted back to the computer via the image data acquisition board. This process resulted in the acquisition of HSI data across multiple bands, which were subsequently synthesized into a comprehensive hyperspectral data cube by the computer.
In addition to capturing HSI data, the system was capable of acquiring high-resolution color RGB images by controlling the reflector mirror of the microscope. At a specific position 1, the mirror directs the light path, allowing the sCMOS to capture HSI images of the sample. At a specific position 2, the mirror switches the light path, enabling the color CCD to capture RGB images of the same field of view. This setup provided both RGB and HSI images of the sample with consistency.
Image preprocessing
The MHSI system gathers data that displays a multi-band characteristic, encompassing 40 single-band HSI images within our hyperspectral data cube (Figure 2). Each hyperspectral data cube is composed of two spatial dimensions (x, y), which reflect the shape attributes of the sample, and a spectral dimension running along the z-axis. The spectral dimension represents the different spectral profiles of the sample collected under each band.

Microscopic hyperspectral data cube and RGB image of the same field of view. The collected hyperspectral data cube contained the images of 40 bands, 3 bands (Band18, Band22, and Band27) are selected to generate the pseudo-color HSI image. H&E-stained RGB image also consists of the images of three bands (R: red band; G: green band; B: blue band).
HSI images contain rich spatial and spectral information, where adjacent bands often show high correlation and convey similar information, leading to a significant amount of redundant information in the HSI data. In our study, we employed a blank HSI image as a benchmark to filter out noisy data. 23 The primary objective of this approach was to mitigate the impact of electronic instrument noise, thereby facilitating the extraction of distinct spectral signatures from cellular pathological samples. The equation utilized for image processing is provided below:

After acquiring the HSI image information, we utilized principal component analysis (PCA) to condense its dimensionality. Through the PCA method, we narrowed down our selection to three representative spectral images (580.77, 611.54, and 650 nm), which we then combined to form a pseudo-color HSI image (Figure 2). In the following steps, we used HSI images consisting of 40 channels for all our analyses. The differences in spectral curves served as indicators of distinct chemical compositions and morphological structures inherent to pNET and PDAC cells, which provide valuable insights for the development and training of the CNN algorithm. Our objective was to acquire annotated masks manually and derive the corresponding characteristic spectra of pNET and PDAC cells. Therefore, we employed the Few-Shot GAN (FSGAN) network to extract and segment the nuclei of both pNET and PDAC cells from ROIs.24,25 Specifically, we manually annotated 150 HSI images for cell segmentation, which were used to train the FSGAN model. After training, the model predicted the cell segmentation masks for additional hyperspectral images. Although the initial masks were generated by FSGAN, some regions required further refinement. Thus, we manually calibrated these areas to ensure accuracy. The final masks used in subsequent analyses were a combination of FSGAN-generated masks and manually corrected regions.
Development and generalization ability of the CNN algorithm
In this study, we employed the classic ResNet18 network for data training purposes. ResNet18 is a type of CNN architecture and belongs to the ResNet (Residual Network) series, which is renowned for its residual block structures. 26 This architecture comprises 18 layers, starting with an initial convolutional layer, followed by 4 residual stages, each housing 2 residual blocks. In addition, it features a global average pooling layer, a fully connected layer, and a softmax activation function. The fully connected layer in ResNet18 is pivotal in converting the feature maps extracted by the convolutional layers into the final classification outcomes. Since the classical ResNet18 is tailored for processing three-channel RGB images, we replaced the first convolutional layer, which processes the input images, to adapt the model for HSI images and accommodate the unique format of HSI data. We then retrained the model using the HSI data, fine-tuning the network parameters to optimize our model.
Before commencing the CNN model training, we set a fixed random seed to guarantee reproducibility of results. Our data, spanning from January 2020 to November 2022, were partitioned into training, validation, and test sets, adhering to a 6:2:2 ratio. During the training phase, we employed data augmentation techniques, such as brightness adjustments, saturation variations, and rotations, to enrich the training set’s diversity and mitigate overfitting. The validation set was used to evaluate the overall error rate of the model and adjust the hyperparameters accordingly. The classification accuracy of the test set emerged as the primary metric for gauging our algorithm’s performance. Furthermore, to bolster the evaluation of the model’s classification and generalization abilities, we collected case data from November 2022 to April 2023 as an external test set. There is no overlap in patient data among different groups.
After randomly partitioning the dataset, we made appropriate modifications to the ResNet18 network to enhance its capability in handling both natural RGB images and their corresponding HSI images. During this process, we adjusted the initial convolutional layer of the ResNet architecture to accommodate the multi-channel characteristic of the input images. Subsequently, a multi-layer perceptron was set up to map the features extracted from the CNN model to the final predictions. The initial learning rate for our training was set at 1e−05, allowing for a gradual and controlled learning process. Each model was subjected to a maximum training duration of 200 epochs, with the training terminating once the test set’s training loss plateaued. It is worth emphasizing that our proposed methodology is compatible with the majority of existing deep learning classification frameworks. All experiments were conducted using Pytorch, an open-source machine learning library developed by Facebook’s AI Research Lab, New York City, NY, USA. The computational workload was handled by a powerful NVIDIA GeForce RTX 3090 Ti graphics processing unit, ensuring efficient and timely processing of our experiments.
Explainability analysis
Attribution-guided factorization visualization (AGF-visualization) is a technique that significantly enhances the interpretability of image recognition models. 27 This approach integrates gradient-based and attribution-based methodologies to produce visualizations of the pathological regions within HSI images that are most pertinent to the classification decisions made by the CNN algorithm. Specifically, AGF-visualization leverages the final convolutional layer of the ResNet architecture to generate a class activation map for each HSI image. This map highlights the regions critical to the class of interest, with the most strongly activated areas serving as the basis for the model’s predictions. This process not only preserves the fine-grained details of the target cells but also facilitates a more nuanced understanding of the decision-making processes of the CNN algorithm. In addition, it establishes confidence values in the predictive capabilities of the model, providing a crucial measure of reliability and trustworthiness in its application.
Statistical analysis
To comprehensively assess the classification performance of the CNN model, we employed a range of key metrics, including sensitivity, specificity, accuracy, false-negative rate (FNR), false-positive rate (FPR), recall, as well as the smoothness of the receiver operating characteristic (ROC) curve and the area under the ROC curve (AUC). Sensitivity and specificity were utilized to gauge the model’s proficiency in accurately identifying positive and negative cases, respectively. Accuracy provided an overview of the model’s overall correctness, while recall offered insight into the proportion of correctly identified true positive instances. Furthermore, the FNR and FPR were calculated to represent the frequencies of incorrectly classified negative and positive cases, respectively. In addition to these traditional metrics, we also evaluated the model’s discriminative power through the analysis of the ROC curve’s smoothness and the corresponding AUC. A smoother ROC curve and a higher AUC value are indicative of superior model performance. All statistical analyses were conducted using the Sklearn package within the Python software (Version 3.11.3; Python Software Foundation, Beaverton, OR, USA).
Results
Study data
The retrospective study aimed to devise a binary classification model capable of distinguishing between pNET and PDAC cells. It encompassed a total of 59 patients who had undergone pancreatic EUS-FNA/FNB. Table 1 summarizes their baseline characteristics. The mean age of the patients was 57.4 ± 16.5 years, with 33 (55.9%) being male. Lesions were located in the pancreatic head/neck in 35 (59.3%) patients and the body/tail region in 24 (40.7%) patients. The mean diameter of the lesions was 3.2 ± 1.3 cm. In addition, 24 (40.7%) patients were diagnosed with neoplasms, and 35 (59.3%) patients were diagnosed with malignancy based on LBC-based cytopathological diagnosis.
Baseline characteristics of the training, validation, internal, and external test sets.

PDAC, pancreatic ductal adenocarcinoma; pNET, pancreatic neuroendocrine tumor.
From these cases, a comprehensive dataset of 2014 pairs of HSI and RGB images was obtained. The dataset for model development comprised 866 effective image scenes exported from the MHSI system in two formats: HSI images with a resolution of 512 × 612 pixels in TIFF format, and corresponding RGB images with a resolution of 2048 × 2448 pixels in JPG format. Both RGB and HSI images were aligned to the same field of view for qualitative comparison. Figure 3 illustrates an example of an H&E-stained RGB image and its corresponding HSI image, depicting typical cell clusters used for training. To address the challenge of limited image availability, data augmentation techniques such as brightness adjustment, saturation variation, random flipping, and rotation were employed to expand the training set. This resulted in a total of 1494 HSI images and their corresponding RGB images being collected. Of these scenes, 795 belonged to pNET, while the remaining ones were PDAC cases. In addition, 333 effective image scenes were gathered to evaluate the diagnostic performance and generalization capability of the model. Test set 1, consisting of 181 scenes, was used to calculate the diagnostic metrics of the model. Meanwhile, test set 2 served as an external test set to verify the mode’s effectiveness when applied to external datasets for generalization purposes.

RGB images, HSI images, and their representative spectral curves. (a) Typical H&E-stained RGB image of PDAC and (b) its corresponding HSI image of PDAC; (c) the Few-Shot GAN analysis of HSI image with manual annotation masks of PDAC cells; (d) typical H&E-stained RGB image of pNET and (e) its corresponding HSI image of pNET; (f) manual annotation masks of pNET cells; (g) the red curve represents the transmission spectrum feature of PDAC in HSI image, and the blue curve represents the spectrum feature of pNET cells.
Spectrum features and differences between pNET and PDAC cells
The manual annotation masks for both pNET and PDAC cells were produced by utilizing the FSGAN network to analyze pseudo-color HSI images. Figure 3(g) demonstrates the representative spectral features of these cell types. Specifically, the transmittance spectrum characteristic of pNET in HSI images is distinctively outlined by the blue curve, whereas the spectral attribute of PDAC cells is represented by the red curve. Notably, the spectral signatures of pNET and PDAC cells exhibit marked differences, particularly within the wavelength range of 520–600 nm. Consequently, the classification of pNET and PDAC cells can be accomplished by discerning their distinct spectral and spatial attributes.
Diagnostic performance of the ResNet18 model
We employed the ResNet18 model to analyze corresponding pairs of RGB and HSI images, assessing the diagnostic capabilities of the model and determining its associated performance metrics. Table 2 outlines the key metrics derived from the CNN model’s analysis. Overall, the diagnostic proficiency of the ResNet18 model when applied to HSI images proves superior to that of RGB images. For HSI images, the ResNet18 model attains an accuracy of 92.82%. Specifically, in diagnosing and differentiating between pNET and PDAC, the model exhibits a sensitivity of 90.8%, a specificity of 94.68%, a FNR of 9.2%, and a FPR of 5.32%. Conversely, when dealing with RGB images, the diagnostic accuracy stands at 86.19%, with a lower sensitivity compared to HSI images but maintaining a specificity of 100%. Furthermore, to analyze the probability predictions in binary classification, we employed ROC curves. In our evaluation using the ResNet18 model, the ROC AUC value for distinguishing between pNET and PDAC in HSI images is a robust 0.9721, whereas the AUC value for RGB images is 0.9414. The illustrative ROC curves are showcased in Figure 4, while the confusion matrices for both image types are detailed in Tables 3 and 4.
Diagnostic performance of the CNN model.

AUC, area under the ROC curves; CNN, convolutional neural network; FNR, false-negative rate; FPR, false-positive rate; HSI, hyperspectral imaging; ROC, receiver operating characteristic.
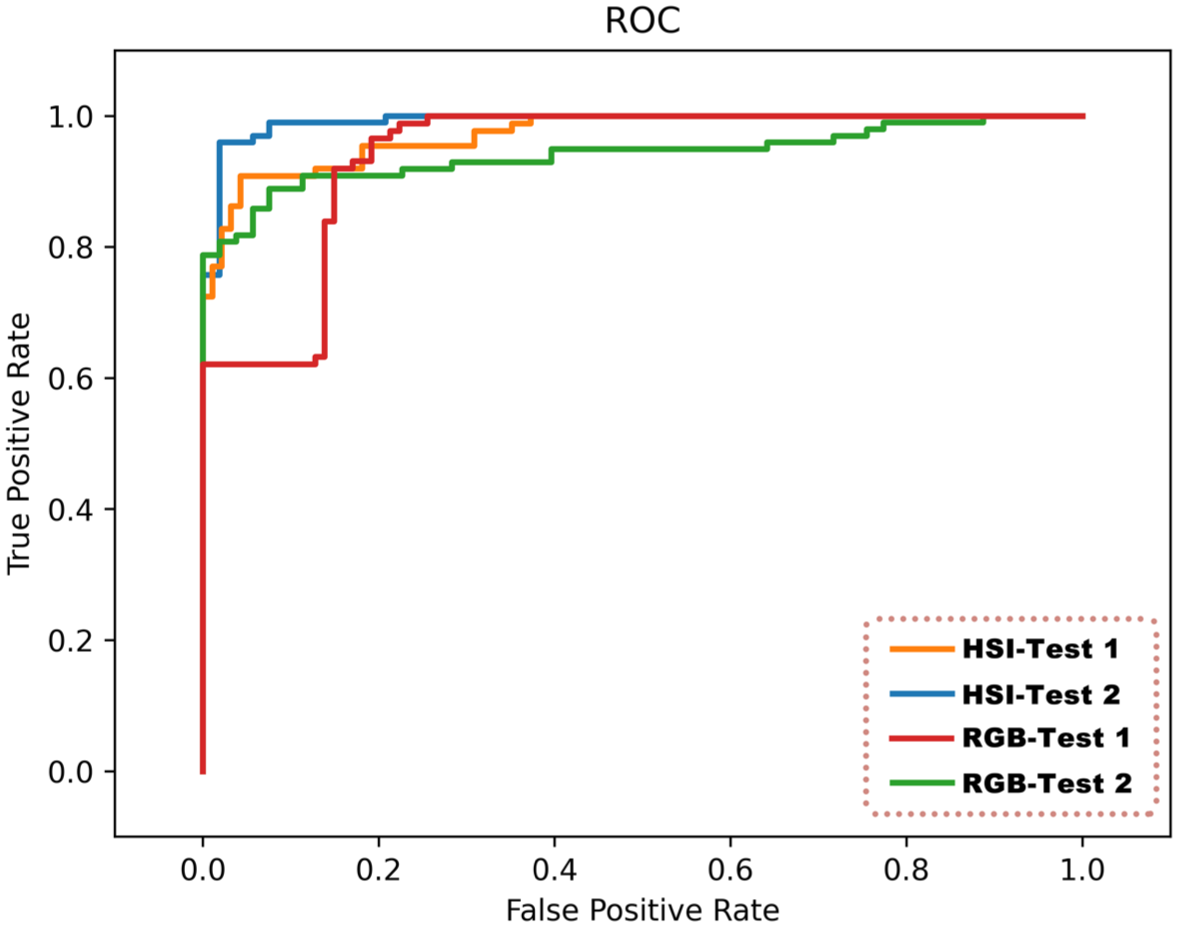
Comparison of the ROC curve of the ResNet18 model at the image level. The orange curve represents the AUC value of 0.9721 for HSI images in evaluation test set 1 using ResNet18, the blue curve represents the AUC of 0.9920 for HSI images in evaluation test set 2 using ResNet18, the red curve represents the AUC of 0.9414 for RGB images in evaluation test set 1 using ResNet18, and the green curve represents the AUC of 0.9411 for RGB images in evaluation test set 2 using ResNet18.
Confusion matrix for HSI images of test set 1 in the ResNet18 model.

HSI, hyperspectral imaging; PDAC, pancreatic ductal adenocarcinoma; pNET, pancreatic neuroendocrine tumor.
Confusion matrix for RGB images of test set 1 in the ResNet18 model.

PDAC, pancreatic ductal adenocarcinoma; pNET, pancreatic neuroendocrine tumor.
Generalization ability of the ResNet18 model
To validate the generalization capabilities of our ResNet18 model, we utilized an external test set 2 consisting of 152 pairs of RGB and HSI images. The results were listed as follows: the model achieved an exceptional diagnostic accuracy of 95.39% for HSI images, outperforming the 82.89% accuracy for RGB images. Similar to the results on the test set 1, the diagnostic accuracy of ResNet18 for HSI images consistently surpasses that of RGB images, maintaining a high accuracy, sensitivity, and specificity above 90%. Notably, the AUC value of our model on the external test set is 0.9920, which closely aligns with the AUC value of 0.9721 observed on test set 1 (as detailed in Tables S1 and S2). Therefore, our ResNet18 model exhibits strong generalization abilities and robustness.
Explainability of the ResNet18 model
In this study, we leveraged AGF-visualization to facilitate an explainability analysis of the final convolutional layer’s output in the ResNet18 architecture. The explainability of AGF-visualization was facilitated through the utilization of a gradient-based methodology, which computed gradients on the distinguishing target regions, ultimately generating representative class activation maps. Illustrated in Figure 5 are the representative class activation maps produced by AGF-visualization. Notably, both the regions of pNET and PDAC cell nuclei exhibit the highest levels of activation, highlighting their significance in driving the model’s precise predictions. Based on these observations, we deduced that the classification of our model relies primarily on morphological characteristics rather than technological features.

Explainability analysis of two representative HSI images using AGF-visualization. (a) HSI image of a representative PDAC case. (b) Class activation map of the PDAC case using AGF-visualization. (c) HSI image of a pNET case. (d) Class activation map of the pNET case. AGF-visualization generates class activation maps, where high-intensity regions (red color) reflect the areas of interest to our model.
Computing performance of the ResNet18 model
Our ResNet18 model boasts an impressive processing speed, handling validation, and test sets at an average of 0.112 s/frame. This equates to a remarkable read rate of approximately 8.93 frames/s, significantly enhancing the efficiency of cytopathologists in their routine pathological image review tasks.
Discussion
PDAC and pNET are the two most common types of pancreatic cancer, and their incidences have been gradually increasing in recent years. 6 Accurately distinguishing pNET and PDAC before surgery not only helps to select more appropriate treatment methods but it also crucial for the prognosis of patients. EUS-FNA/B is often used to obtain a pathological diagnosis of pancreatic masses for accurate distinction between pNET and PDAC, but the obtained samples are limited. To make the full use of EUS-FNA/B samples, we have developed a deep learning model based on HSI technology in this study to assist pathologists in better distinguishing pNET and PDAC cells, and it has shown impressive performance. After comprehensive testing, our ResNet18 model achieved a 92.82% accuracy rate (AUC = 0.9721) for distinguishing pNET and PDAC, and had a 95.39% diagnostic accuracy rate on the external dataset.
In this study, we selected LBC-prepared slides because they are less prone to blood contamination and tissue structure effects, providing a clearer field of view that better resolves fine cell details, enabling more effective cytological assessment and easier AI recognition. 28 The European Society of Gastrointestinal Endoscopy guidelines recommend dividing EUS-FNA samples into smears and LBCs, or processing them all as LBCs. 29 pNETs exhibit typical neuroendocrine features, with the main cytomorphological feature being scattered cells with well-differentiated cytoplasm, round and evenly distributed nuclei, coarse chromatin, and dense granular cytoplasm. 30 High-grade PDACs have relatively mild atypia, posing a challenge for primary cytopathologists. To further distinguish pNET from PDAC, IHC staining needs to be performed, which is crucial for supporting the diagnosis and grading of pNET, but it is a time-consuming process. 31 Therefore, how to save diagnostic time and better assist pathologists in completing the identification of PDAC and pNET is a highly relevant issue.
In recent years, with the advancement of deep learning technology and computational capabilities, AI has made remarkable progress in identifying complex cellular pathology images, leading to the production of commercial products integrated with clinical practices in the field of gynecology.12,32 In the realm of pancreatic cellular pathology, since Momeni-Boroujeni et al. 33 first reported the use of a multilayer perceptron neural network in 2017 to classify EUS-FNA-obtained pancreatic specimens as benign or malignant, research into the application of AI in pancreatic disease diagnosis has continued to intensify. Most of these studies have focused on the differential diagnosis of PDAC and benign cells, utilizing traditional optical imaging techniques and training AI models based on morphological features such as contour, perimeter, and area differences among various types of pancreatic cells. However, there has been no development of AI algorithms specifically for pNET, and traditional optical imaging techniques often provide limited information, resulting in suboptimal diagnostic accuracy for pancreatic cells with low atypia. HSI can offer more spectral dimension information by measuring the reflection and absorption wavelengths of different cell components and their spatial distribution, which serves as a complementary method to traditional optical imaging.
Specifically, unlike traditional optical imaging that captures only three spectral bands (red, green, and blue) in the visible spectrum, HSI records tens to hundreds of spectral channels of data with the same spatial resolution while capturing spatial images. These data, when stacked together, form a hyperspectral image cube. In the processing and application of HSI images, both spatial information and spectral information can be utilized, greatly enhancing the quantitative analysis capabilities of distinguishing targets from their backgrounds. Several studies have indicated that HSI can outperform standard RGB imaging in disease detection, and reports in the field of cellular pathology have also emerged. 18 Our team previously built an MHSI system to collect image information from labeled slides for hyperspectral pathological imaging and developed ResNet18-SimSiam based on this imaging system to distinguish between PDAC and benign cells. 18 This CNN algorithm demonstrated good diagnostic performance in benign-malignant classification and confirmed the superiority of HSI images over RGB images. Therefore, we aim to leverage HSI’s unique ability to capture spectral information to assist cytopathologists in the identification of PDAC and pNET cells to the fullest extent possible.
In our study, we first explored the transmittance curves of pNET and PDAC cells under HSI. Significant spectral differences were observed in the wavelength range of 520–600 nm, indicating differences in molecular structure and chemical composition between different types of pancreatic tumor cells. We hypothesize that one reason for the differing spectral curves is the positive expression of Syn and CgA in most pNET cells, which is often the opposite in PDAC cells. Differences in intracellular cytoplasmic granules lead to varying reflection, absorption, and scattering properties. Subsequently, we used 1862 pairs of HSI and RGB images to construct a CNN model and evaluated its diagnostic performance using classification accuracy on a test set. To ensure reproducibility, we fixed the random seed during data preprocessing. As shown in Table 2, our results confirmed that ResNet18 achieved higher diagnostic accuracy with HSI images compared to RGB images (92.82% vs 86.19%) and demonstrated both sensitivity and specificity greater than 90%, achieving an AUC value of 0.9721. On the external test dataset, our model also exhibited excellent diagnostic performance, achieving 95.39% accuracy, 96.97% sensitivity, 92.45% specificity, and a high AUC ROC performance of 0.9920. Consistent results were also observed in the validation set, indicating improved diagnostic accuracy of ResNet18 for HSI images (see Table S3 for details). Therefore, we conclude that the same CNN model performs better on HSI images than on RGB images, indicating that the spectral information in HSI images is more beneficial for CNN-based disease diagnosis. Furthermore, our model confirms through AGF-visualization that the ROIs identified by the CNN model align with the areas highlighted by the cytopathologist. This thereby increases the credibility of using CNN models to differentiate between pNET and PDAC.
Based on these findings, we summarize the contributions of our study as follows. First, we identified the typical spectral features of pNET and PDAC cell nuclei using EUS-FNA/FNB-obtained pancreatic biopsy specimens. This lays the foundation for establishing a comprehensive HSI database for pancreatic cytopathology, which could facilitate the identification of a broader range of pancreatic diseases. Second, our model’s diagnostic performance is on par with that of junior cytopathologists. The higher diagnostic accuracy of HSI compared to RGB images underscores the value of incorporating spectral features obtained through HSI technology into pathological classification. Third, the CNN model’s visualization results align with the critical areas of focus in cytopathology diagnosis, enhancing the model’s credibility and generalization. Lastly, the CNN model achieves a classification processing speed of 8.93 frames/s, which presents promising prospects for clinical application by significantly reducing the workload of cytologists.
However, our work has two main limitations. First, our study is a single-center retrospective study, and our ability to evaluate the CNN system’s performance in distinguishing between pNET and PDAC in the real world is limited. A longitudinal multicenter cohort study is needed to increase sample diversity and enhance the generalization of the CNN system. The second limitation is that our model is only applicable to H&E-stained LBC slides and does not perform well or at all in pancreatic biopsies prepared and stained with Papanicolaou (PAP). In future studies, we aim to establish a comprehensive HSI database of pancreatic cytopathology with different staining methods to facilitate the generalization and application of the CNN model.
In summary, we designed and fine-tuned the ResNet18 network to distinguish between pNET and PDAC using HSI images. Under the supervision of experienced pathologists, we annotated the input cytopathological image data and conducted multi-stage continuous deep learning on the model. AGF-visualization allows humans to verify the results identified by the CNN network, increasing the model’s credibility. The processing speed of approximately 9 images/s reduces the burden on cellular pathologists during slide review. In the future, we plan to conduct prospective, multicenter studies, input higher-quality training datasets, and promote the clinical implementation of AI to make clinical diagnosis and treatment more feasible.
Supplemental Material
sj-docx-1-tag-10.1177_17562848251414188 – Supplemental material for Differentiating cytology of pancreatic ductal adenocarcinoma and pancreatic neuroendocrine tumors by EUS-FNA through hyperspectral imaging technology combined with artificial intelligence
Supplemental material, sj-docx-1-tag-10.1177_17562848251414188 for Differentiating cytology of pancreatic ductal adenocarcinoma and pancreatic neuroendocrine tumors by EUS-FNA through hyperspectral imaging technology combined with artificial intelligence by Xianzheng Qin, Lili Gao, Kui Wang, Taojing Ran, Yundi Pan, Yingjiao Deng, Xingran Xie, Yao Zhang, Tingting Gong, Benyan Zhang, Ling Zhang, Yan Wang, Qingli Li, Dong Wang, Chunhua Zhou and Duowu Zou in Therapeutic Advances in Gastroenterology
Supplemental Material
sj-docx-2-tag-10.1177_17562848251414188 – Supplemental material for Differentiating cytology of pancreatic ductal adenocarcinoma and pancreatic neuroendocrine tumors by EUS-FNA through hyperspectral imaging technology combined with artificial intelligence
Supplemental material, sj-docx-2-tag-10.1177_17562848251414188 for Differentiating cytology of pancreatic ductal adenocarcinoma and pancreatic neuroendocrine tumors by EUS-FNA through hyperspectral imaging technology combined with artificial intelligence by Xianzheng Qin, Lili Gao, Kui Wang, Taojing Ran, Yundi Pan, Yingjiao Deng, Xingran Xie, Yao Zhang, Tingting Gong, Benyan Zhang, Ling Zhang, Yan Wang, Qingli Li, Dong Wang, Chunhua Zhou and Duowu Zou in Therapeutic Advances in Gastroenterology
Supplemental Material
sj-docx-3-tag-10.1177_17562848251414188 – Supplemental material for Differentiating cytology of pancreatic ductal adenocarcinoma and pancreatic neuroendocrine tumors by EUS-FNA through hyperspectral imaging technology combined with artificial intelligence
Supplemental material, sj-docx-3-tag-10.1177_17562848251414188 for Differentiating cytology of pancreatic ductal adenocarcinoma and pancreatic neuroendocrine tumors by EUS-FNA through hyperspectral imaging technology combined with artificial intelligence by Xianzheng Qin, Lili Gao, Kui Wang, Taojing Ran, Yundi Pan, Yingjiao Deng, Xingran Xie, Yao Zhang, Tingting Gong, Benyan Zhang, Ling Zhang, Yan Wang, Qingli Li, Dong Wang, Chunhua Zhou and Duowu Zou in Therapeutic Advances in Gastroenterology
Supplemental Material
sj-docx-4-tag-10.1177_17562848251414188 – Supplemental material for Differentiating cytology of pancreatic ductal adenocarcinoma and pancreatic neuroendocrine tumors by EUS-FNA through hyperspectral imaging technology combined with artificial intelligence
Supplemental material, sj-docx-4-tag-10.1177_17562848251414188 for Differentiating cytology of pancreatic ductal adenocarcinoma and pancreatic neuroendocrine tumors by EUS-FNA through hyperspectral imaging technology combined with artificial intelligence by Xianzheng Qin, Lili Gao, Kui Wang, Taojing Ran, Yundi Pan, Yingjiao Deng, Xingran Xie, Yao Zhang, Tingting Gong, Benyan Zhang, Ling Zhang, Yan Wang, Qingli Li, Dong Wang, Chunhua Zhou and Duowu Zou in Therapeutic Advances in Gastroenterology
Supplemental Material
sj-docx-5-tag-10.1177_17562848251414188 – Supplemental material for Differentiating cytology of pancreatic ductal adenocarcinoma and pancreatic neuroendocrine tumors by EUS-FNA through hyperspectral imaging technology combined with artificial intelligence
Supplemental material, sj-docx-5-tag-10.1177_17562848251414188 for Differentiating cytology of pancreatic ductal adenocarcinoma and pancreatic neuroendocrine tumors by EUS-FNA through hyperspectral imaging technology combined with artificial intelligence by Xianzheng Qin, Lili Gao, Kui Wang, Taojing Ran, Yundi Pan, Yingjiao Deng, Xingran Xie, Yao Zhang, Tingting Gong, Benyan Zhang, Ling Zhang, Yan Wang, Qingli Li, Dong Wang, Chunhua Zhou and Duowu Zou in Therapeutic Advances in Gastroenterology
Footnotes
References
Supplementary Material
Please find the following supplemental material available below.
For Open Access articles published under a Creative Commons License, all supplemental material carries the same license as the article it is associated with.
For non-Open Access articles published, all supplemental material carries a non-exclusive license, and permission requests for re-use of supplemental material or any part of supplemental material shall be sent directly to the copyright owner as specified in the copyright notice associated with the article.