
Abstract
Background:
Unlike infliximab, ustekinumab (UST) has shown inconsistent associations between drug concentration and clinical efficacy across studies, with varying cutoff therapeutic trough levels (TLs) proposed.
Objectives:
Given that patients have different histories of biologic use, we aimed to evaluate whether therapeutic TLs of ustekinumab require optimization in patients with Crohn’s disease.
Design:
Cohort study.
Methods:
To assess whether ustekinumab has a potential therapeutic cutoff value, we evaluated and compared its 1-year TLs in 14 biologic-naïve patients and in 26 patients who were prescribed the drug after experiencing a loss of response to previous biologic therapies.
Results:
The mean TL in the biologic-naïve patients was 3.41 µg/mL, which was significantly higher than that in the biologic-experienced patients (1.46 µg/mL; p = 0.007). The duration of prior biologic therapy and disease activity correlated with the ustekinumab TLs. With regard to the optimal cutoff value for predicting deep remission at 1 year, the threshold was 2.34 µg/mL for the biologic-naïve patients (area under the receiver operating characteristic curve (AUC) = 0.909, p < 0.001) and 1.18 µg/mL for the biologic-experienced patients (AUC = 0.892, p < 0.001).
Conclusion:
Ustekinumab TLs in patients may differ according to their prior exposure to biologic agents and disease activity. Accordingly, rather than applying a uniform threshold, ustekinumab levels should be interpreted using individualized, patient-specific strategies in clinical practice.
Plain language summary
Ustekinumab is a biologic therapy used to treat Crohn’s disease, a chronic inflammatory condition of the digestive tract. Measuring how much ustekinumab remains in the blood before the next dose (known as the trough level) can help doctors assess whether the treatment is working effectively. However, it remains unclear whether one fixed drug level is appropriate for all patients. In our study, we explored whether the optimal drug level of ustekinumab should differ based on a patient’s history of using other biologic treatments. We compared two groups of Crohn’s disease patients: those who had never received biologic therapy before (biologic-naïve) and those who had previously been treated with other biologics. We found that ustekinumab levels were significantly higher in biologic-naïve patients than in those who had prior biologic exposure. Importantly, the best drug level (cut-off value) for predicting successful treatment response was different for each group. This finding suggests that ustekinumab blood levels should not be interpreted using a single universal threshold. Instead, they should be assessed in the context of each patient’s treatment background. Recognizing and applying different cut-off values based on biologic treatment history may lead to more accurate monitoring and better treatment outcomes. By highlighting the need for personalized interpretation of ustekinumab levels, this study supports a more tailored approach to care in Crohn’s disease and may help guide future strategies in therapeutic drug monitoring.
Introduction
The development of biologics such as infliximab (IFX) and adalimumab against tumor necrosis factor-alpha (TNF-α) has significantly improved the clinical outcomes of inflammatory bowel disease. 1 However, up to 30% of patients with inflammatory bowel disease show primary non-response to anti-TNF-α therapy. Moreover, certain patients experience a loss of response to anti-TNF-α therapy over time owing to immune tolerance or the generation of anti-drug antibodies (ADAs).2,3 Therefore, the development of new biologic agents targeting alternative cytokines or small molecules has accelerated in recent years. One such agent is ustekinumab (UST), a human IgG1κ monoclonal antibody that exerts its effect by inhibiting interleukin-12 and interleukin-23 through their shared p40 subunit. 4
Therapeutic drug monitoring is a useful strategy for determining whether dose intensification is needed to enhance treatment outcomes and prevent secondary loss of response, with the most robust evidence supporting its use in IFX therapy. 5 To apply this approach to UST therapy, many researchers have measured and evaluated the clinical significance of UST trough levels (TLs) in patients.6–12 However, unlike studies on IFX, those on UST have reported inconsistent therapeutic cutoff values, and a consensus regarding the association between UST TLs and clinical outcomes is lacking. Because of this heterogeneity, Vasudevan et al. 13 conducted a systematic review and meta-analysis of UST TLs, whereupon they concluded that higher TLs appear to be associated with improved clinical outcomes in patients with Crohn’s disease receiving maintenance UST therapy.
We considered that, unlike the findings for IFX, the variability in therapeutic UST concentrations across studies might be due to differences in the patient populations, given that many IFX studies involved biologic-naïve patients, whereas a large proportion of UST studies included patients with prior exposure to other biologics. This difference may be related to pharmacokinetic factors. Furthermore, we observed in clinical practice that some patients achieve remission despite having relatively low serum concentrations of UST.
Pediatric patients with inflammatory bowel disease typically endure a lengthy disease duration and are frequently treated with biologic therapies. On the basis of pharmacokinetic considerations, we hypothesized that UST TLs may differ between biologic-experienced and biologic-naïve patients, potentially necessitating different therapeutic cutoff values. Therefore, this study aimed to evaluate the proposed hypothesis and explore the possibility of defining individualized therapeutic cutoff values for UST in patients with Crohn’s disease, on the basis of the prior biologic treatment history of the patient, to advance a more personalized treatment approach.
Materials and methods
Patients and study design
This was a cohort study. It conformed to the institutional review board guidelines. The reporting of this study conforms to the Strengthening the Reporting of Observational Studies in Epidemiology (STROBE) statement. 14 Forty adult patients with pediatric-onset Crohn’s disease who were followed by pediatric gastroenterologists were enrolled in the study consecutively from January 2021 to June 2022. Supplemental Figure 1 presents the study flow diagram. Of these patients, 14 were biologic-naïve (Group 2), whereas 26 (Group 1) initiated UST after experiencing a loss of response to previous biologic therapies. The biologic-naïve patients had required UST therapy because of persistent active disease despite prior treatment with mesalazine and immunomodulators. Loss of response in the biologic-experienced patients was defined as meeting one or more of the following criteria: (1) elevation or lack of normalization in erythrocyte sedimentation rate (ESR) or C-reactive protein (CRP) levels, (2) no improvement in fecal calprotectin levels, or (3) a Crohn’s disease activity index (CDAI) score greater than 150 or increased by more than 30 points from baseline. All patients underwent laboratory testing, stool calprotectin measurement, endoscopic evaluation (including both esophagogastroduodenoscopy and colonoscopy), and magnetic resonance enteroclysis before the initiation of UST and again after 1 year of treatment. Endoscopic remission was defined as a simple endoscopic score for Crohn’s disease (SES-CD) of 0–2. 15 Blood samples for measuring UST TLs were collected immediately before drug administration. In addition, data regarding potential confounding factors (including the concomitant use of immunomodulators) and baseline data of disease activity and disease phenotype were collected to evaluate their influence on the UST TL.
As induction therapy, a single intravenous weight-based dose of UST (~6 mg/kg) was administered to all patients (260 mg for patients weighing ⩽55 kg, 390 mg for those weighing >55 and ⩽85 kg, and 520 mg for those weighing >85 kg). Eight weeks later, a second UST dose (90 mg) was administered subcutaneously. The response to induction therapy and the decision to initiate maintenance treatment were assessed at weeks 16–20 on the basis of the CDAI score. According to insurance approval criteria, maintenance therapy was continued in patients who demonstrated a CDAI decrease of more than either 70 points or 25% from baseline. Maintenance therapy was administered at standard 12-week intervals. However, for patients who exhibited a loss of response, the dosing interval was appropriately shortened to every 8 weeks. In line with the national health insurance system, which does not allow 4-week dosing, none of the patients received ustekinumab every 4 weeks.
The primary objective of this study was to evaluate whether the disease duration and prior exposure to biologic therapies influenced the TL of UST when used as a second-line treatment. The secondary objective was to determine the optimal TLs by comparing biologic-experienced and biologic-naïve patients. On the basis of these analyses, we aimed to explore the potential of individualized UST therapy in patients with inflammatory bowel disease.
Measuring ustekinumab TLs
To measure the UST trough concentrations, blood samples were first incubated in 96-well plates precoated with the IG-9C7 monoclonal antibody (Catcher Ab, ImmunoGuide clone 9C7). Subsequently, a biotinylated anti-human IgG monoclonal antibody (clone IG-1B5) specific to the Fc region of human IgG was added to bind the Fc portion of UST. After a second incubation, horseradish peroxidase-conjugated streptavidin was added to bind the biotinylated IG-1B5 antibody. The measured color intensity was considered to be directly proportional to the concentration of free UST in the sample. A dose–response curve was generated by plotting the optical density against the drug concentration. Colorimetric measurements were obtained using an x-Mark spectrophotometer (Bio-Rad) and analyzed with MM6 software (Bio-Rad).
Statistical analysis
Continuous variables were presented as medians with interquartile ranges, whereas categorical variables were summarized as absolute numbers with corresponding percentages. Group comparisons for continuous variables were performed using either Student’s t test or the Mann–Whitney U test, as appropriate. Pearson’s correlation analysis was used to assess the associations between continuous variables. Multivariate analysis was used to adjust for confounding factors, including immunomodulators and baseline disease activity, when evaluating the differences in UST TLs. The diagnostic performance was evaluated using receiver operating characteristic (ROC) curve analysis, with the sensitivity, specificity, and area under the ROC curve (AUC) reported. The optimal cutoff values were determined using Youden’s J statistic. All statistical analyses were conducted using SPSS software version 29 (IBM Corp., Armonk, NY, USA). Statistical significance was set at a p-value of less than 0.05.
Results
Initial clinical characteristics
The baseline characteristics of the patients at the initiation of UST treatment are summarized in Table 1. All the patients had been diagnosed with Crohn’s disease during childhood or adolescence. The mean age at diagnosis was significantly lower in Group 1 (14.17 years) than in Group 2 (16.55 years; p = 0.035). In line with this, the disease duration from diagnosis to UST initiation was also significantly longer in Group 1 (p < 0.001). The mean age at Ustekinumab initiation was 23.17 years in group 1 and 22.81 years in group 2, indicating that both groups were in their early 20s. There was no statistically significant difference between the groups (p = 0.615). No significant differences were observed between the two groups in terms of general demographic data. At the time of UST initiation, the two groups were not statistically different with regard to disease activity measures, including CDAI score, hematological parameters, and fecal calprotectin levels. However, in the evaluation of disease behavior based on the Paris classification, a relatively higher proportion of patients in Group 1 were classified as B2, resulting in a statistically significant difference in behavioral distribution between the two patient groups (p = 0.020). The two groups did not differ significantly in terms of disease location or growth status. The mean SES-CD value was also higher in Group 1 (18.33 vs 15.46 in Group 2; p = 0.030). All patients in Group 1 had prior exposure to biologic therapies, with some having been treated with up to three different agents. Details of the previously used biologics are provided in Table 1.
Baseline clinical characteristics of the two groups divided by prior experience with biologics at diagnosis of Crohn’s disease (Group 1: Prior biologic-exposed patients, Group 2: Biologic-naïve patients).

Variables are represented by mean (SD) or n (percentage).
Bold values indicate statistically significant results (p < 0.05).
Scores <150 indicate remission; 150–219 mild disease; 220–450 moderate disease; and >450 severe disease.
The SES-CD assesses the size of mucosal ulcers, ulcerated surface, endoscopic extension, and presence of stenosis.
CDAI, Crohn’s Disease Activity Index; CRP, C-reactive protein; ESR, erythrocyte sedimentation rate; SES-CD, simple endoscopic score for Crohn’s disease.
Ustekinumab treatment outcomes in biologic-experienced and biologic-naïve patients
The clinical outcomes of both patient groups after 1 year of UST therapy are presented in Table 2. The patients in Group 2 demonstrated better outcomes across several objective parameters, as detailed below. The CDAI score was significantly higher in Group 1 (mean value: 79.91 vs 9.9 in Group 2; p < 0.001). In the laboratory evaluation, the levels of inflammatory markers, including ESR and CRP, were significantly lower in Group 2 (p = 0.024 and 0.001, respectively). Similarly, the fecal calprotectin levels were significantly higher in Group 1 (mean: 903.24 vs 67.77 mg/kg in Group 2; p < 0.001). Consistent with the findings at the time of diagnosis, Group 1 still had a significantly higher proportion of patients classified as B2 (stenosing behavior). Furthermore, the mean SES-CD values were significantly different between the two groups (14.63 in Group 1 vs 1.14 in Group 2; p < 0.001). This corresponded with a statistically significant difference in the proportion of patients in each group who achieved endoscopic remission, with only 6 of the 26 patients (23.1%) in Group 1 reaching this outcome and 11 of the 14 patients (78.6%) in Group 2 achieving it (p < 0.001).
Comparison of clinical characteristics and clinical improvement between the two groups 1 year after treatment with ustekinumab (Group 1: Prior biologic-exposed patients, Group 2: Biologic-naïve patients).

Variables are represented by mean (SD) or n (percentage).
Bold values indicate statistically significant results (p < 0.05).
The PCDAI score can range from 0 to 100, with higher scores signifying more active disease. A score of <10 is consistent with inactive disease; 11–30 indicates mild disease, and >30 is a moderate-to-severe disease.
The SES-CD assesses the size of mucosal ulcers, ulcerated surface, endoscopic extension, and presence of stenosis.
CDAI, Crohn’s Disease Activity Index; CRP, C-reactive protein; ESR, erythrocyte sedimentation rate; PCDAI, pediatric Crohn’s disease activity index; SES-CD, simple endoscopic score for Crohn’s disease; Y, yes.
Factors associated with endoscopic remission
Table 3 shows the results of the univariate and multivariate logistic regression analyses of factors associated with endoscopic remission after 1 year of UST treatment. The results showed that endoscopic remission was significantly influenced by both the UST TL at 1 year (odds ratio (OR) = 17.42, p = 0.014) and the weight-based value of the maintenance dose (90 mg/kg; OR = 140.80, p = 0.044).
Multivariate logistic regression analysis for evaluation of associated factors for endoscopic remission after 1-year treatment of ustekinumab in patients with pediatric-onset Crohn’s disease.

Multivariate analysis was performed by selecting a variable with p < 0.1 in univariate analysis.
The SES-CD assesses the size of mucosal ulcers, ulcerated surface, endoscopic extension, and presence of stenosis.
The PCDAI score can range from 0 to 100, with higher scores signifying more active disease. A score of <10 is consistent with inactive disease; 11–30 indicates mild disease, and >30 is a moderate-to-severe disease.
BMI, body mass index; CD, Crohn’s disease; CDAI, Crohn’s disease activity index; CI, confidence interval; CRP, C-reactive protein; ESR, erythrocyte sedimentation rate; IMM, immunomodulator; OR, odds ratio; PCDAI, pediatric Crohn’s disease activity index; SES-CD, simple endoscopic score for Crohn’s disease; TLs, trough levels; UST, ustekinumab.
Impact of prior biologic therapy on ustekinumab TLs
Although the difference was not statistically significant, 22 patients in Group 1 (84.6%) underwent dose intensification with an 8-week injection interval compared with 9 patients in Group 2 (64.4%) (Table 2). Despite that more patients in Group 1 underwent dose intensification at an 8-week interval, the mean UST TLs at the 1-year assessment were significantly higher in Group 2 (1.36 vs 3.41; p < 0.001). Figure 1 presents a box plot illustrating the median UST TLs according to the number of previously used biologic agents. Compared with those in the biologic-naïve group, the patients with prior exposure to one, two, or three biologic agents showed significantly lower TLs (p = 0.015, 0.026, and 0.034, respectively). However, no significant differences in TLs were observed among the biologic-experienced patients stratified by the number of prior biologic therapies used.

A box plot comparing ustekinumab drug concentrations according to the number of prior biologic therapies.
Clinical factors associated with TLs
As UST TLs were found to be associated with endoscopic remission, an additional analysis was conducted to identify the clinical factors associated with the TLs (Table 4). Notably, both the duration of the disease and that of prior IFX use demonstrated significant negative correlations with UST TLs, with Pearson’s correlation coefficients of −0.508 and −0.440, respectively (both p < 0.001). Both the body weight (kg) at the time of UST initiation and the weight-based value of the maintenance dose (90 mg/kg) showed significant correlations with the TLs, with Pearson’s correlation coefficients of −0.34 and 0.386, respectively (p = 0.032 and 0.014, respectively). At 1-year follow-up, factors associated with UST TLs were primarily related to disease activity. The laboratory markers (albumin, ESR, and CRP) as well as the fecal calprotectin level and SES-CD value showed statistically significant negative correlations with the UST TLs (Table 4).
Pearson correlation analysis between ustekinumab trough concentration at 1 year and clinical factors.

The SES-CD assesses the size of mucosal ulcers, ulcerated surface, endoscopic extension, and presence of stenosis.
Bold values indicate statistically significant results (p < 0.05).
BMI, body mass index; CRP, C-reactive protein; ESR, erythrocyte sedimentation rate; SES-CD, simple endoscopic score for Crohn’s disease; UST, ustekinumab.
Variables that showed significant correlations in the univariate analysis were included in a multivariate linear regression model to identify independent predictors of UST TLs (Supplemental Table 1). The analysis revealed that both the duration of prior IFX use (B = −0.144, p = 0.012) and the SES-CD score at 1 year (B = −0.055, p = 0.021) were independent factors associated with UST TLs at 1 year.
Difference in optimal TLs predicting endoscopic remission
Although the UST TLs were associated with endoscopic remission, the achievement of this outcome in patients from Group 1—despite their relatively low TLs and prior biologic exposure—prompted us to perform a subgroup analysis. As shown in Figure 2, within each group, the UST TLs differed between patients who achieved endoscopic remission and those who did not. Notably, although the overall UST TLs were lower in Group 1 (biologic-experienced patients), the patients who achieved endoscopic remission maintained significantly higher TLs than those who did not achieve this outcome within the same group (p = 0.007). Accordingly, ROC curves were generated separately for each group to identify the optimal TL thresholds predictive of endoscopic remission (Figure 3). In the ROC analysis performed on all patients, the AUC was 0.939 (p < 0.001), indicating a high diagnostic accuracy. The optimal cutoff TL value for predicting endoscopic remission was identified as 1.57 µg/mL (Figure 3(a)). When the analysis was limited to patients with prior biologic exposure (Group 1), the AUC remained high at 0.892 (p < 0.001), indicating a strong diagnostic performance. The optimal cutoff value in this subgroup was 1.18 µg/mL (Figure 3(b)). When the analysis was conducted exclusively in biologic-naïve patients (Group 2), the AUC was 0.909 (p < 0.001), and the optimal cutoff value was 2.34 µg/mL, which was relatively higher than that observed in the Group 1 patients (Figure 3(c)).

Box plot illustrating differences in ustekinumab trough levels at 1 year between patients who achieved endoscopic remission and those who did not, analyzed separately for each group. Group 1: biologic-experienced group, Group 2: Biologic-naïve patients.
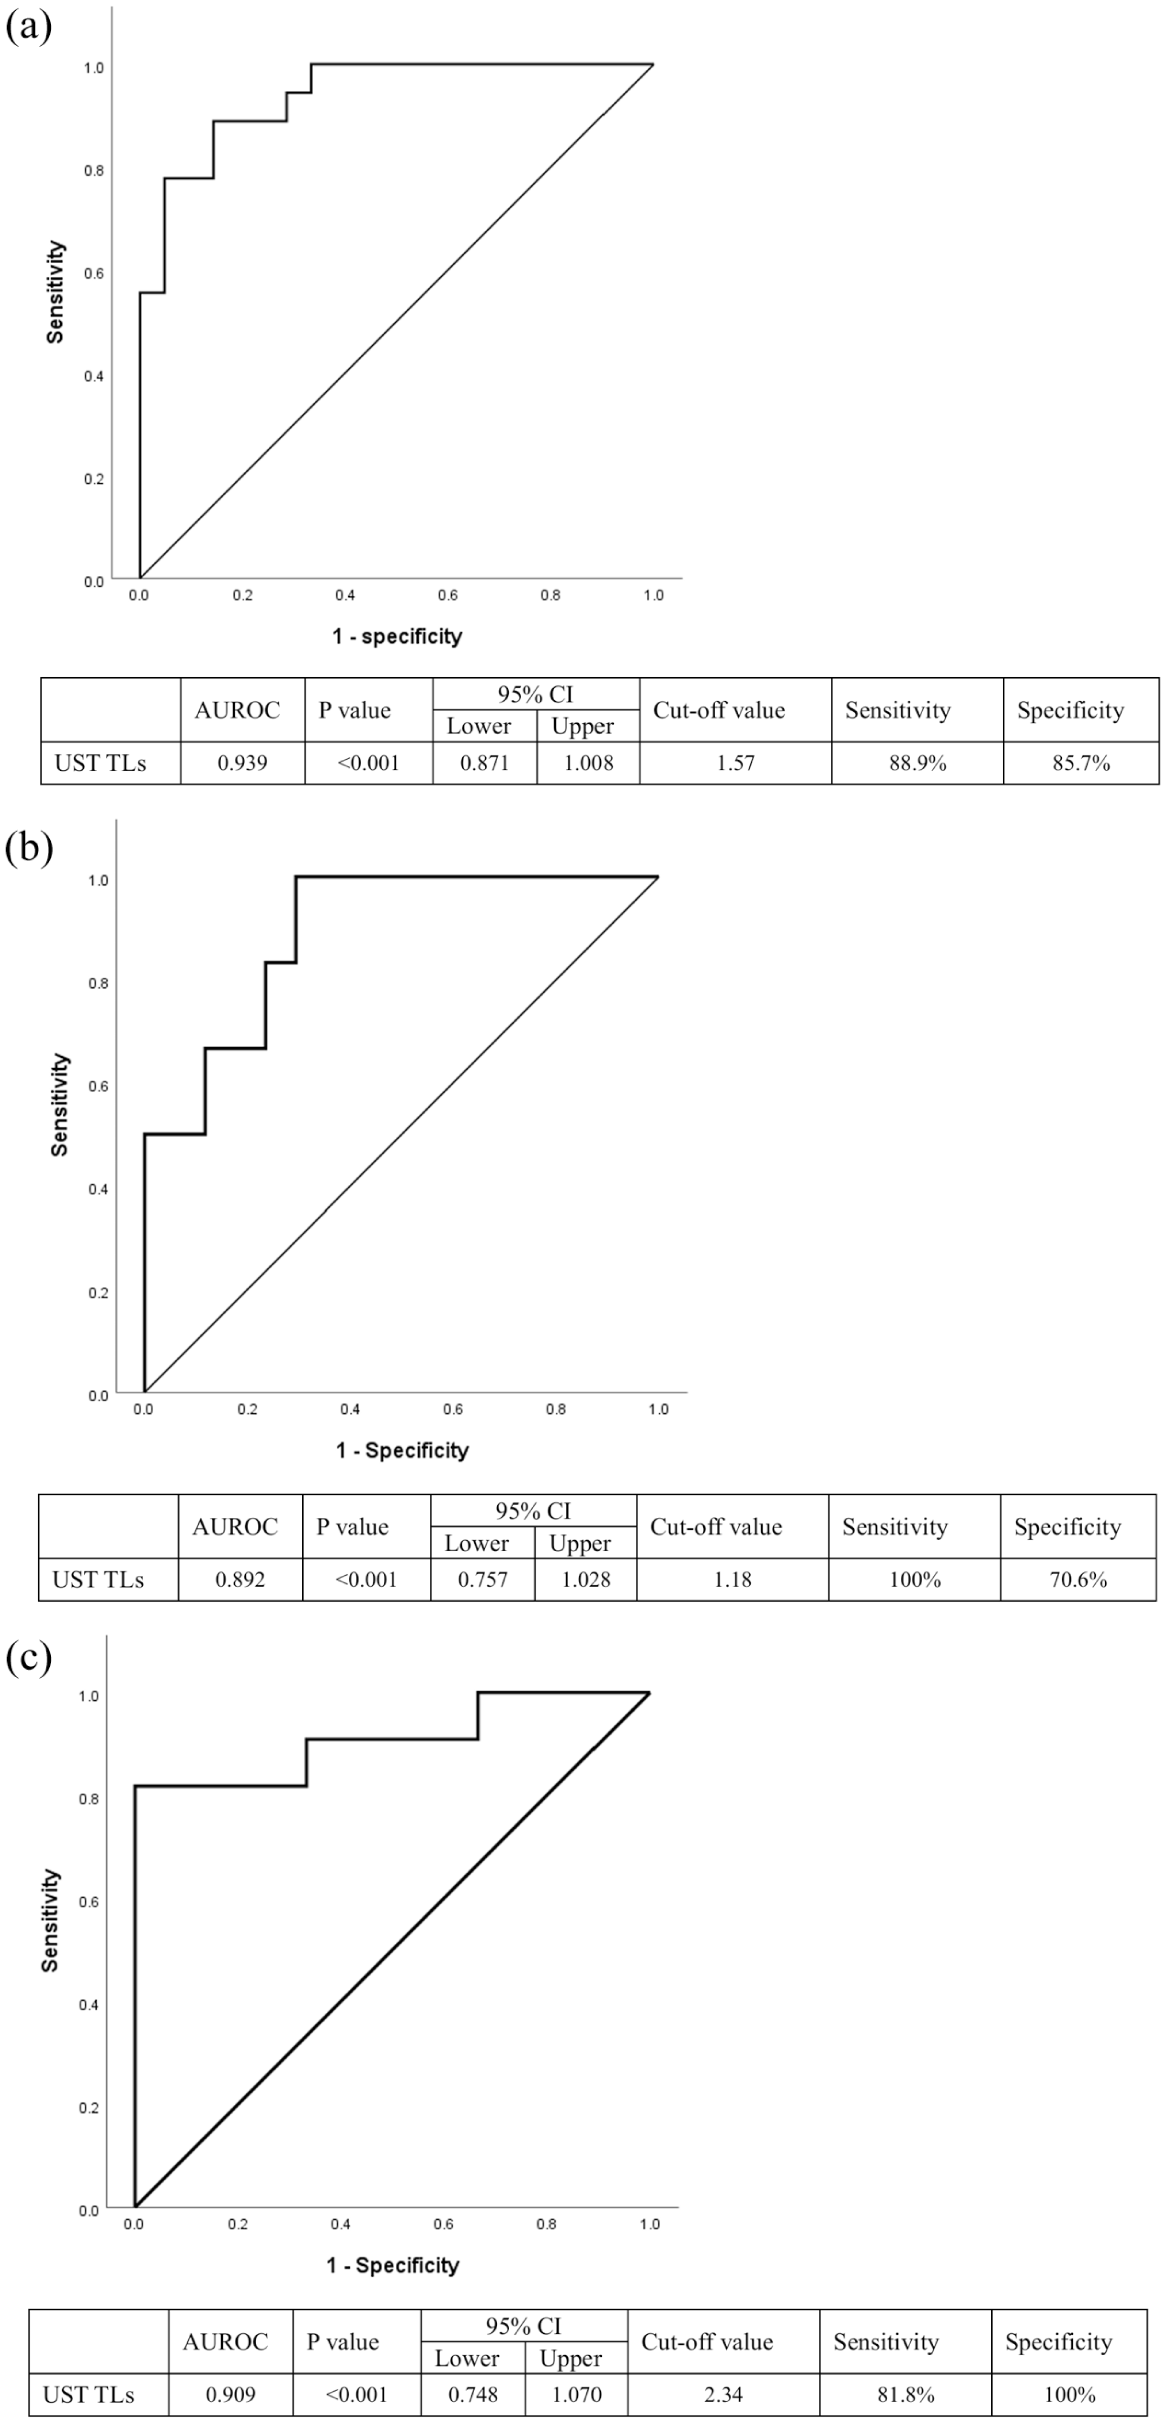
Diagnostic performance of ustekinumab trough concentration for predicting endoscopic remission at 1 year, assessed using the area under the ROC curve. The assessment was conducted in (a) all patients regardless of prior biologic exposure, (b) patients with a history of biologics use, and (c) biologic-naïve patients.
Discussion
This study aimed to evaluate UST TLs in the context of the ongoing debate regarding their association with clinical response and outcomes, as well as the lack of consensus on appropriate therapeutic thresholds. By stratifying patients according to prior biologic exposure, we investigated whether UST TLs should be interpreted differently across subgroups.
The clinical outcomes based on endoscopic remission were found to be associated with the UST TLs. However, most patients with prior biologic exposure exhibited relatively low TLs. Despite their low UST concentrations, several patients responded well to treatment and achieved endoscopic remission. Notably, at comparable low TLs, biologic-experienced patients achieved endoscopic remission, whereas biologic-naïve patients did not, highlighting a differential response pattern between the groups (Figure 2). This emphasizes the need to consider various factors that determine drug concentrations, among which prior use of biologic agents is likely to play a significant role. The blood concentration of a drug is influenced by various factors, including its pharmacokinetics. Three key factors that need to be considered are the formation of ADAs, the degree of inflammatory burden, and drug clearance.
In the UNITI-1, UNITI-2, and IM-UNITI clinical trials involving patients with Crohn’s disease, the ADA formation rate in response to UST was reported to be extremely low, at 2.3%.16,17 This low immunogenicity was attributed to UST having a fully human monoclonal antibody structure. Therefore, in the case of UST, ADA formation is unlikely to be a major factor contributing to reduced drug levels. As shown in Table 2, the two groups differed significantly in the proportion of immunomodulators used. However, according to the regression analysis evaluating endoscopic remission (Table 3), immunomodulator use did not have a significant impact on the outcome. The concomitant use of mesalazine and immunomodulators observed in our cohort can be explained by clinical and regulatory practice patterns. In group 1, patients had loss of response to previous biologic agents, and mesalazine or immunomodulators were added in some cases to provide additional disease control during the transition to UST. In group 2, biologics could not be prescribed immediately after diagnosis due to insurance restrictions, and thus all patients began treatment with mesalazine and immunomodulators. Even after biologic initiation, it is routine practice to maintain mesalazine and immunomodulators until a follow-up endoscopy at 1 year, when discontinuation is typically considered. This treatment approach explains why all patients in group 2 were still receiving mesalazine and immunomodulators concomitantly with UST. As a result of these practice patterns, there was a clear difference between the two groups in the proportion of patients receiving mesalazine or immunomodulators. However, since mesalazine use itself does not determine UST TLs, it was excluded from the additional multivariate logistic regression analysis. In terms of the inflammatory burden, the two groups did not differ significantly with regard to disease activity at the time of UST initiation. Although the Group 1 patients had slightly higher SES-CD values (likely due to the accompanying stenosis related to a longer disease duration), the levels of active inflammation were generally comparable between the groups at baseline. However, it should be noted that at year 1, Group 1 patients demonstrated higher SES-CD scores, ESR, and fecal calprotectin compared with Group 2, reflecting greater ongoing disease activity. This suggests that both increased disease activity and enhanced drug clearance, which are interrelated, may have contributed to the lower TLs observed in Group 1. These findings are consistent with the observation that clinical markers related to disease activity—such as SES-CD score, albumin, ESR, CRP, and fecal calprotectin at 1 year—were also significantly associated with ustekinumab TLs (Table 4). Furthermore, both the duration of prior IFX use and the disease activity evaluated by the SES-CD score at 1 year were independent predictors of UST TLs at 1 year. These findings reinforce that both previous biologic exposure and ongoing mucosal inflammation contribute independently to lower UST concentrations.
With regard to drug clearance, IgG-based therapies such as UST undergo intracellular recycling, a process mediated by the neonatal Fc receptor (FcRn). FcRn binds to the Fc portion of IgG molecules within endosomes, protecting them from lysosomal degradation and allowing their return to the circulatory system. 18 However, if the drug fails to bind to FcRn, it is directed toward lysosomal degradation, resulting in its increased clearance. Therefore, reduced FcRn expression or impaired FcRn-binding affinity may accelerate elimination of the drug and lower its serum concentrations. 19 We hypothesized that prior exposure to other biologic agents, particularly those with an IgG-based structure, may influence FcRn function and thus contribute to altered UST pharmacokinetics. This mechanism may be particularly relevant in patients with extensive histories of biologic use. As IFX, adalimumab, and vedolizumab are all IgG-based monoclonal antibodies, prolonged exposure to these agents may impose a sustained IgG burden that could impair FcRn function, potentially leading to increased clearance of subsequent IgG-based therapies. Physiological variables, such as an increase in body weight and hypoalbuminemia, may impair FcRn-mediated recycling, thereby contributing to enhanced clearance of the drug and its reduced serum concentrations. Body weight is a well-established covariate influencing the pharmacokinetics of monoclonal antibodies, including UST. Heavier patients generally exhibit increased drug clearance due to larger distribution volumes and enhanced catabolic activity of IgG antibodies, leading to lower TLs at equivalent dosing. Similar observations have been consistently reported in population pharmacokinetic studies of UST and other biologics in IBD patients.20–22 Consistent with this reasoning, we found that longer disease duration and prolonged prior IFX exposure were negatively correlated with ustekinumab TLs. In addition, we found a significant association between UST TLs and body weight (kg; Table 4). Furthermore, in the logistic regression analysis of factors associated with endoscopic remission, the weight-based maintenance dose was identified as a significant predictor (Table 3). These findings suggest that body weight may influence drug concentrations by affecting clearance of the drug and, consequently, its clinical efficacy. Accordingly, if UST receives regulatory approval for pediatric use, weight-based zone selection will be critical for both the induction and maintenance phases of the therapy. Although our initial interpretation emphasized pharmacokinetic mechanisms as the main explanation for the lower UST TLs in group 1, it should be recognized that pharmacokinetics and disease activity are interdependent. Greater inflammatory activity may accelerate drug clearance, while lower drug exposure can, in turn, contribute to persistent inflammation. Therefore, the differences observed between the groups are likely the result of an interplay between pharmacokinetic processes and disease activity rather than either factor alone.
Taken together, although biologic-experienced patients exhibited poorer clinical, biochemical, and endoscopic outcomes and had lower ustekinumab TLs compared with biologic-naïve patients, some patients in this group still achieved endoscopic remission despite lower drug concentrations. This suggests that the therapeutic threshold of ustekinumab may not be uniform across all patient populations but may vary according to prior biologic exposure and disease characteristics. These findings highlight the need for larger, prospective studies to establish individualized therapeutic cutoff values for ustekinumab, taking into account prior biologic treatment history. Such work will help resolve the apparent discrepancy between lower TLs and remission in bio-experienced patients observed in our cohort. We tentatively propose that different therapeutic cutoff values may be applied when assessing remission in biologic-experienced versus biologic-naïve patients. This hypothesis is further supported by the high diagnostic accuracy demonstrated in our subgroup-specific AUC analyses.
A limitation of this study is its relatively small sample size. Moreover, the analyses may be confounded by differences in group composition, as bio-naïve patients were generally less sick and exhibited higher TLs compared with bio-experienced patients. This imbalance in baseline disease burden likely influenced our findings and underscores the need for careful interpretation. However, unlike previous studies on IFX TLs, which primarily focused on biologic-naïve patients and in which the therapeutic cutoff values were well established, this study offers meaningful insights by stratifying patients according to prior biologic exposure. This underscores the importance of accounting for the treatment history of the patient when interpreting the drug concentrations of second-line biologics. Accordingly, our findings serve as a valuable reference for future research studies in this field.
Conclusion
In conclusion, the prediction of therapeutic response with TLs should account for major elements: the current disease activity and the biologic treatment history of the patient, the latter of which may affect drug clearance mechanisms. Defining drug concentration thresholds according to the prior treatment history of the patient reflects a shift toward personalized therapeutic approaches, consistent with the evolving paradigm of precision medicine. Furthermore, if UST receives regulatory approval for pediatric use, careful selection of weight-based dosing zones will be essential to optimize both induction and maintenance therapies, thereby ensuring effective and individualized treatment in this population.
Supplemental Material
sj-doc-1-tag-10.1177_17562848251393074 – Supplemental material for Toward personalized therapeutic drug monitoring of ustekinumab in Crohn’s disease: influence of previous exposure to biologics
Supplemental material, sj-doc-1-tag-10.1177_17562848251393074 for Toward personalized therapeutic drug monitoring of ustekinumab in Crohn’s disease: influence of previous exposure to biologics by Yiyoung Kwon, Yoon Zi Kim, Tae Jong Jeong, Seon Young Kim, Hansol Kim, Eun Sil Kim, Yon Ho Choe and Mi Jin Kim in Therapeutic Advances in Gastroenterology
Supplemental Material
sj-docx-2-tag-10.1177_17562848251393074 – Supplemental material for Toward personalized therapeutic drug monitoring of ustekinumab in Crohn’s disease: influence of previous exposure to biologics
Supplemental material, sj-docx-2-tag-10.1177_17562848251393074 for Toward personalized therapeutic drug monitoring of ustekinumab in Crohn’s disease: influence of previous exposure to biologics by Yiyoung Kwon, Yoon Zi Kim, Tae Jong Jeong, Seon Young Kim, Hansol Kim, Eun Sil Kim, Yon Ho Choe and Mi Jin Kim in Therapeutic Advances in Gastroenterology
Footnotes
Acknowledgements
None.
Declarations
AI disclosure
Not applicable. No AI tools, including generative or assistive technologies, were used in the preparation of this manuscript.
Supplemental material
Supplemental material for this article is available online.
References
Supplementary Material
Please find the following supplemental material available below.
For Open Access articles published under a Creative Commons License, all supplemental material carries the same license as the article it is associated with.
For non-Open Access articles published, all supplemental material carries a non-exclusive license, and permission requests for re-use of supplemental material or any part of supplemental material shall be sent directly to the copyright owner as specified in the copyright notice associated with the article.