
Abstract
Objective
The correlation between depression and prostatitis is widely acknowledged; however, there is a dearth of comprehensive risk models that can predict the risk of depression in patients with chronic prostatitis/chronic pelvic pain syndrome. In this investigation, we devised a predictive model to ascertain the likelihood of depression in these patients.
Methods
This prospective study enrolled 599 patients with chronic prostatitis/chronic pelvic pain syndrome between January 2022 and January 2025. The patients were randomly divided into training (70%, n = 419) and validation (30%, n = 180) cohorts. Using depression (Patient Health Questionnaire-9 score ≥10) as the primary outcome, we developed a nomogram using Boruta and least absolute shrinkage and selection operator feature selection followed by multivariate logistic regression. Model performance was assessed using receiver operating characteristic curve analysis (area under the receiver operating characteristic curve), calibration plots, and decision curve analysis, with internal validation performed in the validation cohort.
Results
The nomogram integrated seven readily available predictors (prostate progression, hypertension, International Prostate Symptom Score, number of nights with sleep disturbance, white blood cell count, triglyceride level, and hemoglobin level) and showed excellent performance (area under the receiver operating characteristic curve values = 0.864 in the training cohort and 0.911 in the validation cohort).
Discussion
This nomogram can help urologists quickly identify chronic prostatitis/chronic pelvic pain syndrome patients at high risk of depression, enable early psychological intervention, and improve the quality of life of these patients.
Keywords
Introduction
Chronic prostatitis/chronic pelvic pain syndrome (CP/CPPS) is a National Institutes of Health Class III illness characterized by pelvic pain or discomfort for ≥3 months over the past 6 months, sexual dysfunction, and other urinary symptoms. 1 According to epidemiological research, the global prevalence of CP/CPPS varies between 9% and 16%. 2 As with cardiovascular disease, particularly severe congestive heart failure, long-term chronic pain lowers the quality of life (QOL).3,4 Depression is a unique prostatitis comorbidity. Approximately 60% of CP/CPPS patients experience major depression. 5 Psychological treatment is useful in CP/CPPS patients because depression exerts considerable influence on patient management. 6 Therefore, it is crucial to predict the risk of depression and establish early diagnosis in this patient group, considering the high prevalence of depression among them. Researchers can develop the most accurate prediction models based on massive datasets using machine learning (ML). ML has been used in the United States to build classification models that can consistently diagnose depression based on demographic, social, and clinical characteristics in the general population7,8 and in those with chronic diseases such as diabetes 7 and heart disease. 9 However, CP/CPPS patients are not tested thoroughly for depression.
To enable early intervention in patients with CP/CPPS, ML algorithms for depression screening must be created. Recently, several ML models have been developed for diagnosing clinical depression. Deep learning algorithms and artificial neural networks have proved successful in precision psychiatry. 10 ML models such as Random Forest (version 4.7-1.1, implemented in the randomForest R package) have been used to predict depression in chronic conditions; however, these models focus on the general population or patients with other diseases rather than those with CP/CPPS. 11 Although ML models for depression prediction frequently use large datasets (e.g. the National Health Survey), CP/CPPS-specific data are scarce. Our study utilized clinical data (routine laboratory tests, International Prostate Symptom Score (IPSS), and sleep measures) from 599 CP/CPPS patients to develop a practical model because these variables are readily available in urology clinics and do not rely on complex neuroimaging or psychosocial data. Currently, feature selection for predictive modeling in disease-specific populations extensively adopts this approach of utilizing readily available clinical variables.12,13
To predict the likelihood of depression in patients with CP/CPPS, our study sought to develop a nomogram based on clinical parameters. By concentrating on high-risk groups, clinicians can develop effective prevention strategies that can further enhance early detection and enable more effective management of depression in this vulnerable population. In addition, they can assist CP/CPPS patients in making decisions about the use of diagnostic tests, treatments, or lifestyle modifications that will ultimately improve their QOL.
Patients and methods
Study design and participants
This real-world, observational, retrospective study was based on electronic medical records that reflect routine clinical practice and the real-world health status of patients. The reporting of this study complies with the Strengthening the Reporting of Observational Studies in Epidemiology (STROBE) guidelines. 14 We retrospectively examined 599 CP/CPPS patients treated at the Urology Clinic of Nantong First People’s Hospital between 1 October 2022 and 7 March 2025. All patients with CPPS in our study strictly met the following diagnostic criteria provided in the European Association of Urology CPPS 2022 guidelines: (a) chronic pelvic pain (duration ≥3 months over the past 6 months); (b) no evidence of urinary tract infection (negative urine culture); or (c) other organic causes (e.g. bladder stones or prostate cancer, as confirmed via transrectal ultrasound and serum prostate-specific antigen testing). Diagnosis was performed by two senior urologists (with ≥10 years of clinical experience) who independently reviewed the patients’ clinical symptoms, performed physical examinations (including digital rectal examination), and analyzed the laboratory findings and imaging data; discrepancies were resolved through joint discussion to ensure consistency in diagnosis. We further excluded people who had a history of psychiatric disorders and chronic psychotropic drug use.
Ethics and informed consent
The study followed Helsinki Declaration guidelines (1975, updated in 2024). This study was approved by the Ethics Committee of the Nantong First People’s Hospital (Approval No.: 2025KT077, July 2025). This retrospective observational study used de-identified patient data and did not involve any risk of harm; therefore, informed consent from patients was not required.
Identification of the best predictors
Based on data availability and previous reports, we identified potential predictors of depression.8,15 These include biomarkers; anthropometric parameters; and behavioral, clinical, and sociodemographic factors.
Sociodemographic factors such as educational level, marital status, and age were measured. Behavioral variables including activity duration, alcohol consumption status, and smoking status were assessed. Chronic conditions such as diabetes, high blood pressure, and cancer as well as body mass index (BMI), IPSS, and prostate volume are examples of clinical factors. Segmented neutrophil, white blood cell (WBC), platelet, monocyte, and lymphocyte counts; red blood cell distribution width; mean cell volume; glycated hemoglobin; and γ-glutamyltransferase, alanine aminotransferase, alkaline phosphatase, triglyceride, total cholesterol, direct high-density lipoprotein cholesterol, sodium, total bilirubin, hemoglobin, hematocrit, albumin, potassium, uric acid, and creatinine levels were measured during the hematological examination. “Number of nights” referred to “the number of times you get up to urinate every night.” A frequency of ≥3 times/night was scored as 1 and that of <3 times was scored as 0.
Definition of depression
We used the Patient Health Questionnaire-9 (PHQ-9) 16 to diagnose depression. The PHQ-9 contains nine items based on the diagnostic criteria for depression provided in the Diagnostic and Statistical Manual of Mental Disorders IV. Each item assesses the frequency of depressive symptoms on a 3-point scale (0 indicates “not at all” and 3 indicates “almost every day”). Scores range from 0 to 27, with higher scores associated with greater depression severity. We chose 10 as the threshold for depression diagnosis because this is a reliable threshold with acceptable sensitivity and specificity for detecting major depression. 17
Feature selection
We utilized feature selection to remove unnecessary characteristics that might affect model performance because not all features included important information. We assessed two ML algorithms (Boruta and least absolute shrinkage and selection operator (LASSO)), which selected strategies that created the most relevant feature set for our eventual predictions.
The Boruta wrapper approach, based on random forests, determines all relevant qualities by comparing the relevance of random copies of attributes to the original qualities. 18 The regression technique LASSO lowers the regression coefficient of redundant features to 0 19 and selects and regularizes variables using the L1 penalty. Based on least partial likelihood deviation, 10-fold cross-validation was used in this study to modify the penalty parameter lambda (λ). The model included features that have non-zero coefficients in the optimal λ. Until the required number of predictor variables is obtained, backward elimination eliminates the predictor variables that are not significant to the model based on the Akaike information criterion value. 20 We utilized the glmnet package (version 4.1-8, R Foundation for Statistical Computing) for LASSO and the Boruta package for Boruta.
Statistical analyses
All statistical analyses were performed using R statistical software (version 4.4.1), with the statistical significance set at a p-value of <0.05. LASSO regression was used to reduce high-dimensional data and determine depression predictors. 21 A preliminary screening of depression risk variables was performed using univariate logistic regression analysis of the training group. We also used Boruta’s feature selection method with 100 random forest iterations and logistic regression to create prediction models. Validation of nomograms requires calibration graphs and C-statistics. C-statistic values >0.75 indicate good discrimination. Finally, we assessed the clinical applicability of the nomogram using clinical impact curve (CIC) and decision curve analysis (DCA). Statistical significance was set at p < 0.05 for all analyses.
Results
Clinical features
From 1 October 2022 to 7 March 2025, we conducted a retrospective analysis of 599 patients with CP/CPPS who were treated at the Urology Clinic of Nantong First People’s Hospital. Figure 1 shows a flow chart depicting the case selection and research procedure. The patients’ demographic features are detailed in Table 1.

Research pathway diagram.
Baseline characteristics of patients.

BMI: body mass index; IPSS: International Prostate Symptom Score; PSA: prostate-specific antigen.
Risk factors associated with depression
First, we randomly divided a total of 599 CP/CPPS patients into training (70%, n = 419) and validation (30%, n = 180) cohorts using a stratified random sampling method (to ensure balanced distribution of depressive status between the cohorts). Second, univariate logistic regression was performed on the training cohort to screen for variables associated with depression (p < 0.05), initially identifying 12 candidate features (Table 2). LASSO regression (10-fold cross-validation on the training cohort) was applied to 12 candidate features to eliminate multicollinearity and redundant variables, retaining 8 features. Figure 2(a) numerically shows the LASSO technique for screening variables with eight variable coefficients that fluctuate with penalty coefficients. When the coefficient was 0, the initial integration component coefficient was compressed and removed from the model. Different variables are present in each row. Figure 2(b) shows how the area under the receiver operating characteristic (ROC) curve (AUC) with 10-fold cross-validation selected target covariates. Min and Lambda are Lambda lines. LOESS (Locally Estimated Scatterplot Smoothing; abbreviated as “Lse” in the figure) and red dots indicate confidence intervals (CIs) for the covariate of interest at the λ value. Eight factors were selected: educational level, prostate volume, hypertension, IPSS, number of nights, WBC count, triglyceride level, and hemoglobin level. The Boruta algorithm (based on random forest with 100 iterations of the training cohort) was further used to verify feature importance, finally confirming seven nonredundant predictive features (prostate volume, hypertension, IPSS, number of nights, WBC count, triglyceride level, and hemoglobin level) (Figure 2(c)). The seven derived variables were valued using logistic multivariate regression. Logistic regression analysis data were examined for variable collinearity using multiple diagnostic tests. Collinearity was absent, and each index’s variance inflation factor was <5. Seven components were included in the regression model following comprehensive inclusion regression analysis (Table 3).
Univariate Cox regression analysis of risk factors associated with depression in patients with chronic prostatitis/chronic pelvic pain syndrome (CP/CPPS).
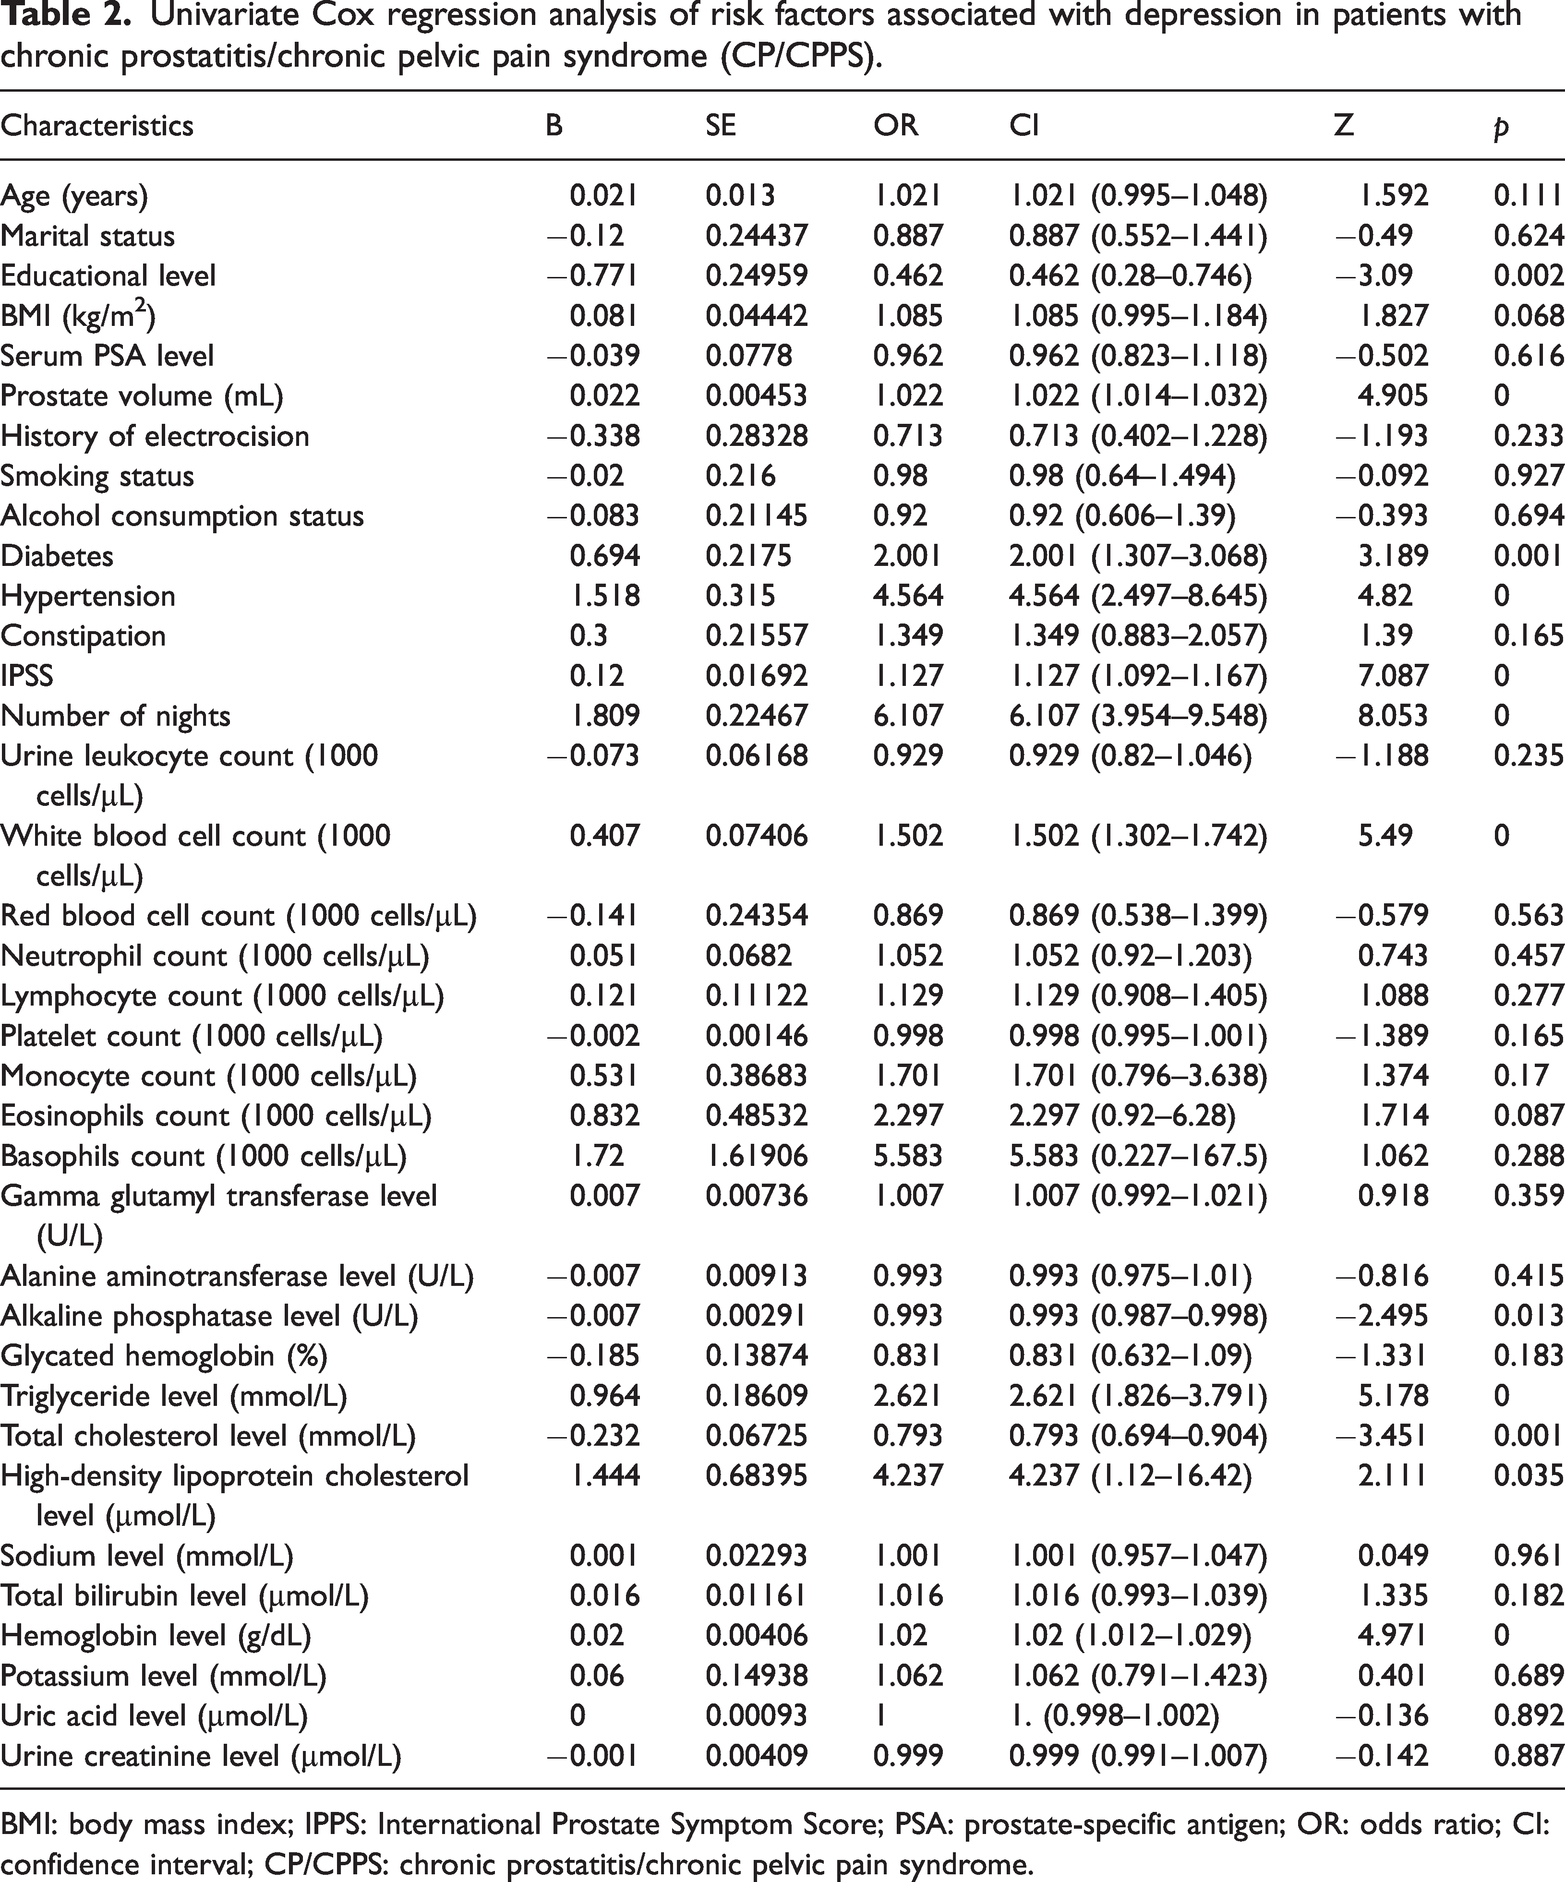
BMI: body mass index; IPPS: International Prostate Symptom Score; PSA: prostate-specific antigen; OR: odds ratio; CI: confidence interval; CP/CPPS: chronic prostatitis/chronic pelvic pain syndrome.

The Boruta approach was utilized for feature selection, while the LASSO approach was used for significant variable selection. (a) Clinical characteristics’ LASSO coefficient profiles. (b) Tenfold cross-validation in LASSO was used to determine the ideal penalization coefficient lambda. The lambda value of the smallest mean square error is displayed in the graphic. LASSO is the smallest absolute shrinkage and selection operator and (c) Boruta’s chosen function. LASSO: least absolute shrinkage and selection operator.
Multivariate logistic regression analysis of risk factors for depression.
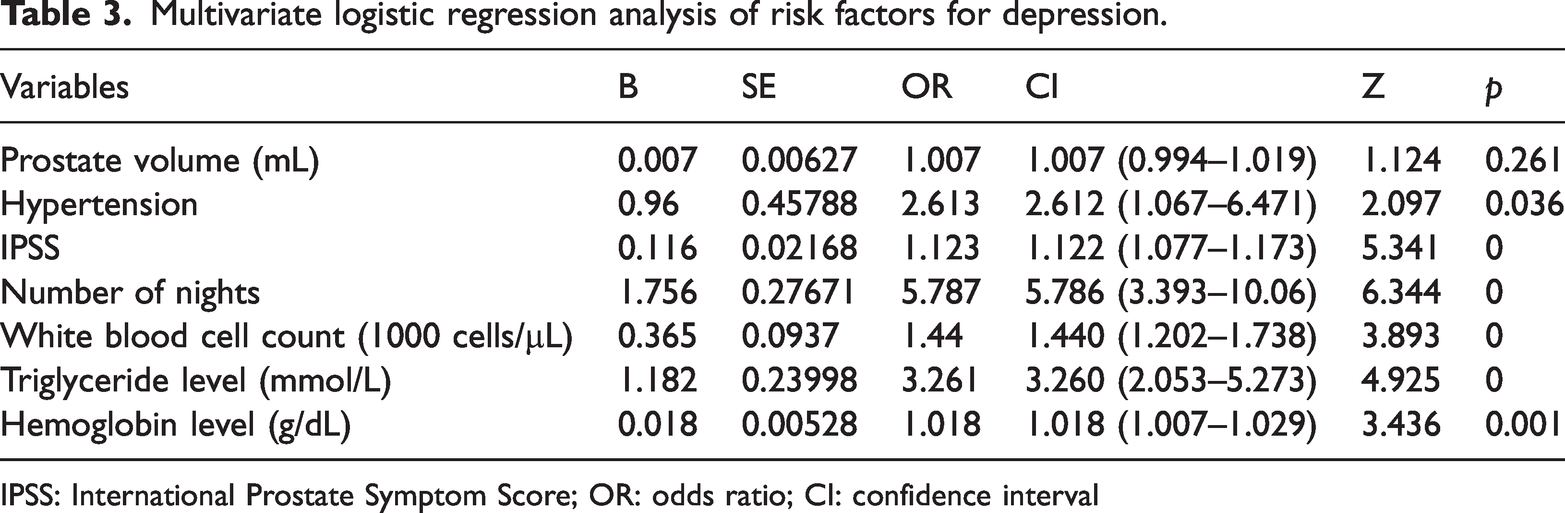
IPSS: International Prostate Symptom Score; OR: odds ratio; CI: confidence interval
Modal chart model for estimating depression risk
The recruited patients were randomly sorted into training and test groups in a 7:3 ratio (Supplementary Data). We used LASSO regression, Boruta feature selection, and binary logistic regression to establish personalized nomogram estimates to predict the depression risk in CP/CPPS patients based on risk variables (Figure 3). This modal plot assigns a score (ranging from 0 to 100) to each factor, with the score directly reflecting the strength of the factor’s association with depression based on its regression coefficient. A patient’s depression risk was calculated by adding the category scores. All factor axes that intersect the nomogram’s point axis are represented by vertical lines in this computation. The final total score can be compared with that in the table for clarity.

The likelihood of depression in CP/CPPS patients was predicted using Boruta’s feature selection method and clinical nomograms based on multiple logistic regression (1 = yes and 0 = no). For each indication, a line is constructed connecting the associated value to the “dot line” to allocate points. By utilizing the sum of individual scores for the seven variables that comprise the nomogram and computing the probability of the same sum, we can ascertain a patient’s risk of depression. CP/CPPS: chronic prostatitis/chronic pelvic pain syndrome.
Validation of nomogram models
The AUC values in the training (Figure 4(a)) and validation (Figure 4(b)) cohort models were 0.864 (95% CI: 0.8258–0.9022) and 0.911 (95% CI: 0.8663–0.9547), respectively. Training and validation cohorts confirmed successful model calibration. Both validation and training cohorts showed satisfactory model correction based on the Hosmer–Lemeshow goodness-of-fit test ((χ2 = 8.010, p = 0.4325) and (χ2 = 13.968, p = 0.0826), respectively). The calibration study used 500 Bootstrap internal samples to calibrate the model. For the training set (Figure 5(a)), the Brier score was 0.133 with a p-value of 0.781 (>0.05), while for the validation set (Figure 5(b)), the score was 0.114 with a p-value of 0.857 (>0.05). The calibration curve showed a strong correlation between the actual likelihood and anticipated probability.

Evaluation and internal validation of the nomogram. The model’s good discriminating ability was demonstrated by the AUC values of the (a) training group (AUC = 0.864) and (b) validation group (AUC = 0.911). 1. The gray coarse diagonal line (“ideal calibration line”) represents the ideal scenario where the predicted risk equals the actual risk; any deviation from this line indicates that the model predicted result does not match the actual result. 2. The dark black line (“training cohort”) reflects the relationship between the depression risk predicted by the model and the actual depression rate in the training cohort (used to construct the model). 3. False black line (“validation cohort”) reflects the same relationship in the independent validation cohort (not used for model training) to test the generalizability of the model. AUC: area under the curve.

The agreement between the predicted and actual risk of depression in CP/CPPS patients was assessed using a calibration curve. The training and validation groups’ calibration curves are displayed in (a) and (b), respectively.
Analysis of the clinical practicability and rationality of the prediction model
We assessed the nomogram’s clinical usefulness by using dialysis vomiting incidence as a state variable and calibration plot probability as a test variable. Figure 6 shows the clinical DCA of our nomogram model. The threshold probability and net benefit are depicted on the X- and Y-axes, respectively. A solid gray line suggests that all patients experienced depression, while a narrow solid black line suggests that none of them did. The decision curve illustrates that the model is clinically usable across a large threshold probability range, while the red curve represents the benefit for patients using the prediction model for this study. The clinical effect curves (Figure 7(a) and (b)) virtually matched when used to stratify a 1000-person population, proving that this prediction model performs effectively in clinical settings.

Clinical decision curves for nomogram models. (a) Decision curve for the training set and (b) Decision curve for the validation set.

Clinical impact curve during (a) training and (b) validation. The clinical impact curve of the model was observed. The red line indicates the number of individuals considered to be at high risk by the model based on different probability factors. The blue line shows the number of individuals identified to be at high risk who experienced an outcome at probabilities below specific thresholds.
We compared the ROC curves of expected nomograms and single-predictor models for a more detailed examination. Figure 8 shows the model’s plausibility: the AUC for the nomogram was higher than those for the IPSS, number of nights, WBC count, triglyceride level, hemoglobin level, prostate volume, and hypertension. This demonstrates that the predictive model performed well because individual predictors had lower depression rates than the model. Additional nomogram model findings showed that depressed individuals scored considerably higher than nondepressed individuals (Figure 9).

Rationality curve analysis of the residual variable risk nomogram.

Nomogram model scores in the (a) training and (b) training sets.
Discussion
In this study, we developed a unique model to predict depression in CP/CPPS patients. Our model identified high-risk cases using seven clinical parameters and biomarkers from conventional health evaluations: prostate volume, hypertension, IPSS, number of nights, WBC count, triglyceride level, and hemoglobin level. Our results showed that the model could distinguish between depressed and nondepressed individuals with an AUC of 0.864 (95% CI: 0.8258–0.9022). The calibration plots also demonstrated that the model’s predicted and observed probabilities in the training and validation cohorts matched. DCA showed that our model has a strong net therapeutic effect under threshold probability.
Both physical and mental health issues are present in CP/CPPS patients; 22 78% of them report having depression, 2 and 60% of them fulfill the criteria for severe depression. 5 There are currently no well-established predictive models available to assess the depression risk in patients with CP/CPPS. However, previous studies have developed predictive models for depression in other patient categories. For instance, Zhou et al. predicted anxiety and depression with an AUC of 0.802 using ML and multimodality neuroimaging. 23 Using 48 clinical, sociodemographic, and psychosocial variables, Kautzky et al. predicted treatment results for depression with an AUC of 0.737. 24 An ML-based predictive model for depression in hypertensive individuals was created by Lee and Kim. 25
Our work offers various advantages over previous studies. Using Boruta feature selection and LASSO regression, we identified seven independent predictors of depression in CP/CPPS patients, including prostate volume, hypertension, IPSS, number of nights, WBC count, triglyceride level, and hemoglobin level. The model showed excellent discriminative ability (AUC: 0.864 in the training cohort and 0.911 in the validation cohort) and good calibration, with a favorable net clinical benefit (DCA) across a wide threshold probability range. Furthermore, our technique employs only seven easily available high-risk criteria, making it easier and more successful in clinical practice. Finally, our method addresses depression prediction in CP/CPPS patients, making it useful for physicians.
We identified significant indicators such hemoglobin level, lipid profile, IPSS, number of nights, prostate volume, hypertension, and WBC count throughout the model. Liu et al. discovered that 439 (1.46%) men experienced benign prostatic hyperplasia and had greater depression levels than women (10.18 ± 4.22 vs. 9.28 ± 4.00). 26 Growing evidence shows a connection between depression and hypertension. Comorbidities and poorly managed blood pressure are considered predictors of depression symptoms. Our findings that hypertensive CP/CPPS patients had a 2.6-fold higher risk of depression (odds ratio (OR): 2.612, 95% CI: 1.067–6.471) are consistent with evidence that comorbid hypertension exacerbates psychological distress. 27 Thus, it is essential to screen for mental health symptoms in hypertension patients. In addition, sleep disturbance is associated with a 5.8-fold increased risk of depression (OR: 5.786, 95% CI: 3.393–10.06), supporting the findings of Nodine and Matthews (2013), 28 according to which sleep disruption triggers neuroendocrine changes associated with mood disturbance. Greater prostate volume was independently associated with more severe lower urinary tract symptoms (LUTS), and higher IPSSs (indicative of worse LUTS) were independently associated with depression (OR: 1.122, 95% CI: 1.077–1.173). This is consistent with previous reports. 29 Triglycerides played a significant role in building a depression prediction model that covered both general population and people with high BMI in Lin et al.’s investigation utilizing random forest. 7 Elevated triglycerides (metabolic markers; OR: 3.260, 95% CI: 2.053–5.273) were associated with a higher risk of depression, consistent with the study by Sharma and Verbeke. 15 Furthermore, elevated WBC count (a marker of low-grade inflammation; OR: 1.440, 95% CI: 1.202–1.738) was associated with a higher risk of depression, consistent with previous studies.30,31 Finally, anemia is becoming a more significant concern as one of the lesser known modifiable risk factors for depression. Anemia is typically linked to conditions such as cancer, chronic renal failure, and starvation that usually occur before the development of a sad mood. 32 Depressive symptoms are often linked to signs of low hemoglobin levels, such as pallor, exhaustion, lightheadedness, and dyspnea after physical exertion. 33 Anemia may play a pathophysiological role in depression due to persistent hypoxemia, according to some theories,34,35 which emphasizes the importance of including hemoglobin level in our model.
Finally, CP/CPPS is essential to our methodology. Patients often suffer long-term effects with respect to family relationships in addition to psychological and physical pain. 36 For therapeutic intervention, a model that accurately predicts depression in CP/CPPS patients is essential. This methodology helps urologists promptly make tailored diagnoses for efficient and customized therapy. The model can identify psychiatric patients who need more rigorous therapy or diagnostic testing based on prostate volume, hypertension, number of nights, IPSS, lipid profile, WBC count, hemoglobin level, and other high-risk indications. Nomograms enable healthcare practitioners to examine and communicate model output to patients. Clinical decision curve, CIC, and net reduction curve research show that this methodology might improve patient outcomes and lower healthcare expenditures. 37
However, there are certain limitations associated with our study. This cross-sectional study was conducted in an isolated center with a limited sample size and may include selection bias. In addition, we only performed internal validation of the nomogram model; subsequent studies should perform external validation. Future studies should be conducted in a large sample, multicenter, prospective setup to identify additional risk factors for depression in patients with prostatitis. Second, the fact that our model was constructed using data that were collected after the event had occurred raises the possibility of selection bias and confounding. A self-reported questionnaire was utilized in this study to support the diagnosis of depression. Neither direct patient examinations nor actual clinical records were used to support the diagnosis of depression. In addition, compared with other demographic studies, our sample size was relatively small. Expanding the database for training predictive models could ultimately lead to the establishment of models that have actual therapeutic applications. This would allow for more complete integration of the variances observed in patients with depression. Furthermore, because the present study utilized cross-sectional data, it is not possible to establish causality between the inputs of the prediction model and outputs. For instance, there may be a reciprocal association between depression and CP/CPPS. This is because our study employed cross-sectional analysis. The next step in determining the dependability and generalizability of our model is to conduct external validation in other clinical settings.
Conclusion
Our model may serve as a clinical tool to assess depression risk in CP/CPPS patients and assist in developing preventive measures for high-risk groups; however, it cannot provide conclusions on causal effects.
Supplemental Material
sj-pdf-1-imr-10.1177_03000605251399460 - Supplemental material for Risk model for depression in patients with chronic prostatitis/chronic pelvic pain syndrome: A retrospective cross-sectional study
Supplemental material, sj-pdf-1-imr-10.1177_03000605251399460 for Risk model for depression in patients with chronic prostatitis/chronic pelvic pain syndrome: A retrospective cross-sectional study by Cheng Shen, Yuanfei Ji, Wei Zhang, Xingxing Fang, Junjie You and Bing Zheng in Journal of International Medical Research
Footnotes
Acknowledgments
None.
Author contributions
CS wrote the first draft of the manuscript.
CS, YFJ, WZ, and XXF collected and analyzed the data. JJY and BZ supervised the work.
Consent for publication
Not applicable.
Conflict of interest
The authors report no conflicts of interest in this work.
Data availability statement
All data are provided within the manuscript or in supplementary information files.
Declaration of conflicting interests
The authors report no conflicts of interest with respect to this work.
Ethics approval and consent to participate
The research involving human participants was reviewed and approved by the Medical Ethics Review Committee of the Nantong First People’s Hospital, in strict adherence to the principles of the Declaration of Helsinki, and informed consent was obtained from all participants.
Funding
The authors disclosed receipt of the following financial support for the research, authorship, and/or publication of this article: Yaodong Shenzhou-Pharmaceutical Research Capacity Building Fund Project (2024-KY002-01), Nantong University Clinical Medicine Special Scientific Research Fund Project (2024LQ019), and Basic Research and Social Minsheng Plan Project (MS22022085).
References
Supplementary Material
Please find the following supplemental material available below.
For Open Access articles published under a Creative Commons License, all supplemental material carries the same license as the article it is associated with.
For non-Open Access articles published, all supplemental material carries a non-exclusive license, and permission requests for re-use of supplemental material or any part of supplemental material shall be sent directly to the copyright owner as specified in the copyright notice associated with the article.