
Abstract
Background:
The value of intestinal ultrasound (IUS) in predicting treatment outcomes in ulcerative colitis (UC) remains underexplored.
Objectives:
To compare the predictive accuracy of representative IUS scores for long-term endoscopic outcomes in UC.
Design:
A retrospective observational study.
Methods:
Consecutive UC patients initiating biologics/small-molecule drugs were enrolled. IUS examinations were performed at baseline, 4–6 months, and at the first colonoscopy reassessment (12–30 months). IUS images were reviewed, and bowel wall thickness (BWT), Milan ultrasound criteria (MUC), and International Bowel Ultrasound Segmental Activity Score (IBUS-SAS) were recorded. Endoscopic response was assessed using the Mayo Endoscopic Score (MES), with remission defined as MES = 0 and improvement as MES ⩽1.
Results:
Forty-nine patients were included. All three IUS scores showed significant correlations with concurrent MES, with IBUS-SAS demonstrating the strongest association (BWT, ρ = 0.54; MUC, ρ = 0.55; IBUS-SAS, ρ = 0.69). IBUS-SAS at 4–6 months was the most accurate predictor of long-term endoscopic remission (area under the curve (AUC) 0.767) and endoscopic improvement (AUC 0.770). On multivariable analysis, an IBUS-SAS score <25.5 at 4–6 months was the only independent predictor of endoscopic remission (odds ratio (OR) 7.6, p = 0.005), while an IBUS-SAS score <38.0 was the only independent predictor of endoscopic improvement (OR 5.8, p = 0.006).
Conclusion:
The IBUS-SAS score at early follow-up may serve as a valuable predictor of long-term endoscopic outcomes in UC.
Plain language summary
This retrospective cohort study compared representative intestinal ultrasound scores (BWT, MUC, and IBUS-SAS) in predicting long-term endoscopic outcomes in UC, and showed that IBUS-SAS at 4-6 months post-treatment was the most accurate predictor of the endoscopic remission (AUC 0.767) and improvement (AUC 0.770).
Introduction
Ulcerative colitis (UC) is a chronic inflammatory bowel disease (IBD) characterized by mucosal inflammation of the colon.1,2 A “treat-to-target” strategy has been widely adopted in clinical practice, with endoscopic healing, as assessed by colonoscopy (CS), recognized as the primary long-term treatment goal in UC. 3 However, CS is an invasive, uncomfortable procedure with potential risks of exacerbating existing symptoms or triggering new complications, leading to low patient compliance during follow-up.4,5 Intestinal ultrasound (IUS) has emerged recently as a non-invasive, cost-effective, and reliable tool suitable for closely monitoring disease activity and facilitating timely clinical decision-making. 6 Several studies have demonstrated that IUS can evaluate the treatment response to biologics with high diagnostic accuracy.7,8 In addition, early IUS within 3 months of biological therapy can predict treatment outcomes at 1 year.9,10
IUS parameters, such as bowel wall thickness (BWT), color Doppler signs (CDS), bowel wall stratification (BWS), and inflammation of the mesenteric fat, are critical for disease activity evaluation in UC. 11 Among these, BWT is the most important parameter, presenting strong consistency with CS findings. 12 Several IUS scoring systems have also been developed for IBD based on these parameters.13–17 For instance, the Milan ultrasound criteria (MUC), one of the most representative scoring systems, utilizes BWT and bowel wall vascularity to accurately assess disease activity and predict treatment response in UC.10,18 Similarly, the International Bowel Ultrasound Segmental Activity Score (IBUS-SAS), initially developed for Crohn’s disease (CD) and demonstrated exceeding accuracy, has recently been validated for use in UC. This score incorporates BWT, bowel wall vascularity, inflammation of the mesenteric fat, and BWS.19–21 Despite their potential, none of these scoring systems has been formally integrated into international guidelines, and there is a lack of studies directly comparing their value in assessing treatment response and predicting long-term outcomes. 22
Therefore, the objective of this study was to perform a head-to-head comparison of the diagnostic accuracy of BWT, MUC, and IBUS-SAS in evaluating disease activity and predicting long-term endoscopic response, using CS as the gold standard.
Materials and methods
Study design and population
This was a single-center, retrospective observational study and was approved by the Institutional Review Board. Informed consent was waived. The reporting of this study conforms to the Strengthening the Reporting of Observational Studies in Epidemiology (STROBE) statement. Medical records of patients with an established diagnosis of UC in a tertiary referral center between November 2020 and June 2023 were consecutively reviewed. The inclusion criteria were as follows: (1) 18 years of age and older; (2) initiated and continued with advanced therapeutic regimen in our medical center, including biologics (vedolizumab orinfliximab) or small-molecule drugs (upadacitinib or tofacitinib); (3) had active disease prior to treatment (i.e., baseline), defined by an Mayo endoscopic score (MES) >0; and (4) underwent CS and IUS examinations at baseline and during follow-up assessment. The exclusion criteria were as follows: (1) disease limited to the rectum; (2) incomplete CS at baseline or follow-up; and (3) had severe systemic diseases, or other bowel disorders such as malignant intestinal tumors or infections.
Baseline demographic information, clinical history, Montreal classification, smoking status, medication usage, surgical history, C-reactive protein (CRP) levels, albumin levels, CS findings, and IUS findings were collected. A treat-to-target strategy was applied, with clinical plus endoscopic remission being regarded as the treatment targets. To evaluate treatment response, clinical symptoms, biochemical markers, and CS were assessed during follow-up, usually after 1 year of biologics/small molecule drugs usage. A MES was applied to CS examinations at baseline and reassessment. A mid-term assessment at 4–6 months after treatment was usually arranged, with only clinical symptoms, biochemical markers, and IUS examinations evaluated, but no CS (Figure 1).

Design of the study.
IUS examinations and interpretation
IUS examinations were performed by one of the four radiologists with more than 5 years of experience in abdominal imaging using a Philips EPIQ (Philips, Bothell, WA, USA) or a SuperSonic Aixplorer (SuperSonic Imaging, SA, France) machine equipped with convex (C5–2) and linear (L9–3) transducers. Patients were fasted for at least 8 h prior to the examination. The examination procedure adhered to the guidelines established by the European Federation of Societies for Ultrasound in Medicine and Biology. 23 A thorough scan of the colon was performed along the longitudinal axis from the ileocecal region to the sigmoid colon. The convex probe was used for a rough screening of all segments, while the linear probe was used to perform all measurements and color Doppler. Images and videos of the longitudinal and transverse sections of all colon segments were recorded.
Archived IUS images and videos were reviewed by one radiologist with more than 5 years of experience in abdominal imaging, who was blinded to all the clinical, biochemical, CS data, and prior IUS reports. The following parameters were evaluated: BWT, measured in longitudinal and transverse sections, from the interface between the mucosa and the lumen to the interface between the serosa and the muscle layer, with a mean of two measurements for each section calculated; BWS, defined as 0 = normal, 1 = uncertain, 2 = focal ⩽3 cm, 3 = extensive >3 cm; bowel wall flow for MUC, defined as absence (0) or presence (1) of blood signals on color Doppler; CDS for IBUS-SAS, defined as 0 = no blood signals, 1 = short signals, 2 = long signals inside bowel, 3 = long signals into the mesentery; inflamed mesentery fat (i-fat), classified if present (2), uncertain (1), or absent (0), as previously described. 19 These parameters were evaluated for each intestinal segment impacted by the disease, and the worst segment was taken into account.
The MUC was calculated according to the following formula:

The IBUS-SAS was calculated according to the following formula:

Definition of endoscopic remission, improvement, and response
Referring to previous studies, endoscopic remission was defined as MES = 0 at reassessment, and endoscopic improvement as MES ⩽1 at reassessment. Endoscopic response was defined as a decrease of MES of at least 1 point between baseline and reassessment.7,9
Statistics
According to previous studies, the mean MUC level of MES = 0 and MES > 0 groups were 5.8 and 7.9 mm. 10 The sample size for this study was determined based on the following assumptions: With the effect size set as 6.9 mm, standard deviation presumed as 6 mm, a two-sided significance level of 0.10, a power of 0.80, this calculation resulted in a minimum of 13 participants in one group required for the study.
Statistical analysis was performed using the SPSS Statistics software (v23). Descriptive statistics were presented as numbers (percent) for categorical variables, mean ± SD for continuous variables corresponding to a normal distribution (CRP and Hgb), and median (interquartile range (IQR)) for continuous variables not corresponding to a normal distribution (including age, disease duration, partial Mayo score, BWT, MUC, and IBUS-SAS).
Correlation was analyzed with a Spearman’s correlation coefficient (negligible: 0.00–0.09, weak: 0.10–0.39, moderate: 0.40–0.69, strong: 0.70–0.89, and very strong: 0.90–1.00).
Differences in clinical and ultrasonographic parameters between remission and non-remission groups were compared using the χ2 test for categorical variables, t test for continuous variables corresponding to a normal distribution, and Mann-Whitney U test for continuous variables not corresponding to a normal distribution. A multivariable binary logistic regression model was constructed for predicting surgery, with all variables having p < 0.1 on univariable analysis included in the multivariable model.
Receiver operating characteristic analysis cutoffs were determined using the Youden index for optimal accuracy. Results of the multivariable analyses are presented as odds ratios (OR) with 95% confidence intervals (CI). Sensitivity and specificity analyses were performed on features that were significant in the multivariable analysis. All reported p values were two-sided, and p < 0.05 was considered statistically significant.
Results
Study population
During the study period, 60 patients initially met our inclusion criteria. Eleven patients were subsequently excluded due to loss to follow-up (n = 5), incomplete CS at reassessment (n = 4), and disease limited to the rectum (n = 2). This resulted in a final enrollment of 49 patients.
The baseline characteristics are presented in Table 1. Of the enrolled patients, 27 were males and 22 were females, with a median age of 42 years (IQR 33–49 years). The median disease duration was 7 years (IQR 2–13 years). According to the Montreal classification, 7 patients (14%) were classified as the left-sided colitis (E2), while 42 patients (86%) were classified as pancolitis (E3). A total of 12 patients (24%) had a history of biologics usage. Regarding treatment choices, 32 (65%) of the patients were treated with vedolizumab, 13 (27%) with infliximab, 1 (2%) with tofacitinib, 2 (4%) with upadacitinib, and 1 (2%) with upadacitinib plus vedolizumab. The median partial Mayo score was 6 at baseline (IQR 3–7). At baseline, 3 (6%) patients had a MES score of 1, 21 (43%) of 2, and 25 (51%) of 3. In regard to IUS scores, the median BWT was 6 (IQR 5–7), the median MUC score was 10.4 (IQR 9.0–11.8), while the median IBUS-SAS score was 50 (IQR 31–76).
Baseline characteristics.

CRP, C-reactive protein; IQR, interquartile range; SD, standard deviation.
The first IUS assessment during follow-up was 5.1 ± 1.2 months, that is, 4–6 months. The reassessment time by CS and IUS was 21 ± 9.2 months, that is, 12–30 months. At reassessment, 13 (27%) patients achieved endoscopic remission (MES = 0), 22 (44%) achieved endoscopic improvement (MES ⩽1), and 27 (55%) achieved endoscopic response (MES decrease ⩾1).
IUS scores during follow-up and their correlation with colonoscopy
A downward trend was observed in BWT, MUC, and IBUS-SAS scores during follow-up. Decreases in values were statistically significant in all three scores between baseline and 12–30 months (mean BWT 6.4 vs 5.5 mm, p < 0.001; mean MUC 10.6 vs 8.1, p < 0.001; mean IBUS-SAS 54.1 vs 35.7, p < 0.001). Also, statistically significant decreases were observed between baseline and at 4–6 months (mean BWT, 6.5 vs 5.4 mm, p < 0.001; mean MUC, 10.6 vs 9.1, p = 0.007; mean IBUS-SAS, 54.1 vs 43.0, p < 0.001). However, no statistically significant changes were observed between 4–6 and 12–30 months (mean BWT, 5.4 vs 5.5 mm, p = 0.78; mean MUC, 9.1 vs 8.1, p = 0.08; mean IBUS-SAS, 43.0 vs 35.7, p = 0.02). Changes in BWT, MUC, and IBUS-SAS values before and after treatment were moderately correlated with changes in MES (BWT, ρ = 0.46, p = 0.005; MUC, ρ = 0.49, p = 0.002; and IBUS-SAS, ρ = 0.45, p = 0.006, respectively; Supplemental Table 1).
The correlations between BWT, MUC, IBUS-SAS, and contemporary MES (including baseline and 12–30 months) are presented in Table 2. BWT, MUC, and IBUS-SAS scores showed a good correlation with MES (BWT, ρ = 0.54, p < 0.001; MUC, ρ = 0.55, p < 0.001; and IBUS-SAS, ρ = 0.69, p < 0.001, respectively). IBUS-SAS showed a better diagnostic performance to assess endoscopic remission than BWT and MUC (area under the curve (AUC) 0.909 for IBUS-SAS, 0.862 for BWT, and 0.881 for MUC), as well as to assess endoscopic improvement (AUC 0.856 for IBUS-SAS, 0.759 for BWT, and 0.755 for MUC). Receiver operating characteristic analysis sets an IBUS-SAS value <25.5 as the best cutoff value to determine endoscopic remission, with a sensitivity of 85.5% and a specificity of 88.9%; and sets an IBUS-SAS value <29.0 as the best cutoff value to determine endoscopic improvement, with a sensitivity of 77.8% and a specificity of 76.5%.
Correlation between contemporary ultrasound scores and MES.
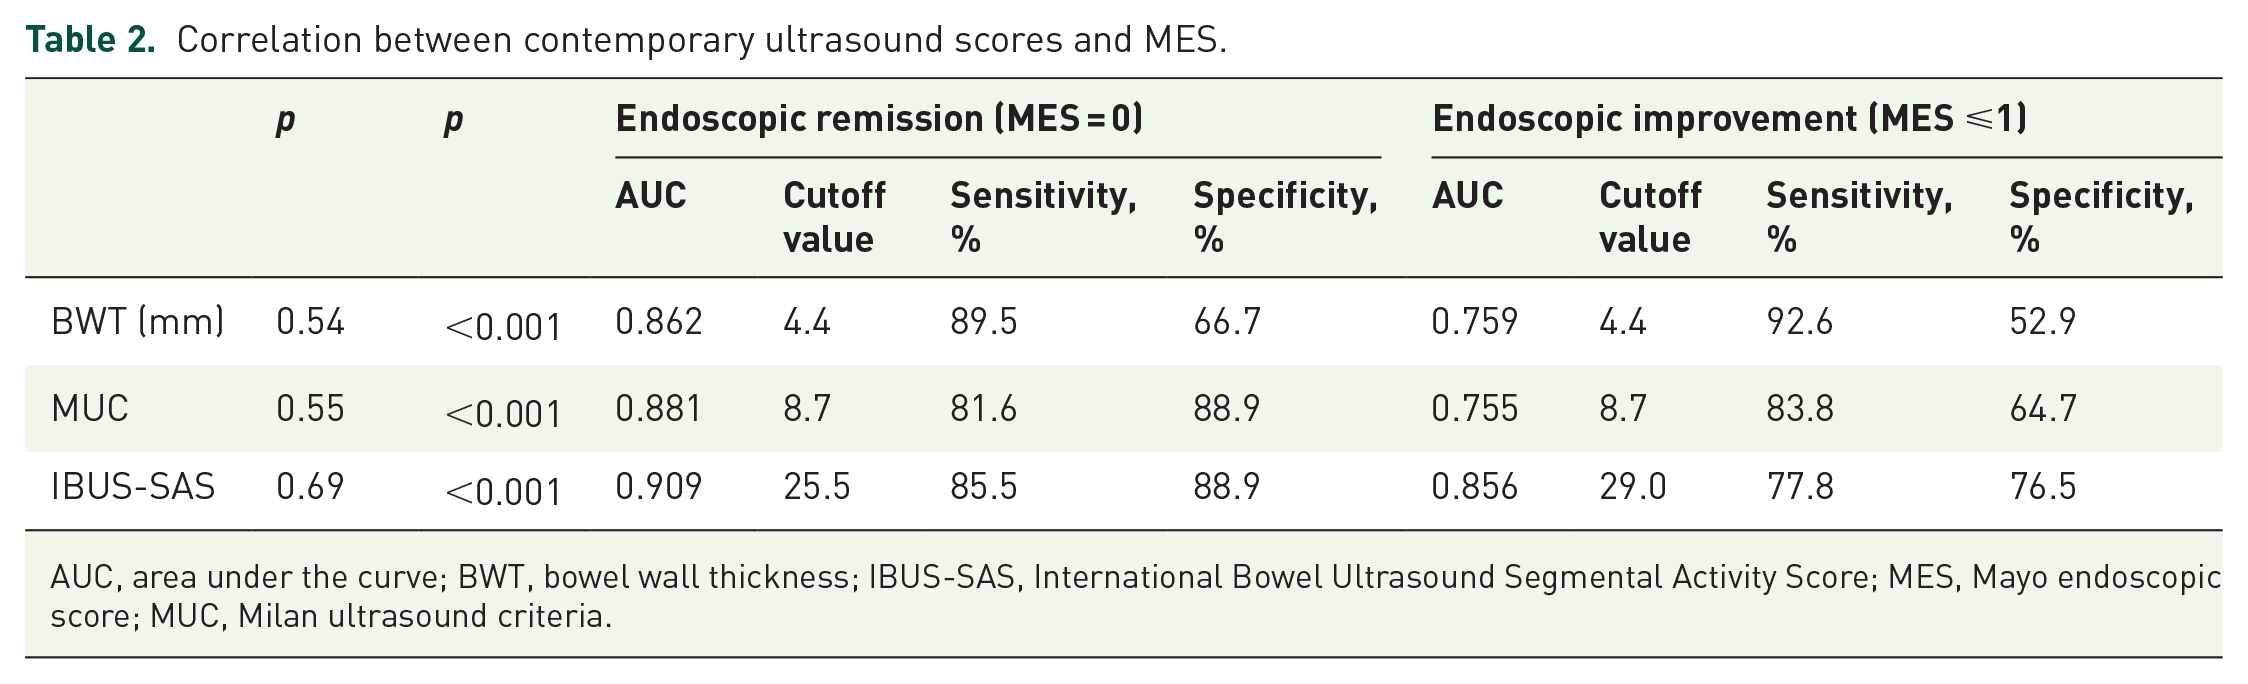
AUC, area under the curve; BWT, bowel wall thickness; IBUS-SAS, International Bowel Ultrasound Segmental Activity Score; MES, Mayo endoscopic score; MUC, Milan ultrasound criteria.
IUS scores at 4–6 months to predict endoscopic remission and improvement
When comparing IUS scores in patients with and without endoscopic remission, there were no differences in baseline IUS scores between the two groups. At 4–6 months, only IBUS-SAS values were significantly lower in patients with endoscopic remission compared to patients without (p = 0.047). At 12–30 months, all BWT, MUC, and IBUS-SAS values were significantly lower in patients with endoscopic remission (Figure 2).

Changes in BWT, MUC, and IBUS-SAS in patients with different treatment outcomes. (a) Changes in BWT, MUC, and IBUS-SAS in patients with and without treatment remission. (b) Changes in BWT, MUC, and IBUS-SAS in patients with and without treatment improvement. Statistically significant differences between the two groups were marked in *.
Similarly, when comparing IUS scores in patients with and without endoscopic improvement, no differences in baseline IUS scores were observed. At 4–6 months, only the IBUS-SAS value was significantly lower in patients with endoscopic improvement compared to patients without (p = 0.016). At 12–30 months, all BWT, MUC, and IBUS-SAS values were significantly lower in patients with endoscopic improvement (Figure 2).
BWT, MUC, and IBUS-SAS scores at 4–6 months were moderately correlated with MES at reassessment (BWT, ρ = 0.50, p < 0.001; MUC, ρ = 0.50, p < 0.001; and IBUS-SAS, ρ = 0.59, p < 0.001, respectively). The AUC values of BWT, MUC, and IBUS-SAS to predict an endoscopic remission were 0.747, 0.762, and 0.767, respectively, while the AUC values of BWT, MUC, and IBUS-SAS at 4–6 months to predict an endoscopic improvement were 0.699, 0.706, and 0.770, respectively (Figure 3 and Supplemental Table 2). Receiver operating characteristic analysis sets an IBUS-SAS value <25.5 as the best cutoff value to predict endoscopic remission, with a sensitivity of 77.8% and a specificity of 69.2%; and sets an IBUS-SAS value <38.0 as the best cutoff value to determine endoscopic improvement, with a sensitivity of 70.4% and a specificity of 77.3% (Supplemental Table 2).

ROC curves to predict MES = 0 (a) and MES ⩽1 (b) with different IUS scores.
We chose IBUS-SAS at 4–6 months along with other demographic, clinical, and biochemical parameters in logistic multivariable analysis to predict endoscopic remission and improvement. IBUS-SAS <25.5 was the only predictor to predict endoscopic remission (OR 7.6, 95% CI 1.8–31.3). The sensitivity, specificity, positive predictive value (PPV), and negative predictive value (NPV) for detecting endoscopic remission were 77.8% (95% CI 60.4%–89.3%), 69.2% (95% CI 38.9%–89.6%), 87.5% (95% CI 70.1%–95.9%), and 52.3% (95% CI 28.5%–76.1%), respectively. Also, IBUS-SAS <38.0 at 4–6 months was the only predictor of endoscopic improvement (OR 5.8, 95% CI 1.7–20.2). The sensitivity, specificity, PPV, and NPV for detecting endoscopic remission were 70.4% (95% CI 49.7%–85.5%), 77.3% (95% CI 54.1%–91.3%), 79.2% (95% CI 57.3%–92.1%), and 68.0% (95% CI 46.4%–84.3%), respectively (Table 3).
Univariate and multivariate logistic regression analyses to predict endoscopic remission and improvement.

CI, confidence interval; CRP, C-reactive protein; IBUS-SAS, International Bowel Ultrasound Segmental Activity Score; OR, odds ratio.
Changes in IUS scores to predict endoscopic response
Changes in BWT, MUC, and IBUS-SAS scores between baseline and 12–30 months were more pronounced in patients with endoscopic response (MES decrease ⩾1) than without (BWT, p = 0.013; MUC, p = 0.013; and IBUS-SAS, p = 0.042, respectively; Figure 4). However, there were no significant differences in changes between baseline and 4–6 months in endoscopic response and no response groups (BWT, p = 0.846; MUC, p = 0.863; and IBUS-SAS, p = 0.960, respectively).

Changes in BWT (a), MUC (b), and IBUS-SAS (c) in patients with and without endoscopic response.
Discussion
As IUS has been established as a reliable and accessible tool to monitor disease activity in UC, there is no consensus on which IUS scoring system demonstrates the best diagnostic performance. This study conducted a head-to-head comparison of BWT, the MUC score, and the IBUS-SAS score. Our findings indicate that the IBUS-SAS score exhibits the strongest correlation with the contemporary MES score, as well as provides the highest accuracy in predicting endoscopic remission and improvement.
Common IUS parameters include BWT, BWS, color Doppler pattern, inflammatory fat, and mesenteric lymph nodes. Various IUS scoring systems are essentially combinations of one or more of these parameters with different weights. BWT is widely recognized as the most important parameter with a good inter-observer and intra-observer consistency. 24 It has been shown to accurately assess disease activity and monitor therapeutic response with reference to CS. 12 BWT alone can also determine endoscopic response and remission in moderate to severe UC, with an AUC of 0.87 for endoscopic remission and 0.92 for endoscopic improvement. 7 However, other IUS parameters have also been reported to significantly reflect disease activity.8,13,14 The MUC score, which incorporated BWT with CDSs, has been reported mostly and externally validated in several studies, demonstrating an AUC ranging from 0.850 to 0.902 for determining disease activity.13,18 Conversely, the IBUS-SAS score, which we initially developed for CD, combines BWT, color Doppler, inflammatory fat, and BWS. It has shown superior performance compared to other IUS scores in CD and has recently been applied in UC, demonstrating comparable accuracy to the MUC score (both AUCs = 0.85).20,21 Given the significant differences in examination time required to collect and calculate one (BWT), two (MUC), or four (IBUS-SAS) IUS parameters, a head-to-head comparison of these scores is of great clinical relevance and has not been previously reported.
In this study, BWT, MUC, and IBUS-SAS all demonstrated strong diagnostic performance in determining endoscopic activity. While there is ongoing debate regarding the optimal BWT cutoff value (3 vs 4 mm), our findings suggest a cutoff of 4.4 mm for both MES ⩽1 and MES = 0. Similarly, for the MUC score, a cutoff of 8.7 was identified for both MES ⩽1 and MES = 0, higher than the previous reported value of 6.2. 18 For IBUS-SAS, the cutoff values were 29.0 and 25.5 for MES ⩽1 and MES = 0, respectively, also higher than previously reported. 21 These differences may be attributed to the increased sensitivity of color Doppler and inflammatory fat detection in the newer-generation ultrasound machines. Notably, only the IBUS-SAS score could discriminate between MES = 0 and MES = 1, which is significant as MES = 0 has better long-term outcomes than MES = 1. 25
The predictive value of IUS scores for long-term endoscopic outcomes was also analyzed. Previously, de Voogd et al. 9 have reported that early changes in BWT after 6 weeks of treatment can predict endoscopic response in the sigmoid colon (AUC = 0.82) but not in the descending colon. Similarly, Allocca et al. 10 have shown a MUC score <6.2 after 12 weeks of treatment can predict endoscopic remission at reassessment (AUC = 0.876). The predictive value of the IBUS-SAS score, however, has not been investigated. In our study, the AUCs for BWT, MUC, and IBUS-SAS at 4–6 months were 0.699, 0.706, and 0.770 for predicting endoscopic remission, and 0.747, 0.762, and 0.767 for predicting endoscopic improvement, respectively. Only the IBUS-SAS score showed a statistically significant difference between the remission and non-remission group at 4–6 months. The longer follow-up period in our study (on average, 21 vs 9.4 months and 18 weeks in previous studies) may explain the lower performance of BWT and MUC.
Changes in IUS scores during follow-up were also assessed relative to changes in MES (i.e., endoscopic response). As expected, statistically significant differences were observed in the changes of all three IUS scores between patients with and without endoscopic response, consistent with previous studies.7,10 However, no correlation was found between changes in IUS scores between baseline and 4–6 months and endoscopic response, a finding also reported by de Voogd et al. 9 This may be explained by the different kinetics of drugs, as infliximab and tofacitinib may exert their effect more rapidly than vedolizumab, making early changes less reflective of the overall changes. 9
Notably, significant changes were observed in IBUS-SAS between 4–6 and 12–30 months, but not in BWT or MUC. This discrepancy may be attributed to the relatively late timing of our first IUS reassessment, given that BWT changes have been reported as early as 2 weeks post-treatment initiation. 9 Earlier IUS evaluations would likely better capture these dynamic morphological changes.
While IBUS-SAS demonstrated the highest accuracy, several practical considerations must be addressed. Among IUS parameters, BWT and color Doppler are the most reproducible due to their quantifiable nature. By contrast, the subjective judgment of stratification and fatty wrapping reduces reproducibility. 26 Qin et al. 27 have reported that IBUS-SAS had only moderate inter-observer agreement for monitoring CD. In addition, the extra time required to calculate the IBUS-SAS score compared to other simpler scores must be considered, although this was not evaluated in this study due to the retrospective design.
Our study has several strengths, including a relatively low lost-to-follow-up rate, minimizing follow-up bias, and a long follow-up period, which enhances the clinical significance of our findings. In addition, the inclusion of UC patients with mild to severe disease activity at baseline improves the generalizability of our results.
Our study also has several limitations. Its retrospective design may introduce potential bias, particularly as radiologists performing IUS were not blinded to prior CS results. The inter-observer and intra-observer agreement was not assessed, although these issues have been addressed in prior research. As a retrospective study, we were unable to evaluate the prognostic value of very early-phase IUS (2–12 weeks) as reported in previous reports.9,10 Furthermore, the single-center, small sample size may introduce selection bias, necessitating validation through larger, multicenter studies.
Conclusion
Our data suggest that the IBUS-SAS score outperforms BWT and MUC in both assessing disease activity and predicting long-term endoscopic outcomes in UC. Further studies are needed to validate these findings and evaluate the additional time and resource requirements associated with this scoring system.
Supplemental Material
sj-docx-2-tag-10.1177_17562848251375374 – Supplemental material for The value of intestinal ultrasound scores in predicting long-term endoscopic outcomes in ulcerative colitis
Supplemental material, sj-docx-2-tag-10.1177_17562848251375374 for The value of intestinal ultrasound scores in predicting long-term endoscopic outcomes in ulcerative colitis by Li Ma, Zhaojue Wang, Xiaoyan Zhang, Mengsu Xiao, Jing Qin, Mengyuan Zhou, Hong Yang, Qingli Zhu and Wenbo Li in Therapeutic Advances in Gastroenterology
Supplemental Material
sj-pdf-1-tag-10.1177_17562848251375374 – Supplemental material for The value of intestinal ultrasound scores in predicting long-term endoscopic outcomes in ulcerative colitis
Supplemental material, sj-pdf-1-tag-10.1177_17562848251375374 for The value of intestinal ultrasound scores in predicting long-term endoscopic outcomes in ulcerative colitis by Li Ma, Zhaojue Wang, Xiaoyan Zhang, Mengsu Xiao, Jing Qin, Mengyuan Zhou, Hong Yang, Qingli Zhu and Wenbo Li in Therapeutic Advances in Gastroenterology
Footnotes
References
Supplementary Material
Please find the following supplemental material available below.
For Open Access articles published under a Creative Commons License, all supplemental material carries the same license as the article it is associated with.
For non-Open Access articles published, all supplemental material carries a non-exclusive license, and permission requests for re-use of supplemental material or any part of supplemental material shall be sent directly to the copyright owner as specified in the copyright notice associated with the article.