
Abstract
Background:
Although transcatheter arterial chemoembolization (TACE) is one of the first-line treatments for unresectable HCC (uHCC) patients, its overall efficacy varies significantly. Therefore, the identification of reliable biomarkers capable of effectively distinguishing TACE-responsive populations is clinically critical.
Objectives:
Our research aims to investigate T-lymphocyte subpopulations and associated pathways in peripheral blood that contribute to TACE refractoriness, as well as to develop effective methods for predicting TACE efficacy.
Design:
This is an observational study.
Methods:
A total of 50 patients who underwent standard TACE-based therapy between January 2020 and December 2022 were included in this study. TACE response was evaluated within 1–3 months following two consecutive TACE sessions. Patients with TACE failure were assigned to the Non-Response group, whereas the remaining were categorized into the Response group. Blood samples were collected prior to treatment and subsequently analyzed using flow cytometry and RNA sequencing. Predictors were analyzed using univariate and multivariate analyses within the bivariate logistic regression models. Pathway enrichment analysis was performed using gene set enrichment analysis (GSEA).
Results:
A total of 24 of 50 (48%) exhibited TACE failure (Non-Response). Baseline peripheral T-lymphocyte analysis revealed that the Non-Response group had a higher abundance of senescent phenotype (TSenescence, CD27−CD28−) in both CD4/CD8+ T cells (p < 0.0001), but a lower proportion of memory stem cell (TSCM) subpopulation (CD4+ TSCM: p = 0.0411; CD8+ TSCM: p < 0.0001). Furthermore, in CD8+ T cells, they exhibited higher expression of exhaustion marks (PD-1: p = 0.0005; LAG-3: p = 0.0026; TIGIT: p = 0.0014) and significantly lower production of effector molecules (TNF-α: p < 0.0001; IFN-γ: p = 0.0018; GZMB: p < 0.0001). Transcriptomics revealed that the Response group was enriched in pathways associated with energy and drug metabolism. Univariate and multivariate analyses demonstrated that the baseline CD8+ TSCM and CD8+ TSenescence subpopulations were significant predictive factors for TACE efficacy.
Conclusion:
Our study demonstrated significant differences in the immune characteristics of peripheral T lymphocytes between the Non-Response and Response groups. The CD8+ TSCM and CD8+ TSenescence subsets are potential predictors of TACE efficacy and long-term survival. These insights into peripheral blood T lymphocytes offer valuable evidence to help clinicians more effectively identify potential TACE-responsive populations, predict survival, and develop personalized treatment regimens for patients with uHCC.

Introduction
Hepatocellular carcinoma constitutes 75%–85% of all primary liver cancers and ranks as the sixth most prevalent malignancy worldwide. 1 Patients are often diagnosed at intermediate to advanced stages, with less than 20% eligible for curative interventions, such as surgical resection or liver transplantation. 2 Transcatheter arterial chemoembolization (TACE) is an established first-line treatment for patients classified as Barcelona clinic liver cancer (BCLC) stage B or C. 3
TACE does not yield satisfactory outcomes for all patients owing to significant heterogeneity, and the patient’s physical condition can influence treatment response. Research indicates that patients in poor physical condition are at a higher risk of TACE failure 4 and exhibit significantly lower overall survival (OS). 5 In clinical practice, the efficacy of TACE often diminishes with repeated procedures. Based on this observation, The Japan Society of Hepatology (JSH) established the definition of TACE failure/refractoriness in 2010, characterized by the lack of effective response or progressive disease following two or more consecutive TACE treatments. 6 Repeated ineffective TACE treatments can result in adverse effects, compromise the quality of life, and decrease the likelihood of receiving alternative therapies. 7 Therefore, it is crucial to identify reliable biomarkers that are capable of predicting which patients are most likely to benefit from TACE before initiating treatment.
T lymphocytes are essential components of the adaptive immune system and play a pivotal role in the onset, progression, and therapeutic responses of HCC. 8 Their functional status directly influences tumor immune surveillance and evasion. Among these, cytotoxic CD8+ T cells mediate their antitumor effects primarily through the release of cytotoxic factors. 9 It is widely recognized that dysfunctional T cells expressing exhaustion markers such as programmed cell death protein 1 (PD-1) are closely associated with poor therapeutic outcomes in HCC. 10 Conversely, cells exhibiting stem characteristics, typically identified as CD45RA+CCR7+CD27+CD28+ are regarded as markers of favorable prognosis. 11 TACE has been shown to modulate the tumor immune microenvironment (TME). Extensive research has been conducted to systematically elucidate the tumor-infiltrating lymphocyte (TIL) immune landscape in HCC patients using single-cell sequencing. 12 In fact, the organism must initially recruit T cells from the peripheral blood pool to enable their infiltration into the tumor. 13 Therefore, investigating the peripheral immunological characteristics of cancer patients is crucial. Previous studies have demonstrated that pre-treatment subsets of peripheral blood immune cells are associated with responses to neoadjuvant chemotherapy (NAC) in breast cancer. 14 Studies on intrahepatic cholangiocarcinoma (ICC) have shown that patients with elevated pre-treatment levels of CD4+ CD45RO+ CXCR3+ T cells exhibit improved responses to systemic chemotherapy. 15 These findings provide a solid foundation for predicting TACE treatment response based on peripheral T lymphocyte subsets. In the context of unresectable HCC (uHCC), researchers have developed inflammation-based scores (IBS) to predict TACE failure; however, these factors have limited generalizability. 16 Peripheral blood exhibits a complex composition, and the distribution and functional characteristics of its subpopulations offer a more accurate representation. Therefore, it is essential to investigate the relationship between lymphocyte profiles in the peripheral blood of cancer patients and their response to antitumor therapies. Peripheral blood sampling offers several advantages, including ease of accessibility, minimally invasive collection, real-time dynamic monitoring, and resilience to tumor heterogeneity. Therefore, developing biomarkers based on their characteristics to predict treatment outcomes is of significant importance.
In this study, pre-treatment peripheral blood samples were collected from 50 uHCC patients who received TACE-based therapy. The patients were stratified into Non-Response and Response groups according to their treatment outcomes. We comprehensively analyzed the immune characteristics, including T-lymphocyte subsets and their functional attributes, and investigated potential molecular mechanisms using RNA sequencing. This study focused on the correlation and predictive value of biomarkers associated with treatment response, particularly CD8+ TSCM and CD8+ TSenescence subgroups, which exhibited strong predictive potential for TACE efficacy. In conclusion, our study aimed to stratify cohorts based on T-lymphocyte-related biological data and to generate findings that could guide clinical therapeutic decision-making.
Methods
Study population
A total of 102 patients diagnosed with uHCC were analyzed, all of whom received treatment at the Department of Interventional Radiology at Third Xiangya Hospital of Central South University between January 2020 and December 2022. The inclusion criteria were as follows: (1) age between 18 and 80 years; (2) BCLC stage B or C; (3) ECOG score of 0–2; and (4) Child-Pugh classification A or B. The exclusion criteria were as follows: (1) metastatic carcinoma; (2) extrahepatic metastasis; and (3) bone marrow suppression: Platelet count < 60 × 109/L, hemoglobin < 90 g/L; (4) unassessable target lesions and (5) portal vein tumor thrombosis VP3 or 4. Based on these criteria, 50 patients met the inclusion standards (Figure 1). Finally, peripheral blood T lymphocytes from six patients were subjected to single-cell transcriptomic sequencing to analyze gene expression patterns. The reporting of this study adheres to the Strengthening the Reporting of Observational Studies in Epidemiology (STROBE) statement. 17

Study workflow.
Study design and treatment
Based on tumor characteristics and staging, TACE is recommended as the primary local treatment, potentially in combination with systemic therapies such as tyrosine kinase inhibitor (TKI). The protocol for the TACE program adheres to the operation plan detailed in the following sections. The TKIs used in this study included first-line drugs such as sorafenib and lenvatinib, as well as second-line agents such as regorafenib and apatinib. All treatment plans in this study were conducted in accordance with the 2020 guidelines of the Chinese Society of Clinical Oncology (CSCO) for HCC. Some patients received conservative treatment, or, in some cases, delayed TKI initiation due to poor compliance and financial considerations.
TACE procedure
The TACE procedures were performed by two out of three experienced interventional radiologists. Hepatic angiography was performed by super-selectively inserting either a 5-F catheter (Terumo, Japan) or a 2.8-F microcatheter (Merit Maestro, Medical Systems, USA) into the tumor-feeding artery. A mixture of 5–20 mL of iodized oil (Lipiodol, Guerbet, Aulnay-Sous-Bois, France) and 20–80 mg of epirubicin (Pharmorubicin, Pfizer, New York, NY) combined with 1000 mg of fluorouracil (Tianjin Jin Yao Pharmaceutical Co) was injected into the feeding artery. Subsequently, 350–560 mm absorbable gelatin sponge particles (Gelatin Sponge, Hangzhou Pharmaceutical, Hangzhou, China) were administered into the tumor-feeding artery. Post-embolization angiography of the feeding artery was performed to evaluate the extent of vascular occlusion. In cases of reflux, the administration of iodized oil or gelatin sponge particles was halted.
Assessment of TACE response
Tumor response was evaluated using the modified Response Evaluation Criteria in Solid Tumors (mRECIST) 1–3 months after two consecutive TACE sessions. TACE failure encompasses the following criteria: intrahepatic lesion progression (residual lesion > 50% or an increase in tumor number compared to pre-TACE), sustained elevation of tumor markers; progression of vascular invasion; or extrahepatic spread following two consecutive iodized oil TACE sessions. All participants underwent abdominal computed tomography (CT) or magnetic resonance imaging (MRI) scans before the initial TACE procedure. Follow-up continued until December 31, 2023, or until loss of contact or death. Patients with TACE failure were assigned to the Non-Response group, while the others were categorized into the Response group.
Demographic data
Baseline patient demographics, including age, gender, and tumor characteristics (e.g., size, number, and vascular invasion), were recorded 1 day before TACE. Laboratory parameters were evaluated at baseline and after the first and second TACE cycles. The ALBI score was calculated using the formula: (log10 bilirubin in μmol/L × 0.66) + (albumin in g/L × −0.085), where bilirubin was measured in μmol/L and albumin in g/L. The classification for ALBI grades was defined as follows: xb ⩽ −2.60 (ALBI grade 1), −2.60 < xb ⩽ −1.39 (ALBI grade 2), and xb > −1.39 (ALBI grade 3).
Procurement of blood samples and isolation of peripheral blood mononuclear cells
PBMCs were isolated from peripheral blood samples using Ficoll-Paque Plus (GE Healthcare) and were cryopreserved for subsequent use.
Flow cytometric analysis of peripheral blood T lymphocytes
For surface staining, single-cell suspensions of T lymphocytes were directly stained with surface-specific antibodies.
For intracellular staining, fixed and permeabilized T cells were stained using a fixation/permeabilization kit following the manufacturer’s instructions.
For the detection of intracellular cytokines and granzyme B (GZMB), T lymphocytes were first stimulated with phorbol 12-myristate 13-acetate (PMA)/ionomycin at 37°C for 6 h, followed by fixation, permeabilization, and intracellular staining.
Samples were acquired using a BD LSR Fortessa flow cytometer, and the data were analyzed using FlowJo software. The primary antibodies used in this study are detailed in Table S4. The gating strategy was implemented as follows: first, gates were set based on forward scatter (FSC) and side scatter (SSC) to exclude debris. Next, a gate was set using FSC-A versus FSC-H to remove cellular aggregates. Fluorescence gates were set according to the experimental objectives; for example, a CD3 gate was used to identify total T cells, which were then further subdivided into helper T cells and cytotoxic T cells using CD4 and CD8 gates, respectively, as shown in Figure S2. The names and corresponding markers of lymphocyte subsets are provided in Supplemental Table 1.
Cytotoxicity assay
T cells were co-cultured with HepG2 target cells (5 × 10⁵) at varying effector-to-target (E: T) ratios (ranging from 2.5:1 to 10:1) for 6 h. Cells were then collected, stained with CD45 and propidium iodide (PI), and analyzed using flow cytometry.
Seahorse assay for metabolic function
The extracellular acidification rate (ECAR) was measured using the Seahorse XF Cell Glycolysis Stress Test Kit (Agilent) following the manufacturer’s instructions. Briefly, 2 × 10⁵ PBMC-derived T cells were suspended in XF medium and seeded onto XF96 plates pre-coated with poly-L-lysine (20 μg/mL). The XF96 extracellular flux analyzer was used to measure the ECAR under baseline conditions and in response to glucose (10 mM), oligomycin (1.0 μM), and 2-D-glucose (2-DG, 50 mM). Real-time monitoring of proton concentration fluctuations in the culture medium (ECAR) was performed using a Seahorse XF Pro Analyzer (Agilent) to assess cellular glycolytic activity, with data normalized to cell number. Data were analyzed and normalized using Wave software (version 2.6.3, Agilent).
RNA-sequencing and analysis
Total RNA was isolated from T cells using the TRIzol reagent. RNA integrity was assessed using an Agilent 2100 Bioanalyzer. The resultant mRNA underwent random fragmentation in the NEB Fragmentation Buffer using divalent cations. The sequencing library was constructed following this process, in accordance with either standard or strand-specific NEB protocols. Following library validation, the libraries were pooled based on effective concentration and target sequencing data requirements, and subsequently sequenced on an Illumina NovaSeq 6000 platform. The image data generated by the high-throughput sequencer were converted into sequence data (reads) using CASAVA for base calling. The raw data (raw reads) in FASTQ format were preprocessed with FASTQ software. During this step, clean data (clean reads) were generated by removing adapter-containing reads, reads with N bases, and low-quality reads from the raw data. In addition, Q20, Q30, and GC content were calculated for the clean data. All subsequent analyses were performed using this high-quality clean data.
The reference genome and gene model annotation files were downloaded directly from the genome database. The index of the reference genome was built using HISAT2 (v2.0.5), and paired-end clean reads were aligned to the reference genome using the same tool. Read counts mapped to each gene were quantified using FeatureCounts (version 1.5.0-p3). Subsequently, the Fragments Per Kilobase of transcript per Million mapped reads (FPKM) for each gene were calculated based on gene length and mapped read counts.
Differential gene expression between the cohorts was analyzed using the edgeR package, with thresholds of padj < 0.05 and |log2 (foldchange)| > 1. Gene ontology (GO) enrichment analysis and Kyoto Encyclopedia of Genes and Genomes (KEGG) pathway enrichment analysis of differentially expressed genes were conducted using ClusterProfiler (version 3.8.1) package. Gene set enrichment analysis (GSEA) of GO datasets was conducted using the GSEA software (http://www.broadinstitute.org/gsea/index.jsp).
Protein–protein interaction (PPI) network analysis of differentially expressed genes was performed using known and predicted interactions obtained from the STRING database. Networks were constructed by extracting target gene lists from the database and visualized using Cytoscape software, the differentially expressed genes reported in our results were identified by screening a collection of Betweenness and Degree values (Betweenness > 1777.72873, Degree > 19.0702836).
Statistical evaluation
The Shapiro–Wilk test was applied to continuous variables to evaluate their distribution normality. Non-normally distributed continuous variables were presented as the median and interquartile range (IQR). Comparisons between the Non-Response and Response groups were performed using the Mann–Whitney U test, while changes within each group were assessed using the paired Wilcoxon signed-rank test. In addition, normally distributed continuous variables were expressed as mean ± standard deviation (SD), and differences were analyzed using Student’s t-test. Categorical variables were summarized as counts and percentages and analyzed using the chi-square test or Fisher’s exact test. Stepwise selection was employed to identify the most significant lymphocyte subpopulations associated with benefit using multiple logistic regression analysis. The predictive performance of lymphocyte subsets was assessed using receiver operating characteristic (ROC) curve analysis. The cutoff point was determined using the maximum Youden’s index. Kaplan–Meier survival curves were generated, and the log-rank test was used to compare progression-free survival (PFS) and OS between groups. Statistical analyses were performed using GraphPad Prism software (version 10.0, GraphPad Software, San Diego, CA, USA). A two-tailed p-value < 0.05 was considered statistically significant.
Results
Response of treatment and patient baseline characteristics between Non-Response and Response group
The characteristics of patients in the Non-Response (n = 24) and Response (n = 26) groups are summarized in Table 1. No significant differences were observed in most baseline characteristics. The median ages in the two groups were 54 and 52 years (p = 0.475), respectively, and most patients were male (91.7% versus 84.6%, p = 0.669). There were no significant differences in tumor burden (maximal tumor size: p = 0.257; number of tumors: p = 0.156), and all patients had good hepatic function and performance status. In addition, a higher proportion of patients in the Non-Response group had AFP levels ⩾ 400 ng/mL, although the difference was not statistically significant (45.8% versus 34.6%, p = 0.566). Leukocyte counts were similar between the groups (4.95 versus 5.25, p = 0.541), as were neutrophil counts (3.08 versus 2.70, p = 0.6), monocyte counts (0.41 versus 0.40, p = 0.467), and lymphocyte counts (percentage: 22.5% versus 24.8%, p = 0.859; absolute count: 1.29 versus 1.25, p = 0.600). Finally, we evaluated the IBS and found that the NLR (2.70 versus 2.14, p = 0.795) and the LMR (2.83 versus 3.05, p = 0.704) before treatment could not predict TACE response. Only the PLR (125.7 versus 76.3, p = 0.035) showed limited predictive value. Laboratory test results for both groups before and after two treatment cycles are provided in Figure S1. Supplemental Tables 2 and 3 detail the laboratory for both groups on the baseline.
Clinical characteristics of two groups.

AFP, α-fetoprotein; ALB, albumin; ALBI, albumin–bilirubin; ALT, alanine aminotransferase; AST, aspartate transaminase; DB, direct bilirubin; HB, hemoglobin; IQR, interquartile range; LMR, lymphocyte-to-monocyte ratio; NLR, neutrophil-to-lymphocyte ratio; PLR, platelet-to-lymphocyte ratio; PLT, platelet; TB, total bilirubin; WBC, white blood cell.
T lymphocytes in the Non-Response group showed more senescent phenotypes with exhausted status
Since the baseline lymphocyte counts showed no significant differences (Table 1), we performed a comprehensive flow cytometric analysis of peripheral T-lymphocyte subsets. Figure 2(a) illustrates the four major T-lymphocyte subpopulations defined by CCR7 and CD45RA expression. The results revealed no significant differences between the two groups in the CD4+ T-cell subset. However, within CD8+ T-cell subset, the Non-Response group showed a higher proportion of effector memory T cells (TEM) and a lower proportion of Naïve T cells (TN), terminally differentiated T cells (TEMRA), and central memory T cells (TCM). This finding is consistent with previous studies; suggesting that relying on traditional T-cell subsets to identify potential responders appears to be challenging. A more detailed and in-depth analysis is therefore required.
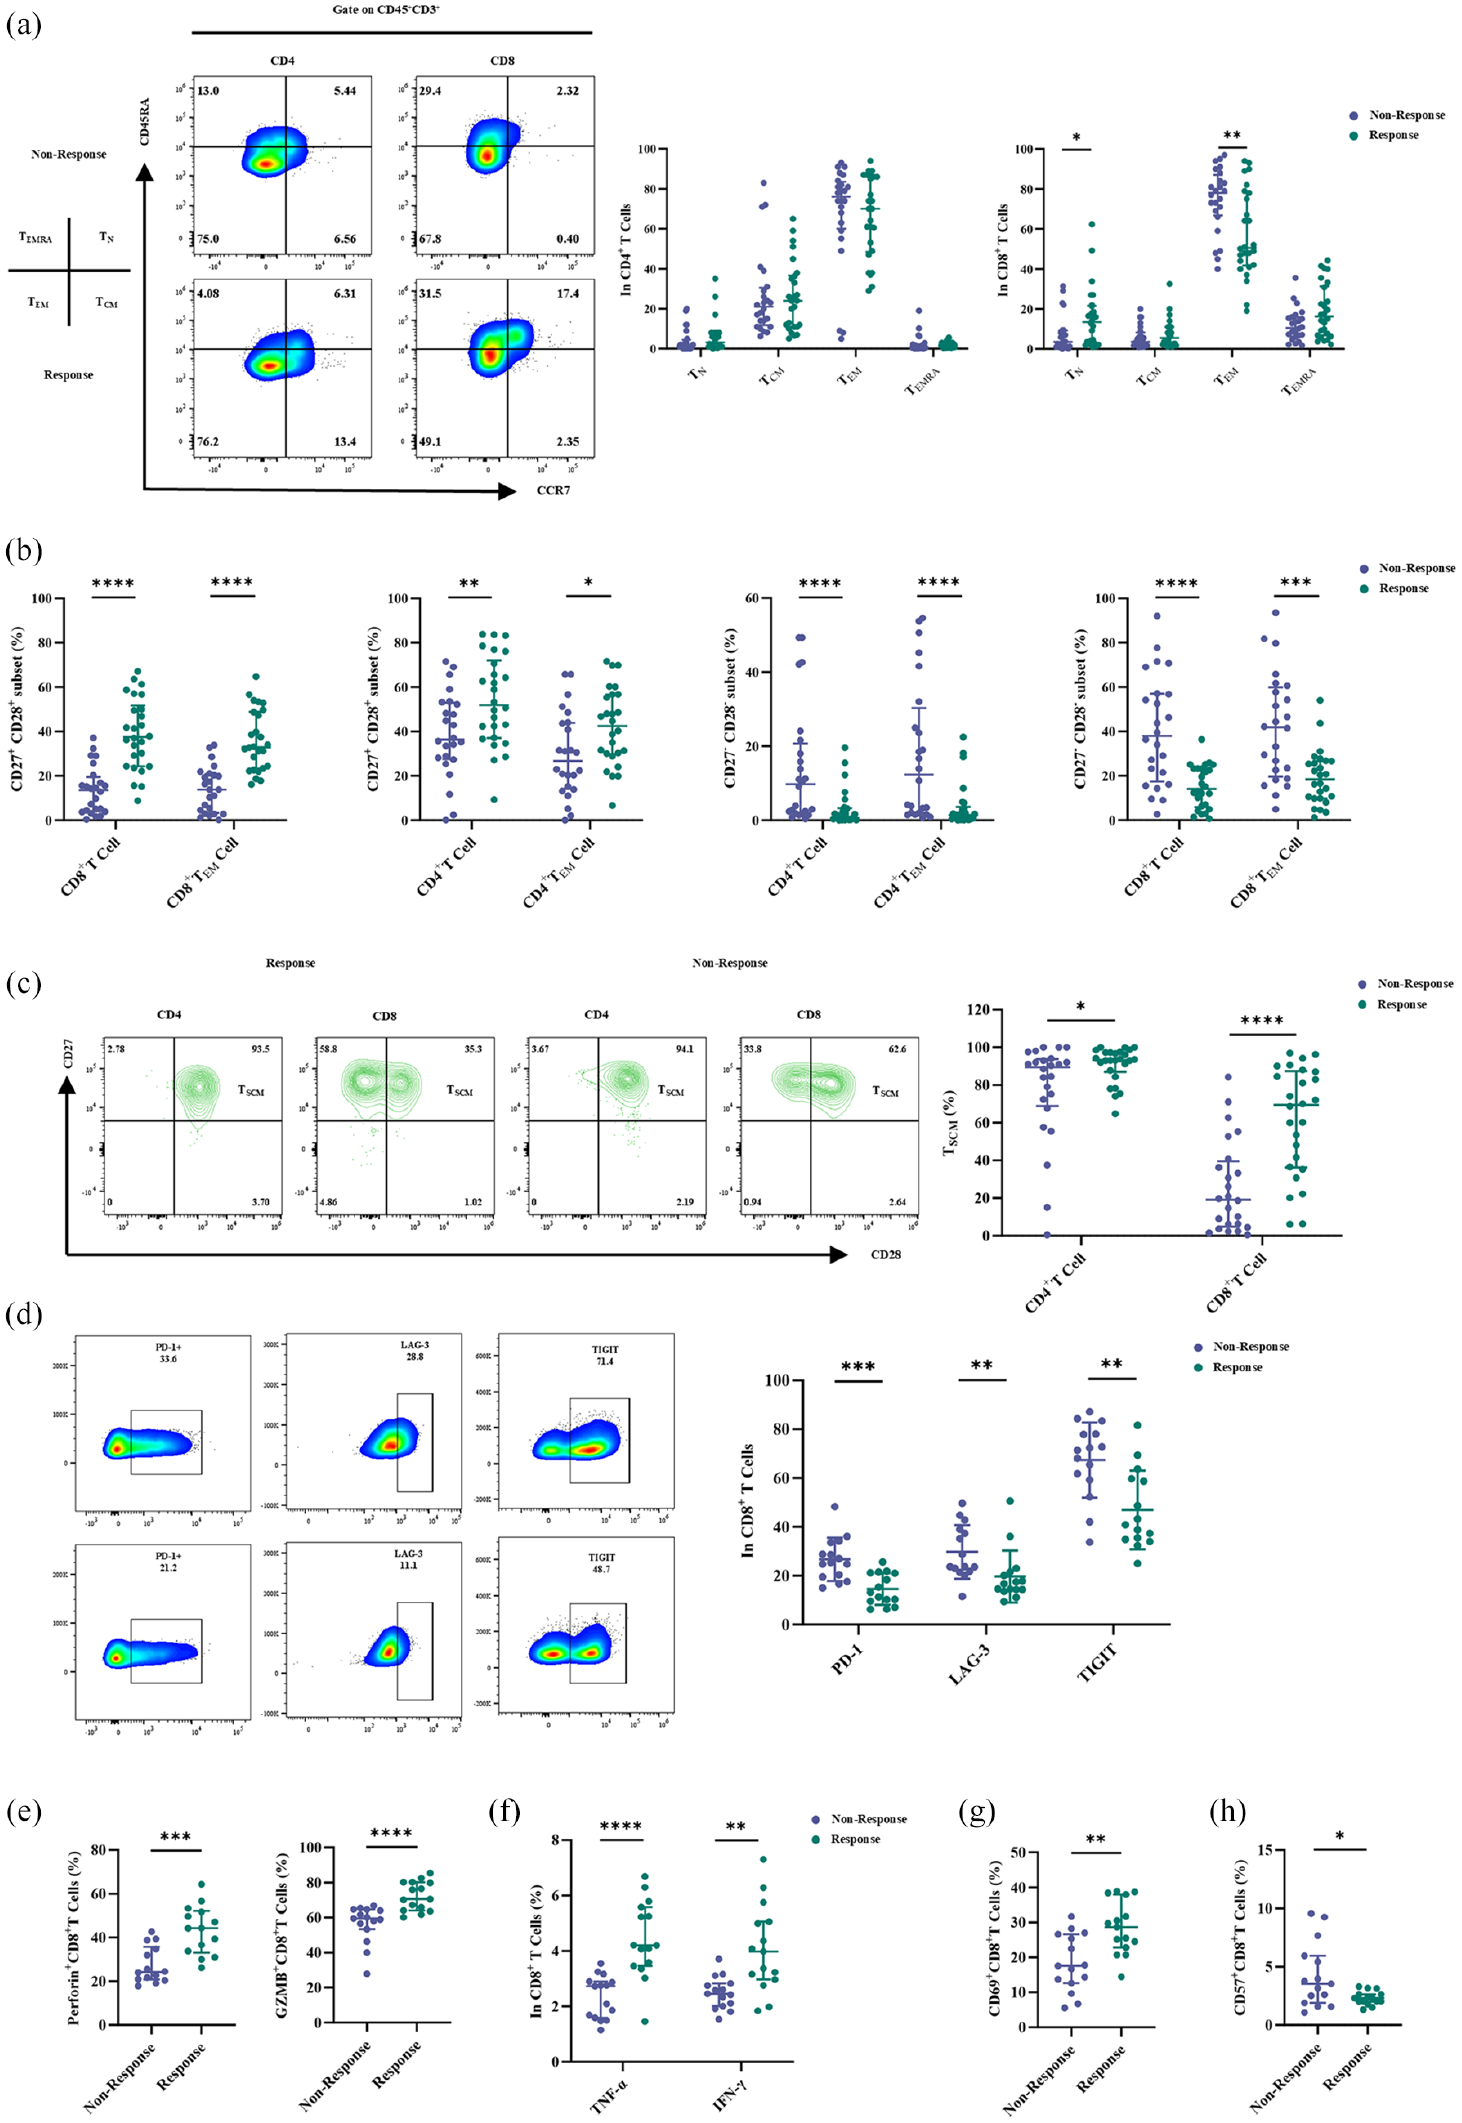
T lymphocytes in the Non-Response Group showed more senescent phenotypes with exhausted status. Peripheral T lymphocytes in the Non-Response group exhibit a senescence rather than an exhaustion state. (a) Left, the dot plots show the gating strategy and the proportion of CD4+ and CD8+ T-cell subsets in a representative sample from the Non-Response group and Response groups; right, four major subgroups in CD4+ and CD8+ T cells are shown. (b) Percentages of senescence and normal T cells are derived from CD4+ T/CD4+ TEM cells and CD8+ T/CD8+ TEM cells. (c) The dot plots show the gating strategy and the proportion of TSCM derived from CD4+/CD8+ T cells. Right, Percentages of TSCM cells derived from CD4+/CD8+ T cells. (d). The dot plots show the gating strategy and the proportion of PD-1, LAG-3, and TIGIT on CTLs. Right, Percentages of them on CTLs (n = 15). (e) Percentages of perforin and GZMB generated from CTLs (n = 15). (f) Percentages of TNF-α and IFN-γ generated from CTLs (n = 15). (g) Representative histogram for CD69 expression on CTLs (n = 15). (h) Representative histogram for CD57 expression on CTLs (n = 15).
Subsequently, we compared CD27−CD28− (TSenescence) and CD27+CD28+ (normal phenotype) T cells. In both CD4+/CD8+ T subsets, as well as in the corresponding TEM subset, the Non-Response group showed a significant reduction in normal phenotype T cells, particularly in the TSCM subset (Figure 2(b)). This trend was particularly evident in the CD8+ T-cell compartment (Figure 2(c)). In addition, the Non-Response group had a higher proportion of senescent T cells (Figure 2(b)). In conclusion, the Non-Response group demonstrated greater deficiencies in CD27 and CD28 expression, indicating a state of immunosenescence in their peripheral immunity.
CD8+ T lymphocytes, also known as cytotoxic T lymphocytes (CTLs), exert their immune function by producing various cytokines and serving as a critical component for antitumor immunity. We first assessed the differential expression of exhaustion marks (PD-1, LAG-3, TIGIT) on CTLs, and the Non-Response group showed significantly higher levels of these markers (Figure 2(d)). By contrast, CTLs from this group exhibited reduced expression of cytotoxic cytokines, including GZMB, perforin, TNF-α, and IFN-γ (Figure 2(e) and (f)). Finally, CD69 expression was reduced in the Non-Response group, indicating diminished T-cell activation (Figure 2(g)). However, the replicative aging marker CD57 was highly expressed (Figure 2(h)), suggesting a state of cellular senescence.
Overall, CTLs from the Non-Response group exhibited functional exhaustion, at both cellular and molecular levels.
T lymphocytes in the Non-Response group showed impaired function
Given the observed phenotypic differences, we next assessed the functional variability of these T cells. First, we evaluated Ki67 expression (Figure 3(a)), which revealed a significant reduction in T-cell proliferative capacity in the Non-Response group. Next, we assessed the cytotoxic function of T cells and observed that the Non-Response group was significantly less effective at all three effector-to-target ratios (Figure 3(b)). Since T-cell proliferation and functional activity require energy, we compared the aerobic glycolytic capacity of T cells using the Seahorse assay. The results showed that T cells in the Non-Response group exhibited significantly reduced glycolytic capacity (Figure 3(c)).
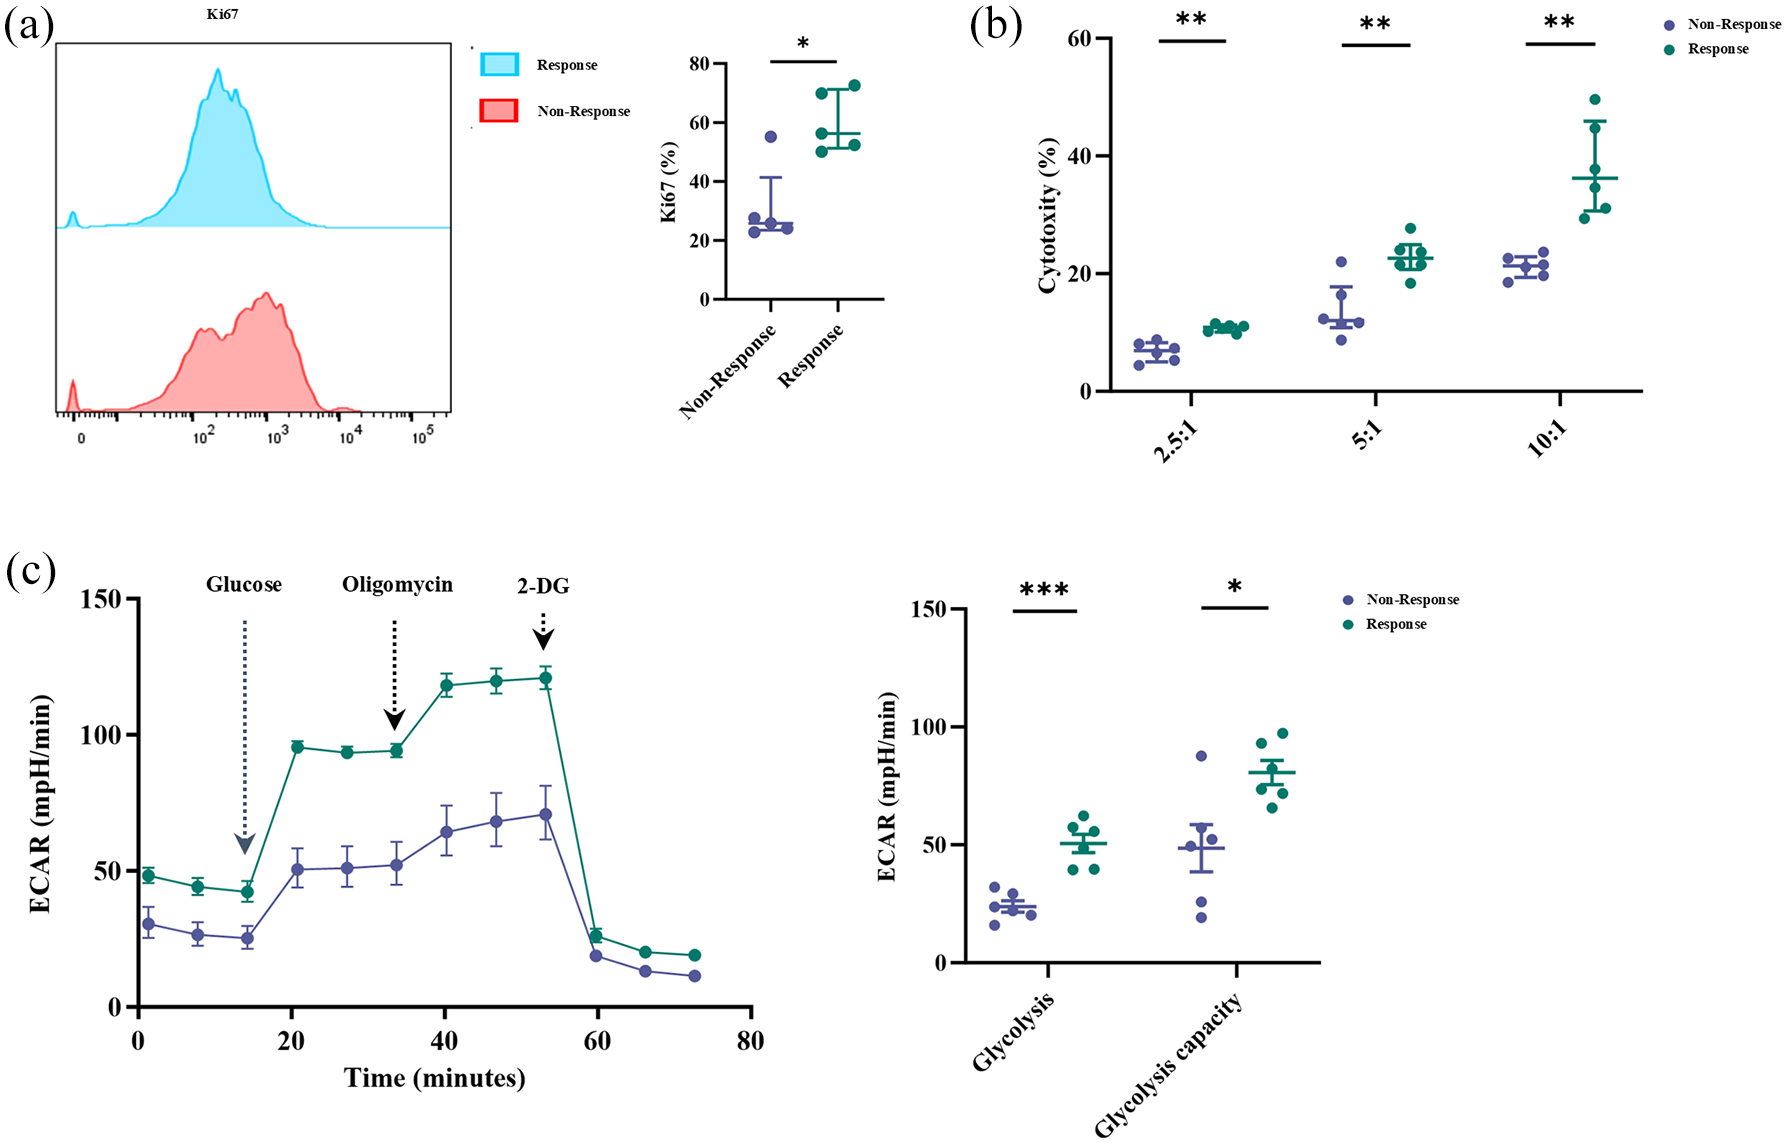
T lymphocytes from the Non-Response group were in a state of functional exhaustion. Differences in T-lymphocyte function. (a) The frequency of Ki67 expression in T lymphocytes (n = 5). (b) Cytotoxic analysis of T lymphocytes from two groups after coculture with HepG2 cells at specified E:T ratio for 6 h, which was indicated by the percentage of PI-positive cells (n = 6). (c) Seahorse metabolic assay showed that T lymphocytes from the Response group enhanced ECAR (n = 6).
These findings collectively demonstrate that T cells in the Non-Response group exhibit functional impairment, characterized by reduced proliferative capacity, compromised cytotoxic function, and diminished metabolic activity.
Distinct transcriptomic characteristics of peripheral T lymphocytes between the two groups
Previous data have shown that T lymphocytes in the two groups exhibit distinct phenotypic and functional characteristics. Therefore, we aimed to determine whether they exhibit distinct transcriptomic profiles. The clustering results demonstrated high intra-group consistency and clear inter-group differences (Figure 4(a)). Figure 4(b) illustrates differentially expressed genes between the two groups, with 1078 genes upregulated and 935 downregulated, respectively. The pathway enrichment of differential genes between the two groups is detailed in Figure S3. GSEA revealed that T lymphocytes in the Response group were enriched in galactose metabolism and oxidative phosphorylation pathways (Figure 4(c) and (d)). Consistent with the Seahorse assay results, T lymphocytes in the Non-Response group exhibited reduced energy utilization efficiency. In addition, pathways related to platinum drug resistance and cytochrome P450 metabolism were enriched in the Response group, suggesting enhanced drug metabolism tolerance in T lymphocytes (Figure 4(e) and (f)). Finally, PPI analysis identified glyceraldehyde-3-phosphate dehydrogenase (GAPDH) as a key gene, emphasizing its critical role in glycolysis (Figure 4(g)). In conclusion, these findings underscore the importance of energy metabolism for T lymphocytes.

T lymphocytes isolated from peripheral blood have distinct transcriptomic signatures between the two groups. (a) PCA between two groups (n = 3). (b) The volcano plot shows differentially expressed genes (DEGs) between the two groups. GSEA enrichment plots and heatmap of galactose metabolism (c), oxidative phosphorylation (d), platinum drug resistance (e), and metabolism of Xenobiotics by Cytochrome P450 gene (f) in T lymphocytes between two groups. (g) Protein interaction network of differentially expressed genes between two groups.
The values of baseline CD8+ TSCM and CD8+ TSenescence subsets to predict benefit and survival
Regarding the baseline data on peripheral lymphocyte subsets in the Non-Response and Response groups, significant differences were observed (Table 3 and Figure 2), while no significant differences were observed in baseline clinical characteristics (Figure S4(a)). Significant increases were observed in CD8+ TN (p = 0.0476), CD8+ TEMRA (p = 0.0442), CD4+ TSCM (p = 0.0444), and CD8+ TSCM (p = 0.0004) in the Response group, whereas the Non-Response group exhibited elevated levels of PLR (p = 0.0461, Table 2), CD8+ TEM (p = 0.0064), CD8+ TSenescence (p = 0.0014), and CD4+ TSenescence (p = 0.0141). Furthermore, stepwise logistic analyses revealed that baseline CD8+ TSCM and CD8+ Tsenescence subsets were important predictors of therapeutic efficacy (Figure 5(a)–(c)).
Predictive factors for the effectiveness of TACE.

AFP, α-fetoprotein; BCLC, Barcelona clinic liver cancer; CI, confidence interval; ECOG PS, eastern cooperative oncology group performance status; LMR, lymphocyte-to-monocyte ratio; NLR, neutrophil-to-lymphocyte ratio; OR, odds ratio; PLR, platelet-to-lymphocyte ratio; TACE, transcatheter arterial chemoembolization.
Predictive factors for the effectiveness of T lymphocyte subsets.

p < 0.05; **p < 0.01; ***p < 0.001.
CI, confidence interval; OR, odds ratio; TACE, transcatheter arterial chemoembolization.

The predictive value of baseline lymphocyte subsets for TACE treatment response and survival. (a) Univariate logistic regression of baseline laboratory examination to predict objective response. (b) Univariate logistic regression of baseline T-lymphocyte subsets to predict objective response. (c) Stepwise multivariate logistic regression of baseline T-lymphocyte subsets to predict treatment response for TACE. (d) The ROC curve of baseline CD8+ TSCM to predict response for TACE. (e) The ROC curve of baseline CD8+ TSenescence to predict response for TACE. (f) The ROC curve of baseline CD8+ TSCM combined with CD8+ TSenescence to predict response for TACE. (g) The value of cutoff points for CD8+ TSCM to distinguish between patients in the Non-Response and Response group. (h) The value of cutoff points for CD8+ TSenescence to distinguish between patients in the Non-Response and Response groups. (i) The value of the combination of cutoff points for CD8+ TSCM and CD8+ TSenescence to distinguish between patients in the Non-Response and Response groups. (j) Kaplan–Meier survival curves for PFS (left) and OS (right) between different CD8+ TSCM subsets. (k) Kaplan–Meier survival curves for PFS (left) and OS (right) between different CD8+ TSenescence subsets. (l) Kaplan–Meier survival curves for PFS between different CD8+ TSCM-TSenescence subsets.
The area under the ROC curve (AUC) was calculated to assess the baseline predictive efficacy of CD8+ TSCM and CD8+ TSenescence subsets, as shown in Figure 5(d) and (e). The AUC for CD8+ TSCM was 0.8325 (95% CI: 0.7219–0.9431), with a maximum Youden index of 0.5225, which corresponded to a cutoff value of 41.15%. The AUC for CD8+ Tsenescence was 0.8117 (95% CI: 0.6878–0.9356), with a maximum Youden index of 0.6282, which corresponded to a cutoff value of 26.6%. The combined analysis yielded an AUC of 0.9087 (95% CI: 0.8287–0.9886) (Figure 5(f)). Subsequently, we evaluated the predictive accuracy of these thresholds. The CD8+ TSCM cutoff showed a positive predictive value of 79.17% (19/24) and a negative predictive value of 73.08% (19/26) (Figure 5(g)). For the CD8+ TSenescence cutoff, the positive predictive value was 94.1% (16/17) and the negative predictive value was 75.8% (25/33) (Figure 5(h)). We defined values above the cutoff as “High” while those below as “Low.” When both cutoffs were analyzed together, the combination of CD8+ TSCMHigh and TSenescenceLow was associated with a better prognosis, as 90% of the beneficiaries at baseline (18/20) showed this profile. By contrast, only 7% of the cases with both CD8+ TSCMLow and TSenescenceHigh (1/14) exhibited a favorable outcome (Figure 5(i)).
Therefore, the baseline percentages of CD8+ TSCM and CD8+ TSenescence subpopulations may serve as accurate markers for predicting the response of uHCC patients to TACE.
Finally, we compared the PFS and OS between the two subgroups using Kaplan–Meier survival curves. The analysis revealed that patients with higher baseline CD8+ TSCM levels exhibited significantly longer PFS (14.55 versus 9.35 months; p = 0.0029) and OS (24.50 versus 15.12 months; p = 0.0007) (Figure 5(j)). Similarly, patients with higher baseline CD8+ TSenescence levels exhibited significantly shorter PFS (9.17 versus 13.33 months; p = 0.0018) and OS (14.00 versus 22.73 months; p = 0.0017) (Figure 5(k)). When the two predictors were combined, superior survival prediction was observed, with significantly longer PFS (p = 0.0006, Figure 5(l)) and OS (p = 0.0001, Figure 5(l)) in the CD8+ TSCMHigh versus TSenescenceLow group compared to the other two groups. Furthermore, patients with CD8+ TSCMLow and TSenescenceHigh exhibited the shortest PFS and OS (Figure 5(l)). These survival results further underscore the strong clinical significance of these two biomarks.
Discussion
Previous studies have focused on the role of the tumor and the inhibitory TME, there is a significant gap of understanding regarding peripheral immunity, especially T-lymphocyte subsets. Few studies have explored the relationship between peripheral immune characteristics and TACE failure, underscoring the urgent need for reliable predictive biomarkers. In this study, we analyzed peripheral blood T lymphocytes by flow cytometry and identified distinct differences in subpopulation phenotypes and functions among patients with different TACE outcomes. We further aimed to elucidate the underlying mechanisms through transcriptomic analysis. Our findings demonstrated that patients with high pre-treatment CD8+ TSCM levels exhibited favorable responses to TACE, while those with elevated levels of the CD8+ TSenescence subgroup were more prone to experience TACE failure. The high AUC values suggest that the combination of CD8+ TSCM and CD8+ TSenescence may serve as a predictive tool for treatment response and prognosis in uHCC patients undergoing TACE.
T lymphocytes play a central role in the antitumor immune response, particularly CD8+ T lymphocytes (CTL), which function as cytotoxic cells. They recognize antigens presented by major histocompatibility complex (MHC) class I molecules and secrete cytolytic granules and chemokines to eliminate cancer cells. 9 TN, characterized by high expression of CD45RA and CCR7, typically remains in a quiescent state and exhibits self-renewal and differentiation plasticity. Upon exposure to tumor antigenic stimulation, they become activated, proliferate, and differentiate into effector T cells (TEFF). In our study, we observed that the baseline CD8+ TN levels in the Response group were significantly higher than those in the Non-Response group (Figure 2(a)). A similar trend was observed in CD8+ TEMRA, a subset of TEFF express CD45RA; however, the difference was not statistically significant (Figure 2(a)). By contrast, the CD8+ TEM subpopulation was reduced in the Response group. A recent study on combined immunotherapy for advanced HCC showed that CD8+ TEMRA was more abundant in responding tumors, while CD8+ TEM was increased in non-responders. 18 Peripheral CD8+ TEM cells differentiate into CD8+ TEMRA cells, which enables them to exert effector functions specifically targeting tumor cells. 19 Furthermore, in the inflammatory microenvironment associated with HCC, peripheral CD8+ TEM cells migrate to the tumor site via the CXCR3 molecule to fulfill their homing function 20 ; however, this finding requires further validation. Following TACE treatment, tumor tissues release a substantial amount of tumor antigens which activate systemic immunity. 21 However, T-cell dysfunction rapidly develops after the onset of carcinogenesis, resulting in exhausted T cells with reduced antigen reactivity and impaired ability to provide T-cell help or eliminate target cells. Consequently, patients with pre-existing T-lymphocyte dysfunction face significant challenges in benefiting from TACE. Therefore, we hypothesized that peripheral T lymphocytes with high differentiation potential and strong effector capacity may play a critical role in predicting TACE responsiveness.
The downregulation of the co-stimulatory molecules CD27 and CD28 represents the most characteristic phenotypic change in senescent T cells. 22 Senescent cells exhibit strong inhibitory activity, significantly enhancing the immunosuppressive effect in the TME. They influence both immune cells and tumor cells by secreting various cytokines into the TME, thereby promoting tumor initiation and progression. 23 By contrast, the TSCM is a rare subset of memory lymphocytes characterized by high expression of CCR7, CD45RA, CD27, and CD28. They exhibit stem cell-like self-renewal capacity and multipotential differentiation potential, enabling them to reconstitute the entire memory and effector T-cell repertoire. Cumulative evidence from studies in mice, non-human primates, and humans indicates that TSCM cells are minimally differentiated and occupy the apex of the memory T-cell hierarchy. 24 Therefore, the increased proportion of senescent T cells in the circulating pool, combined with the lack of TSCM cells, creates an “exhausted” immune environment. This condition impairs the body’s ability to recruit T lymphocytes to the tumor, potentially explaining the poor response to TACE. Furthermore, our functional analysis revealed that in the CD8+ T-cell compartment, the Non-Response group expressed higher levels of exhausted markers and lower production of cytotoxic molecules, indicating T-cell exhaustion. Analysis of the overall T-cell population revealed a dysfunctional state across all subsets. Previous studies have shown that exhausted and senescent T-cell populations are significantly enriched and coexist in circulation and/or tumor sites. 25 In summary, the immune landscape of peripheral T lymphocytes in the Non-Response group is characterized by a reduction in stem-like cells, an increase in senescent phenotype, and widespread cellular dysfunction.
We conducted GSEA to identify the relevant pathways associated with differences in T-cell production between the two groups. The results showed that the Response group was enriched in pathways related to galactose metabolism and oxidative phosphorylation (OXPHOS), both of which are associated with energy metabolism. T-cell activation, proliferation, and effector functions are energy-intensive processes. During early activation, T lymphocytes primarily rely on OXPHOS to meet the energy demands for proliferation and differentiation, whereas their effector functions in later stages depend on glycolysis. 26 Our findings revealed a decline in both energy metabolism pathways, which may contribute to T-lymphocyte dysfunction. In addition, the enrichment of T lymphocytes in the platinum-resistance-related pathway in the Response group suggested that they enhanced chemotherapy tolerance. The cytochrome P450 (CYP450) enzyme family plays a critical role in drug metabolism, with P450 enzymes involved in over 70% of drug metabolism in humans. 27 Therefore, T lymphocytes enriched with these enzymes exhibit enhanced detoxification. These characteristics of the patient’s peripheral T lymphocytes likely contribute to the observed treatment benefits, although the underlying mechanisms require further investigation.
To further clarify the relationship between T-lymphocyte subsets and TACE efficacy, we conducted both univariate and multivariate analyses. We initially evaluated several markers with established predictive value, identifying the PLR (Figure S4(b) and (c)) as a potential predictor of TACE failure. However, variations in the degree of liver cirrhosis, 28 along with comorbidities such as diabetes, 29 may influence the PLR, thereby limiting its predictive utility. Our analysis indicated that CD8+ TSCM and CD8+ TSenescence are both predictive and prognostic factors for TACE treatment response. Previous studies have shown that the pre-treatment level of senescent T cells in peripheral blood correlates with the prognosis of patients receiving chemotherapy or radiotherapy. 23 Higher levels of senescent T cells have been shown to predict unfavorable OS and PFS in patients with advanced tumors, as demonstrated in advanced gastric cancer, 30 non-small-cell lung cancer (NSCLC), 31 breast cancer, 32 and acute myelocytic leukemia (AML). 33 TSCM exhibits excellent persistence and contributes to antitumor immunity. 34 A study on NSCLC indicated that patients with higher pre-treatment TSCM cell counts and percentages experienced significantly longer median PFS. 11 Furthermore, our study highlights, for the first time, the advantage of combined analyses (Figure 5(f)). However, larger sample sizes will be required in future studies to validate these findings.
The efficacy of TACE is, at least in part, attributed to its dual effects on innate immunity and adaptive immunomodulation. On one hand, TACE activates the body’s immune system by delivering chemotherapeutic agents that kill tumor cells, thereby releasing a large number of antigens into the peripheral blood, creating a favorable microenvironment for T cells to exert antitumor effects. 35 On the other hand, CD8+ T lymphocytes play a critical role in antitumor therapy, and TSCM cells have demonstrated the ability to differentiate into TCM, TEM, and TEFF. This differentiation ensures the continuous production of immunological reinforcements. Therefore, patients with a favorable pre-treatment peripheral immune status are more likely to benefit from TACE.
Limitations and prospects
Our study has several limitations. First, following the guidelines of CSCO (2020 version), we did not include ICIs in our study, instead focusing on TACE and TKIs as the primary treatments. Second, our study is a single-center investigation with a limited sample size and lacks an external validation cohort. Third, treatment resumption in the Non-Response group is complex, potentially affecting subsequent patient survival. Finally, the lack of tumor tissue samples prevented us from assessing the concordance between tumor-infiltrating lymphocytes and peripheral lymphocytes.
Our findings suggest that peripheral T lymphocytes in the Non-Response group exhibit functional impairment resembling senescence, distinct from the classical exhaustion state. Future studies should focus on this subset and explore strategies to reverse this suppressive state and restore T-lymphocyte functionality.
Conclusion
In conclusion, this real-world study highlights the significance of pre-TACE peripheral T-lymphocyte immune profiles. Our results demonstrate the differences in T-lymphocyte populations associated with varying outcomes and emphasize their prognostic value for patients. Only CD8+ TSCM and CD8+ TSenescence remained robust predictors of objective response in both univariate and multivariate logistic regression analyses, and they were also associated with long-term patient survival, underscoring the critical predictive role of peripheral T-lymphocyte immune profiles. These insights into patients’ peripheral blood T lymphocytes have significant implications for HCC disease management and clinical decision-making regarding TACE therapy. Future studies should focus on validating the clinical applicability of these immune profiles and evaluating their impact on treatment decision-making.
Supplemental Material
sj-docx-1-tag-10.1177_17562848251333295 – Supplemental material for Peripheral T lymphocyte immune characteristics dictate response to transarterial chemoembolization in unresectable hepatocellular carcinoma
Supplemental material, sj-docx-1-tag-10.1177_17562848251333295 for Peripheral T lymphocyte immune characteristics dictate response to transarterial chemoembolization in unresectable hepatocellular carcinoma by Lei Peng, Qi Liang, Peng Fei Rong, Shengwang Zhang, Huan Chen, Huaping Liu, Xiaoqian Ma and Wei Wang in Therapeutic Advances in Gastroenterology
Supplemental Material
sj-docx-2-tag-10.1177_17562848251333295 – Supplemental material for Peripheral T lymphocyte immune characteristics dictate response to transarterial chemoembolization in unresectable hepatocellular carcinoma
Supplemental material, sj-docx-2-tag-10.1177_17562848251333295 for Peripheral T lymphocyte immune characteristics dictate response to transarterial chemoembolization in unresectable hepatocellular carcinoma by Lei Peng, Qi Liang, Peng Fei Rong, Shengwang Zhang, Huan Chen, Huaping Liu, Xiaoqian Ma and Wei Wang in Therapeutic Advances in Gastroenterology
Supplemental Material
sj-docx-3-tag-10.1177_17562848251333295 – Supplemental material for Peripheral T lymphocyte immune characteristics dictate response to transarterial chemoembolization in unresectable hepatocellular carcinoma
Supplemental material, sj-docx-3-tag-10.1177_17562848251333295 for Peripheral T lymphocyte immune characteristics dictate response to transarterial chemoembolization in unresectable hepatocellular carcinoma by Lei Peng, Qi Liang, Peng Fei Rong, Shengwang Zhang, Huan Chen, Huaping Liu, Xiaoqian Ma and Wei Wang in Therapeutic Advances in Gastroenterology
Supplemental Material
sj-docx-4-tag-10.1177_17562848251333295 – Supplemental material for Peripheral T lymphocyte immune characteristics dictate response to transarterial chemoembolization in unresectable hepatocellular carcinoma
Supplemental material, sj-docx-4-tag-10.1177_17562848251333295 for Peripheral T lymphocyte immune characteristics dictate response to transarterial chemoembolization in unresectable hepatocellular carcinoma by Lei Peng, Qi Liang, Peng Fei Rong, Shengwang Zhang, Huan Chen, Huaping Liu, Xiaoqian Ma and Wei Wang in Therapeutic Advances in Gastroenterology
Supplemental Material
sj-docx-5-tag-10.1177_17562848251333295 – Supplemental material for Peripheral T lymphocyte immune characteristics dictate response to transarterial chemoembolization in unresectable hepatocellular carcinoma
Supplemental material, sj-docx-5-tag-10.1177_17562848251333295 for Peripheral T lymphocyte immune characteristics dictate response to transarterial chemoembolization in unresectable hepatocellular carcinoma by Lei Peng, Qi Liang, Peng Fei Rong, Shengwang Zhang, Huan Chen, Huaping Liu, Xiaoqian Ma and Wei Wang in Therapeutic Advances in Gastroenterology
Supplemental Material
sj-docx-6-tag-10.1177_17562848251333295 – Supplemental material for Peripheral T lymphocyte immune characteristics dictate response to transarterial chemoembolization in unresectable hepatocellular carcinoma
Supplemental material, sj-docx-6-tag-10.1177_17562848251333295 for Peripheral T lymphocyte immune characteristics dictate response to transarterial chemoembolization in unresectable hepatocellular carcinoma by Lei Peng, Qi Liang, Peng Fei Rong, Shengwang Zhang, Huan Chen, Huaping Liu, Xiaoqian Ma and Wei Wang in Therapeutic Advances in Gastroenterology
Supplemental Material
sj-tif-10-tag-10.1177_17562848251333295 – Supplemental material for Peripheral T lymphocyte immune characteristics dictate response to transarterial chemoembolization in unresectable hepatocellular carcinoma
Supplemental material, sj-tif-10-tag-10.1177_17562848251333295 for Peripheral T lymphocyte immune characteristics dictate response to transarterial chemoembolization in unresectable hepatocellular carcinoma by Lei Peng, Qi Liang, Peng Fei Rong, Shengwang Zhang, Huan Chen, Huaping Liu, Xiaoqian Ma and Wei Wang in Therapeutic Advances in Gastroenterology
Supplemental Material
sj-tif-7-tag-10.1177_17562848251333295 – Supplemental material for Peripheral T lymphocyte immune characteristics dictate response to transarterial chemoembolization in unresectable hepatocellular carcinoma
Supplemental material, sj-tif-7-tag-10.1177_17562848251333295 for Peripheral T lymphocyte immune characteristics dictate response to transarterial chemoembolization in unresectable hepatocellular carcinoma by Lei Peng, Qi Liang, Peng Fei Rong, Shengwang Zhang, Huan Chen, Huaping Liu, Xiaoqian Ma and Wei Wang in Therapeutic Advances in Gastroenterology
Supplemental Material
sj-tif-8-tag-10.1177_17562848251333295 – Supplemental material for Peripheral T lymphocyte immune characteristics dictate response to transarterial chemoembolization in unresectable hepatocellular carcinoma
Supplemental material, sj-tif-8-tag-10.1177_17562848251333295 for Peripheral T lymphocyte immune characteristics dictate response to transarterial chemoembolization in unresectable hepatocellular carcinoma by Lei Peng, Qi Liang, Peng Fei Rong, Shengwang Zhang, Huan Chen, Huaping Liu, Xiaoqian Ma and Wei Wang in Therapeutic Advances in Gastroenterology
Supplemental Material
sj-tif-9-tag-10.1177_17562848251333295 – Supplemental material for Peripheral T lymphocyte immune characteristics dictate response to transarterial chemoembolization in unresectable hepatocellular carcinoma
Supplemental material, sj-tif-9-tag-10.1177_17562848251333295 for Peripheral T lymphocyte immune characteristics dictate response to transarterial chemoembolization in unresectable hepatocellular carcinoma by Lei Peng, Qi Liang, Peng Fei Rong, Shengwang Zhang, Huan Chen, Huaping Liu, Xiaoqian Ma and Wei Wang in Therapeutic Advances in Gastroenterology
Footnotes
Acknowledgements
The authors extend their gratitude to the Radiology Department and the anticipated Clinical Research Core Laboratory at Third Xiangya Hospital, Central South University, for providing the facilities necessary to conduct this research.
Declarations
Supplemental material
Supplemental material for this article is available online.
References
Supplementary Material
Please find the following supplemental material available below.
For Open Access articles published under a Creative Commons License, all supplemental material carries the same license as the article it is associated with.
For non-Open Access articles published, all supplemental material carries a non-exclusive license, and permission requests for re-use of supplemental material or any part of supplemental material shall be sent directly to the copyright owner as specified in the copyright notice associated with the article.