
Abstract
Background:
Fruquintinib is a third-line and subsequent targeted therapy for patients with metastatic colorectal cancer (mCRC). Identifying survival predictors after fruquintinib is crucial for optimizing the clinical use of this medication.
Objectives:
We aimed to identify factors influencing the prognosis of patients with mCRC treated with fruquintinib and to leverage these insights to develop a nomogram model for estimating survival rates in this patient population.
Design:
Multicenter retrospective observational study.
Methods:
We collected patient data from January 2019 to October 2023, with one healthcare institution’s data serving as the training cohort and the other three hospitals’ data serving as the multicenter validation cohort. The nomogram for overall survival was calculated from Cox regression models, and variable selection was screened using the univariate Cox regression analysis with additional variables based on clinical experience. Model performance was measured by the concordance index (C-index), calibration curves, decision curve analyses (DCA), and utility (patient stratification into low-risk vs high-risk groups).
Results:
Data were ultimately collected on 240 patients, with 144 patients included in the training cohort and 96 included in the multicenter validation cohort. Predictors included in the nomogram were CA199, body mass index, T stage, the primary site of the tumor, and other metastatic and pathological differentiation. The C-index of the nomogram in the training set and multicenter validation was 0.714 and 0.729, respectively. The models were fully calibrated and their predictions aligned closely with the observed data. DCA curves indicated the promising clinical benefits of the predictive model. Finally, the reliability of the model was also verified through the risk classification using the nomogram.
Conclusions:
We constructed a nomogram for mCRC treated with fruquintinib based on six variables that may be used to assist in personalizing the use of the drug.
Plain language summary
The prognostic predictors of fruquintinib as a third-line and subsequent treatment agent for patients with mCRC have not been established. In this study, we explored possible factors influencing its prognosis and developed a nomogram model for estimating survival rates in this patient population. The nomogram, based on six key variables including CA199, BMI, T stage, primary tumor site, other metastatic sites, and pathological differentiation, was validated through a rigorous multicenter validation process. The nomogram has the potential to help clinicians personalize the use of fruquintinib for mCRC patients.
Introduction
Metastatic colorectal cancer (mCRC) has a high incidence, poor prognosis, and low 5-year survival rate.1–6 The current first- and second-line approach to the treatment of mCRC is systemic chemotherapy (5-fluorouracil plus irinotecan or oxaliplatin) in combination with molecularly targeted therapies such as anti-angiogenic drugs or anti-epidermal growth factor receptor (EGFR) drugs.7,8 Unfortunately, a significant number of patients who have undergone first- or second-line therapy develop drug resistance or tumor progression and enter backline therapy. Currently, regorafenib, an antiangiogenic multikinase inhibitor, 9 and trifluridine-tipiracil (TAS-102), a fluoropyrimidine derivative, 10 have alleviated the druglessness of the backline treatment of mCRC. 11 However, because of limited efficacy, there is still an unmet clinical need for backline treatment options for mCRC.
Fruquintinib is a highly selective oral tyrosine kinase inhibitor (TKI) that targets VEGFR1–3 and acts as an antitumor agent by inhibiting angiogenesis. 12 The FRESCO and FRESCO-2 studies confirmed that patients with mCRC have the opportunity to benefit from fruquintinib treatment, which improves patients’ outcomes and has a good safety profile with manageable drug side effects during treatment.13,14 Although the two large clinical studies described above suggest that fruquintinib is effective, there may be differences in fruquintinib sensitivity in response to different conditions, such as patient’s underlying condition, clinical disease characteristics, and treatment-related data, which may affect its efficacy. Identifying candidate patients most likely to benefit from fruquintinib treatment is therefore an unmet need in the mCRC therapeutic area. There is currently no model to assess the prognosis of mCRC patients treated with fruquintinib, nor is there a consensus or strategy for selecting appropriate patients to receive fruquintinib therapy.
Our goal is to develop a nomogram for predicting the prognosis of mCRC patients treated with fruquintinib, to assess the individualized differences in the clinical application of fruquintinib and thus to find advantageous populations to benefit from it, and to meet the conditions of today’s precision medicine and individualized dosing.
Methods
Patients
We retrospectively evaluated the data from patients who had received fruquintinib as a third or beyond line of treatment for mCRC from January 2019 to October 2023 at four hospitals in China. Inclusion criteria were (1) histologically confirmed mCRC; (2) disease progression or intolerance with first- or second-line therapy; and (3) the backline regimen is fruquintinib-based therapy. Cases with unknown information on demographic and clinical variables were excluded (Figure 1). Two hundred forty cases were ultimately included and analyzed in this study; 144 patients from 1 hospital were included in the training cohort and 96 patients from the other 3 hospitals were included in the multicenter validation cohort. This retrospective study was approved by the Research Ethics Committee on Biomedical Research (RECBR), West China Hospital of Sichuan University.
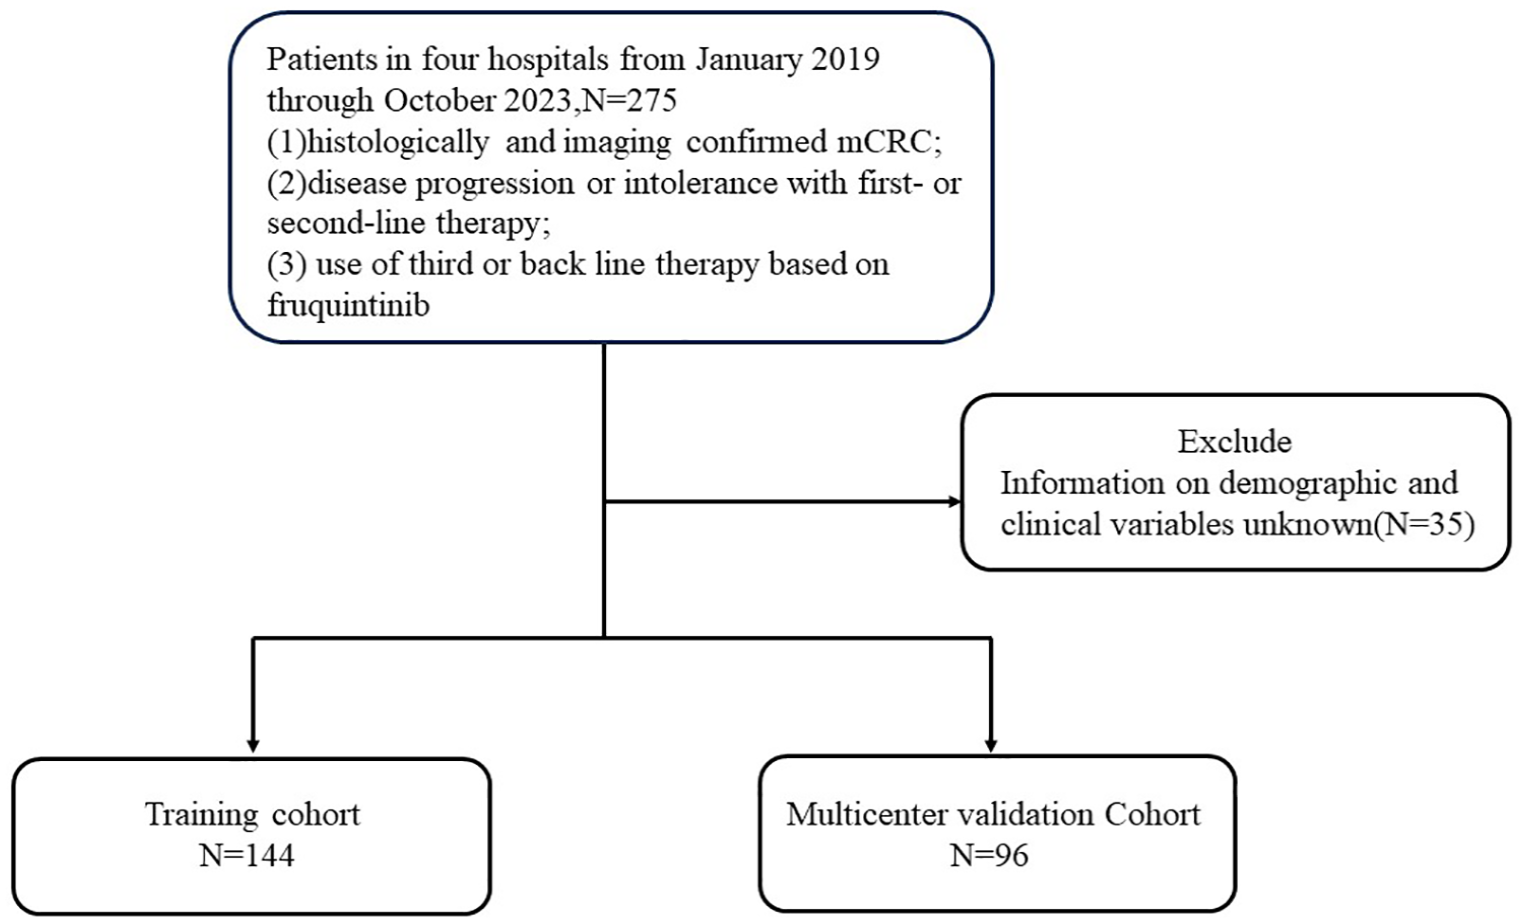
Illustration of the study design for the inclusion and exclusion criteria for patient enrollment.
Data collection and variables
Demographic information, clinical disease characteristics, and treatment data were collected from the medical records of eligible patients. Gender, age, and fundamental disease were collected as demographic information. Clinical characteristics included monocyte-to-lymphocyte ratio (MLR), neutrophil-to-lymphocyte ratio (NLR), prognostic nutritional index (PNI), CEA, CA199, and body mass index (BMI) before the application of fruquintinib. Disease characteristics included T and N stage, primary tumor location (the portion from the cecum to the right two-thirds of the transverse colon was defined as the tumor’s primary site on the right side, and the remaining portion of the colon and rectum was defined as the primary focus on the left side), single or multiple metastases, metastatic site, RAS and BRAF gene mutation status, and level of pathological differentiation. Treatment history included primary tumor or metastatic site lesion surgery, radiotherapy, and also whether EGFR, VEGFR inhibitors, and fruquintinib therapeutic lineage were applied in previous treatment. In addition to the above, survival status was also collected. Overall survival (OS) was defined as survival from the start of fruquintinib use to all-cause death.
Statistical analysis
We have converted continuous variables to categorical variables based on predefined cut-off values. Categorical variables were described in the form of frequencies and proportions. Pearson’s Chi-squared test and Fisher’s exact test were used to compare the distributions of the hypothesized variables between the training and validation cohorts. A nomogram was established by screening prognostic factors for mCRC patients based on the Cox proportional hazards model and clinical experience.
Besides, the study utilized the concordance index (C-index), calibration curves, and decision curve analyses (DCA) as tools for evaluating the model. The C-index was utilized to measure the accuracy and discriminative ability of the variables included in the nomogram. Calibration curves, generated using 1000 bootstrap resamples, were used to assess the calibration of the nomogram. Furthermore, DCA was employed to evaluate the clinical utility of the nomogram.
Finally, a risk stratification system was developed by categorizing patients into two distinct groups (low and high) according to their total scores. This risk stratification system was implemented in both study populations.
In this research, statistical significance was defined as p < 0.05 (bilateral). R software (version 4.2.2; R Foundation for Statistical Computing, Vienna, Austria) and MSTATA software (https://www.mstata.com/) were used for all statistical analyses. The R packages used in this article are listed below: dplyr, rms, survival, timeROC, riskRegression, survminer, regplot, nomogramFormula, and survcomp.
The reporting of this study conforms to the Strengthening the Reporting of Observational Studies in Epidemiology (STROBE) statement (Supplemental Material). 15
Results
Demographic and baseline characteristics
Demographic and baseline characteristics of the total, training, and multicenter validation populations are presented (Table 1). In our study, half of the patients were elderly (>60 years), mostly male with underlying disease. Most of the patients had a BMI within the normal range, and the T stage was 3 or 4 with lymph node metastasis. The majority of patients had a primary site on the left side and had multiple metastases, with liver metastases predominating, followed by lung metastases. Nearly half of the patients displayed the wild-type of the RAS gene, while nearly all showed the wild-type of the BRAF gene. More than two-thirds of the patients were moderately differentiated. In terms of treatment strategy, more than 80% of patients underwent surgery at the primary site, while less than half underwent radiotherapy or surgery at the metastatic site. VEGFR inhibitors were applied to the vast majority of patients. The above showed the same trend in the training set and the multicenter validation set.
Patient demographics and baseline characteristics.
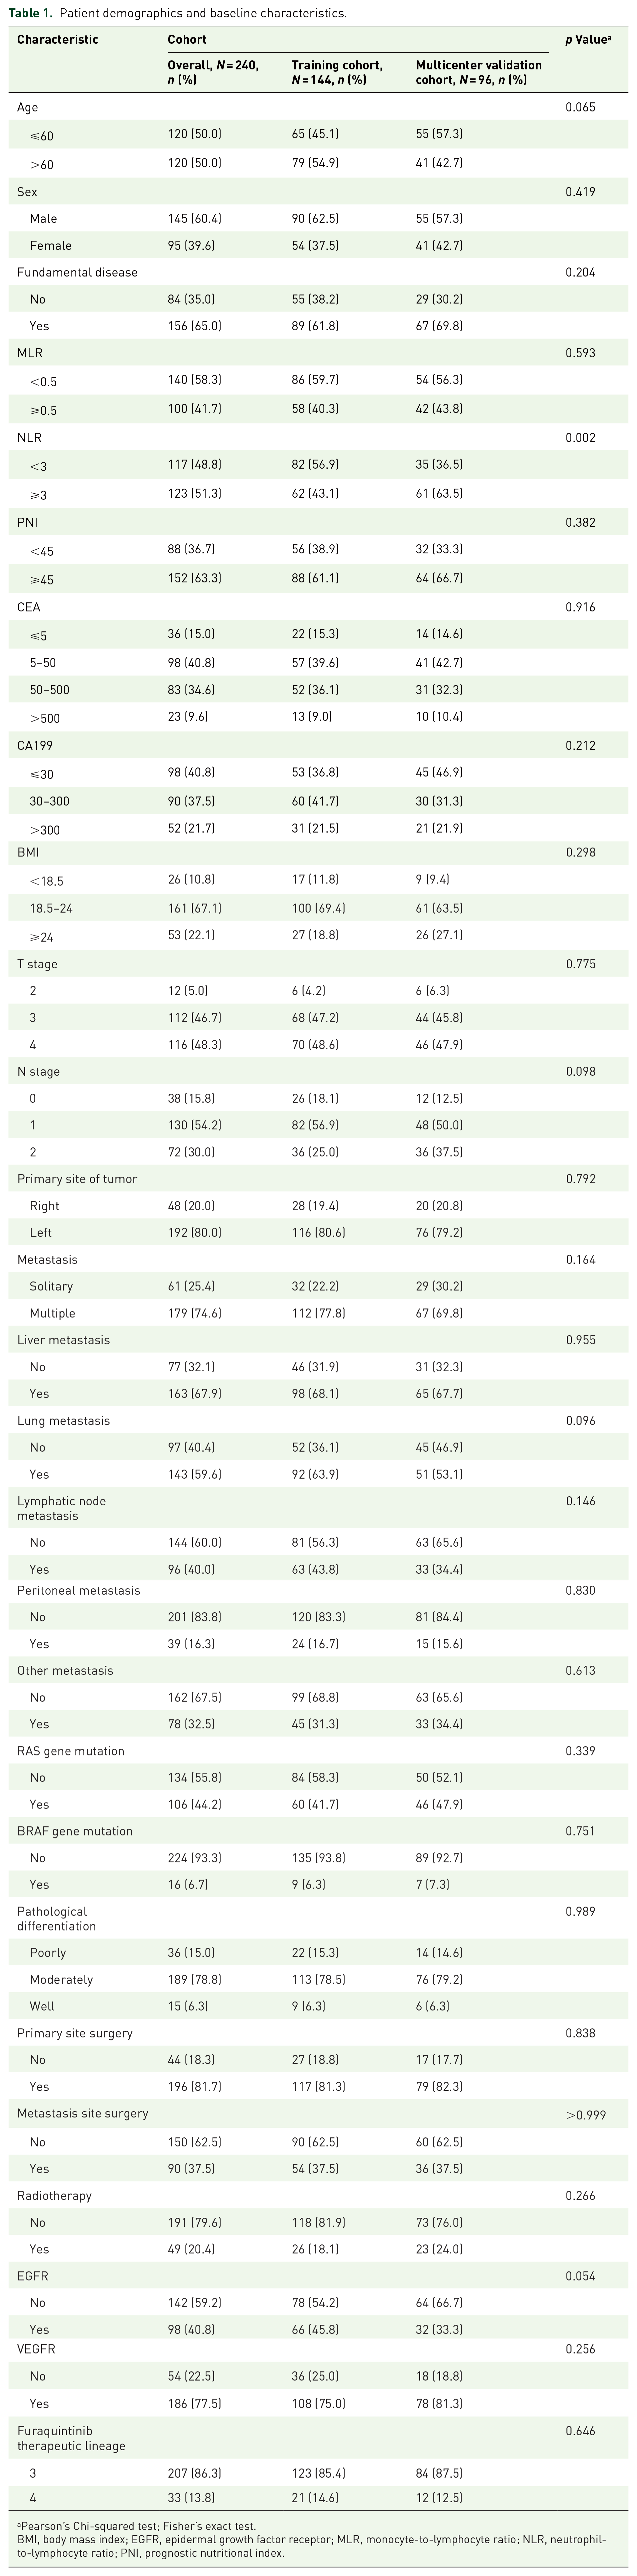
Pearson’s Chi-squared test; Fisher’s exact test.
BMI, body mass index; EGFR, epidermal growth factor receptor; MLR, monocyte-to-lymphocyte ratio; NLR, neutrophil-to-lymphocyte ratio; PNI, prognostic nutritional index.
Survival and prognostic factors of mCRC treated with fruquintinib
The median OS of the training cohort was 12.1 months (95% confidence interval (CI) 11.0–12.9). The OS rates at 6, 9, and 12 months were 89%, 71%, and 51%, respectively. In univariate Cox regression analysis, the following variables exhibited a significant association with survival: CA199, BMI, the primary site of tumor, other metastases, BRAF gene mutation, and pathological differentiation. In addition to the above variables, we included the following variables in a multivariate Cox regression analysis based on known possible influencing factors and clinical experience: T and N stage, presence of liver, lung, lymph node, peritoneal, and other metastases, RAS and BRAF gene mutations, pathological differentiation, primary or metastatic site surgery, radiotherapy, EGFR and VEGFR inhibitors, fruquintinib therapeutic lineage. However, only CA199, BMI, T stage, and other metastatic and pathological differentiation proved to be significant independent OS prognostic factors (Table 2).
Univariate and multivariate Cox regression analyses for OS of mCRC patients treated with fruquintinib in the training cohort.

BMI, body mass index; CI, confidence interval; EGFR, epidermal growth factor receptor; HR, hazard ratio; mCRC, metastatic colorectal cancer; MLR, monocyte-to-lymphocyte ratio; NLR, neutrophil-to-lymphocyte ratio; OS, overall survival; PNI, prognostic nutritional index.
Construction and multicenter validation of the nomogram
A nomogram was developed to predict OS at 6, 9, and 12 months using the prognostic factors mentioned earlier (Figure 2). The C-index was 0.714 (95% CI 0.663–0.765), and the corresponding areas under curve (AUCs) were 73.0%, 78.8%, and 80.6% at the 6, 9, and 12 months (Figure 3(a)). There was a good agreement between the predicted and actual probabilities, evidenced from the calibration curves which closely align with the 45° line (Figure 4(a)–(c)).

Nomogram model predicting the 6-, 9-, and 12-month OS in patients with mCRC. The nomogram is used by summing all points identified on the scale for each variable. The total points projected on the bottom scales indicate the probabilities of 6-, 9-, and 12-month survival.

ROC curves of the OS nomogram in the training cohort (a) and the multicenter validation cohort (b).

Calibration curves of the OS nomogram in the training cohort (a–c) and the multicenter validation cohort (d–f).
The nomograms also showed satisfactory discrimination in the multicenter validation cohort. The C-index was 0.729 (95% CI 0.674–0.784), and the AUCs for 6, 9, and 12 months were 73.0%, 73.4%, and 69.5%, respectively (Figure 3(b)). The calibration curves demonstrated good concordance between the predicted probabilities and the actual outcomes (Figure 4(d)–(f)). Additionally, in both the training set (Figure 5(a)–(c)) and multicenter validation set (Figure 5(d)–(f)), DCA illustrated considerable positive net benefits in the predictive model across a range of threshold probabilities for 6-, 9-, and 12-month OS. This suggested that the predictive model has good potential clinical outcomes.
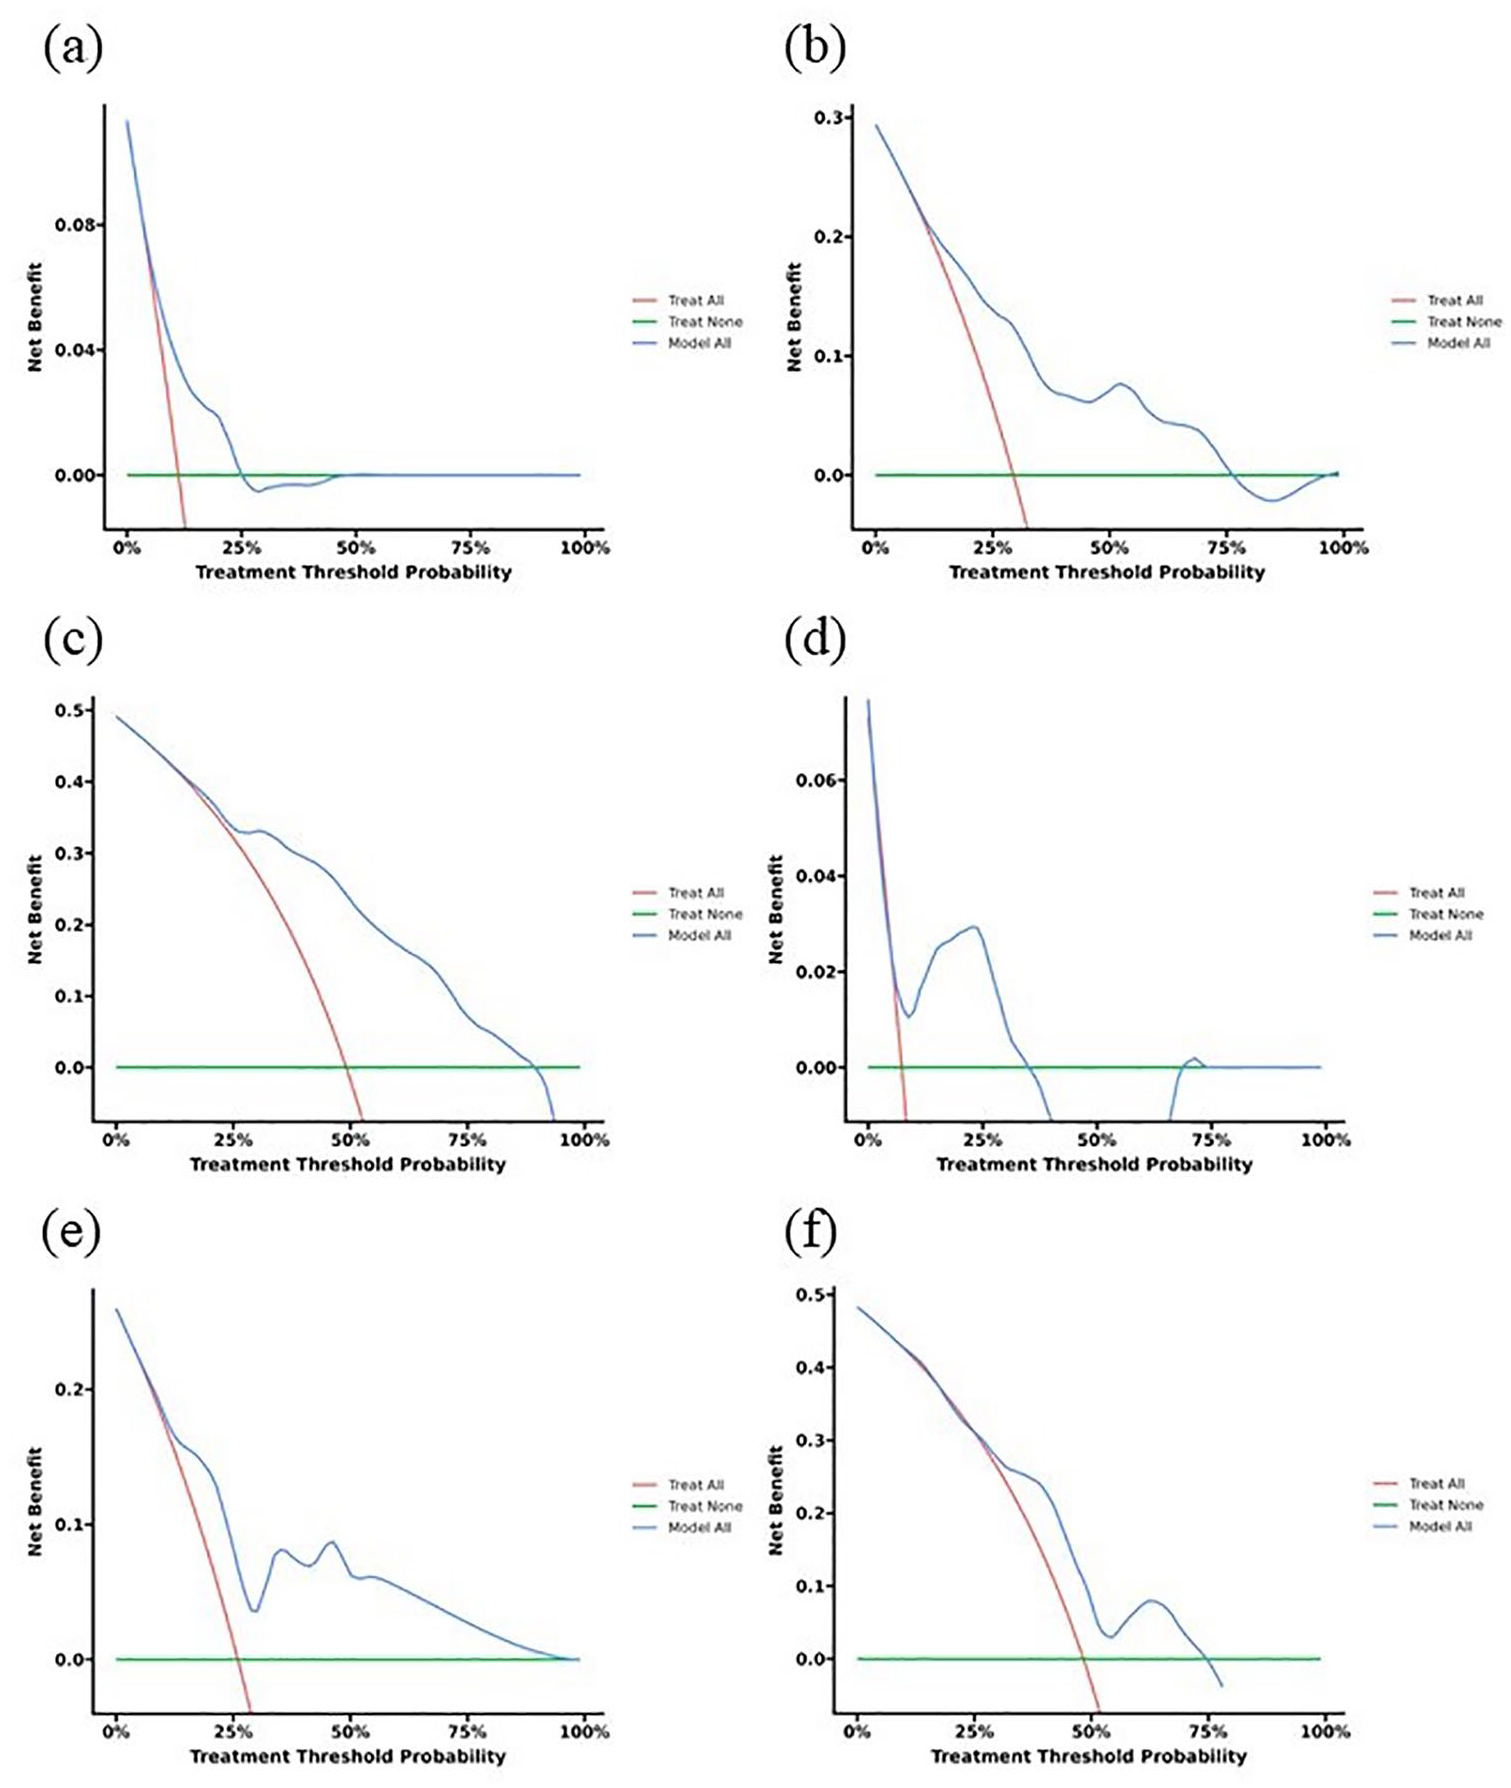
DCA of the OS nomogram in the training cohort (a–c) and the multicenter validation cohort (d–f).
A risk classification system for OS was created based on the proposed model. Patients from both the training and validation groups were categorized into either low-risk or high-risk prognostic cohorts. The Kaplan–Meier curves delineating two risk classification groups indicated a clear distinction in OS outcomes between the cohorts. The low-risk prognostic group exhibited significant survival advantages compared to the high-risk groups (p < 0.001) (Figure 6). It also shows that risk stratification has a high degree of accuracy.

Cumulative incidence estimates of the OS for patients in the low- and high-risk groups of the training cohort (a) and the multicenter validation cohort (b).
Discussion
The utilization of fruquintinib in treating mCRC is becoming increasingly prevalent. However, there is limited information regarding the survival outcomes of patients treated with fruquintinib and the factors that influence patient survival. To our knowledge, this is the first study that develops a strategy for selecting appropriate patients for the treatment of mCRC with fruquintinib. In our study, CA199 in the normal range (⩽30), BMI ⩾ 24, T stage as small as possible, tumor primary site on the left side, no other metastases, and pathologically highly differentiated may be correlated with a better prognosis in patients using fruquintinib, and the abovementioned probable factors were well validated.
Regorafenib is also an anti-VEGFR-TKI applied in the backline treatment of mCRC,16,17 and therefore is still informative in the exploration of risk factors although the number of targets acted on is different from fruquintinib. In the literature exploring the preferred criteria for regorafenib for mCRC, 18 CEA was not statistically significant in assessing factors affecting OS, which is the same as our findings. Furthermore, our study additionally suggested that CA199 > 300 is an independent risk factor, which was not previously mentioned in the relevant literature. In an article study on the real-world practice of fruquintinib, the decline in CEA after treatment could be seen as a potential predictor of better OS. 19 We validated the possibility of assessing OS by CEA level before fruquintinib treatment, which also provides more ideas for our subsequent in-depth study. BMI has been found to be a prognostic indicator for mCRC in previous studies, with patients with a low BMI having the greatest risk of death; the risk decreases and then plateaus with increasing BMI. 20 In our findings, a higher tier of BMI was likewise a protective factor affecting the prognosis of mCRC treated with fruquintinib. In the analysis of safety and adverse events in the FRESCO study, subgroup analyses by BMI did not reveal differences in the frequency of treatment-emergent adverse events, 21 so its prognostic impact on treatment with fruquintinib may still be related to the negative impact of cancer malignancy among patients with a low BMI. Previous explorations of prognostic factors in the application of regorafenib therapy have also included BMI as one of the explored factors, but a systematic nomogram was not formed for reference, 22 therefore, this study has a more comprehensive application value. In this study, in addition to liver, lung, lymph node, and peritoneal metastases analyzed in previous studies, we explored the effect of other metastases on the prognosis of applied fruquintinib. Bone, mesentery, ovary, uterus, and brain were counted as other metastases with statistical significance. This inspires us that subsequent data from larger samples are needed so that further studies on the above metastases can be conducted. Besides, T stage, primary site of the tumor, and pathological differentiation level are also common prognostic factors, which have been confirmed and included in our nomogram.
Subgroup analysis of the FRESCO study showed that the efficacy of fruquintinib was not affected by prior bevacizumab treatment, 21 and prior use of VEGFR inhibitors was not a factor in its impact on OS in our study. In contrast, regorafenib, which can also be used as a third-line treatment, has a much lower chance of benefit if bevacizumab has already been used for first- and second-line treatment, which reflects the advantages of fruquintinib. Currently, the median OS in the FRESCO-2 trial fruquintinib arm was 7.4 months (95% CI 6.7–8.2). 13 Our patient cohort was not restricted to prior therapy, the median OS in the training cohort was 12.1 (95% CI 11.0–12.9) months and the validation cohort was 12.3 (95% CI 11.1–13.1), which may be a result of retrospective study differed from prospective studies in factors such as timing of data collection, selection of study participants, differences in diagnostic methods, and the impact of treatment progression. Also, a retrospective study comparing it to regorafenib, listed a median OS of 14.2 months for fruquintinib. 23 There may be several reasons for the discrepancy with the median OS in our study: first, there may be differences in the backline regimens and other drugs combined in some patients between the two studies; in addition, differences in patient demographic characteristics, and the time and place where the study was conducted may have affected the survival results. Our findings are similar to another article mentioned above: the median OS was 12.0 months (95% CI 8.0–16.1). 19
Although we have successfully developed and validated a nomogram to predict the OS of mCRC patients after treatment with fruquintinib, there are some limitations to our study. First, its retrospective design may have led to unavoidable selection bias. Moreover, there were no records of adverse reactions included in the study, as some of the participants did not have detailed documentation of adverse effects experienced. Despite these constraints, the research offers significant insights into the use of fruquintinib for treating mCRC and identifies key prognostic factors linked to patient survival. Subsequently, we will further validate and optimize the performance of the prediction model, including a larger sample size. And explore other predictors and variables to improve the accuracy and applicability of the prediction model. To study the effects of different treatment strategies on the prediction model to guide individualized treatment decisions.
Conclusion
Based on six pre-dose accessible variables, we constructed a prognostic model for mCRC patients treated with fruquintinib and presented a corresponding nomogram. In conclusion, Fruquintinib may be used in patients with low tumor levels (earlier T stage and higher degree of pathologic differentiation), low metastatic capacity (no metastases to sites other than the liver, lungs, lymph nodes, or peritoneum), low tumor burden (low CA199 level), and high BMI.
Supplemental Material
sj-docx-1-tag-10.1177_17562848241284229 – Supplemental material for A nomogram construction and multicenter validation for predicting overall survival after fruquintinib application in patients with metastatic colorectal cancer: a multicenter retrospective study
Supplemental material, sj-docx-1-tag-10.1177_17562848241284229 for A nomogram construction and multicenter validation for predicting overall survival after fruquintinib application in patients with metastatic colorectal cancer: a multicenter retrospective study by Xiao-Xuan Wang, Yu-Wen Zhou, Bo Wang, Peng Cao, De-Yun Luo, Chun-Hong Li, Kai Wang and Meng Qiu in Therapeutic Advances in Gastroenterology
Footnotes
References
Supplementary Material
Please find the following supplemental material available below.
For Open Access articles published under a Creative Commons License, all supplemental material carries the same license as the article it is associated with.
For non-Open Access articles published, all supplemental material carries a non-exclusive license, and permission requests for re-use of supplemental material or any part of supplemental material shall be sent directly to the copyright owner as specified in the copyright notice associated with the article.