
Abstract
Background:
Despite numerous metabolomic studies on ulcerative colitis (UC), the results have been highly variable, making it challenging to identify key metabolic abnormalities in UC.
Objectives:
This study aims to uncover key metabolites and metabolic pathways in UC by analyzing existing metabolomics data.
Design:
A systematic review.
Data sources and methods:
We conducted a comprehensive search in databases (PubMed, Cochrane Library, Embase, and Web of Science) and relevant study references for metabolomic research on UC up to 28 December 2022. Significant metabolite differences between UC patients and controls were identified, followed by an analysis of relevant metabolic pathways.
Results:
This review incorporated 78 studies, identifying 2868 differentially expressed metabolites between UC patients and controls. The metabolites were predominantly from ‘lipids and lipid-like molecules’ and ‘organic acids and derivatives’ superclasses. We found 101 metabolites consistently altered in multiple datasets within the same sample type and 78 metabolites common across different sample types. Of these, 62 metabolites exhibited consistent regulatory trends across various datasets or sample types. Pathway analysis revealed 22 significantly altered metabolic pathways, with 6 pathways being recurrently enriched across different sample types.
Conclusion:
This study elucidates key metabolic characteristics in UC, offering insights into molecular mechanisms and biomarker discovery for the disease. Future research could focus on validating these findings and exploring their clinical applications.
Introduction
Ulcerative colitis (UC) is a chronic inflammatory bowel disease characterized by episodic occurrences of bloody diarrhea, which can lead to considerable disability and a diminished quality of life. 1 Although various theories have been proposed, the exact pathophysiology of UC remains unclear.2–4 Moreover, there is a paucity of reliable diagnostic biomarkers for this disease.
Metabolites, as the end products of gene and protein regulatory networks, participate in diverse physiological and pathological processes. Metabolomics, the comprehensive analysis of small-molecule metabolites, offers a snapshot of an individual’s current physiological state and holds promise for identifying disease-associated metabolic signatures. 5 Over the past two decades, metabolomics has been employed in various disease investigations, including UC.6–8 As early as 2004, Ehehalt et al. 9 reported significant differences in the ratios of phosphatidylcholine species between UC patients and controls in rectal mucus samples. Subsequently, dozens of metabolomics studies have been conducted and revealed metabolic abnormalities in multiple types of samples from UC patients.6,10–12 However, the types and regulatory trends of metabolites associated with UC varied substantially across these studies, which are potentially attributable to variations in sample preparation, analytical techniques, data analysis, and disease states. These inconsistent findings have hindered the clinical application of metabolomics discoveries in UC. Integration of existing metabolomics datasets would facilitate the identification of key metabolic features, thereby providing more robust biological insights into UC than individual studies.
In this study, we conducted a systematic analysis of metabolomics studies related to UC. Initially, we compiled a curated list of metabolites that were significantly differentially expressed between UC patients and controls in prior studies. Then, we investigated the key perturbed metabolites and their associated metabolic pathways in UC. Our objective is to provide a comprehensive overview of the metabolic signatures of UC, thereby advancing both molecular mechanisms and biomarker research for this condition.
Methods
Data collection and curation
The study was conducted and reported in accordance with the Preferred Reporting Items for Systematic Reviews and Meta-Analyses (PRISMA) guidelines. 13 The screening process of relevant studies followed these guidelines, as illustrated in Figure 1. Prior to each phase of the screening process, reviewers underwent training through pilot tests. Subsequently, two reviewers independently performed data collection and curation, with discrepancies resolved through discussion or by consulting a third reviewer.

Flowchart illustrating the screening process for relevant studies.
Search strategy and study selection
Metabolomics studies related to UC were collected from four academic literature databases (PubMed, Cochrane Library, Embase, and Web of Science) using the search terms delineated in Supplemental Table S1, spanning from the inception of these databases to 28 December 2022. To broaden our spectrum, additional pertinent studies were acquired by scrutinizing the reference lists of pertinent studies and reviews. By 28 December 2022, 14,692 citations were identified. The retrieved literature citations were imported into Endnote X9 software (Clarivate Analytics, Philadelphia, PA, USA) to exclude duplicate records, followed by a manual review of the remaining titles and abstracts.
Studies were included if they were original research comparing metabolic alterations between UC patients and controls, employing nuclear magnetic resonance (NMR) or mass spectrometry (MS) metabolomics approaches. The control group consisted of either healthy individuals or non-inflammatory bowel disease (non-IBD) controls. Studies were excluded if they were duplicate reports, focused on animal or cell research, were in preprint status, utilized technologies other than those aforementioned, were other types of reports (e.g. reviews, case reports, or conference abstracts), involved metabolites that did not reach significance, or were not written in English. In addition, studies using non-IBD populations as control groups were excluded if all members of the non-IBD group had a specific disease, such as irritable bowel syndrome, celiac disease, etc.
Applying the aforementioned selection criteria, 1997 potentially eligible articles were identified after reviewing titles and abstracts. From these, 1919 articles were excluded after a full-text review, leaving 78 studies. The reasons for article exclusion are documented in Supplemental Table S2.
Quality assessment of included studies
We evaluated the quality of the studies included in our review using the Agency for Healthcare Research and Quality (AHRQ) checklist, which consists of 11 items. 14 Each item was assessed with ‘Yes’, ‘No’, or ‘Unclear’ responses. We assigned scores of 0 for ‘No’ or ‘Unclear’ responses, and 1 for ‘Yes’ responses. Based on the total scores, we categorized the studies into three quality levels: high (8–11 points), moderate (4–7 points), or low (0–3 points).
Data extraction
Data of interest were manually extracted and entered into a Microsoft Excel spreadsheet from the eligible studies. The recorded information included the study title, first author, date of publication, recruitment area, demographic details, disease activity, sample source, metabolomic platforms, and the respective analytical methodologies. Furthermore, metabolites with significant alterations between UC patients and controls in each study were recorded, along with the direction of metabolite alterations and the statistical methodologies used. Every metabolite exhibiting significant differences between UC patients and controls was exhaustively recorded, regardless of the specific statistical methodologies used in different studies. Such standards for metabolite extraction were adopted due to the considerable variation in statistical methods across various metabolomic studies. To standardize the synonyms of analyzed metabolites, we consulted the Human Metabolome Database (HMDB), PubChem, and Kyoto Encyclopedia of Genes and Genomes (KEGG) databases.
Biological function analysis
To derive deeper insights into the biological functions of the differential metabolites, we executed metabolic pathway enrichment analysis using MetaboAnalyst 5.0. Differentially expressed metabolites were uploaded to MetaboAnalyst, and enrichment analysis was performed following the operational procedures. A pathway was deemed significantly enriched with a false discovery rate (FDR) p value <0.05. Here, the p value indicates the probability that the association between the uploaded molecules and a predefined biological pathway occurred by chance.
Results
Characteristics of the included studies
Based on the data selection criteria, 78 metabolomics studies were included in the final analysis (delineated in Supplemental Table S3). These studies encompassed 4223 UC patients and 4181 controls and were predominantly conducted in Europe over the past 8 years [Figure 2(a) and (b)]. The majority of studies (n = 61) utilized MS platforms, 16 adopted NMR, and one study utilized both platforms. Notably, there has been an increasing trend in the utilization of MS platforms over the past decade (Figure 2(b)). With regard to analytical methodologies, 44 studies employed untargeted metabolomic analysis, 30 adopted targeted analysis, and 4 studies utilized both targeted and untargeted methods. According to the AHRQ checklist, out of these 78 studies, 13 were categorized as high quality, 64 as moderate quality, and 1 as low quality, as detailed in Supplemental Table S4.
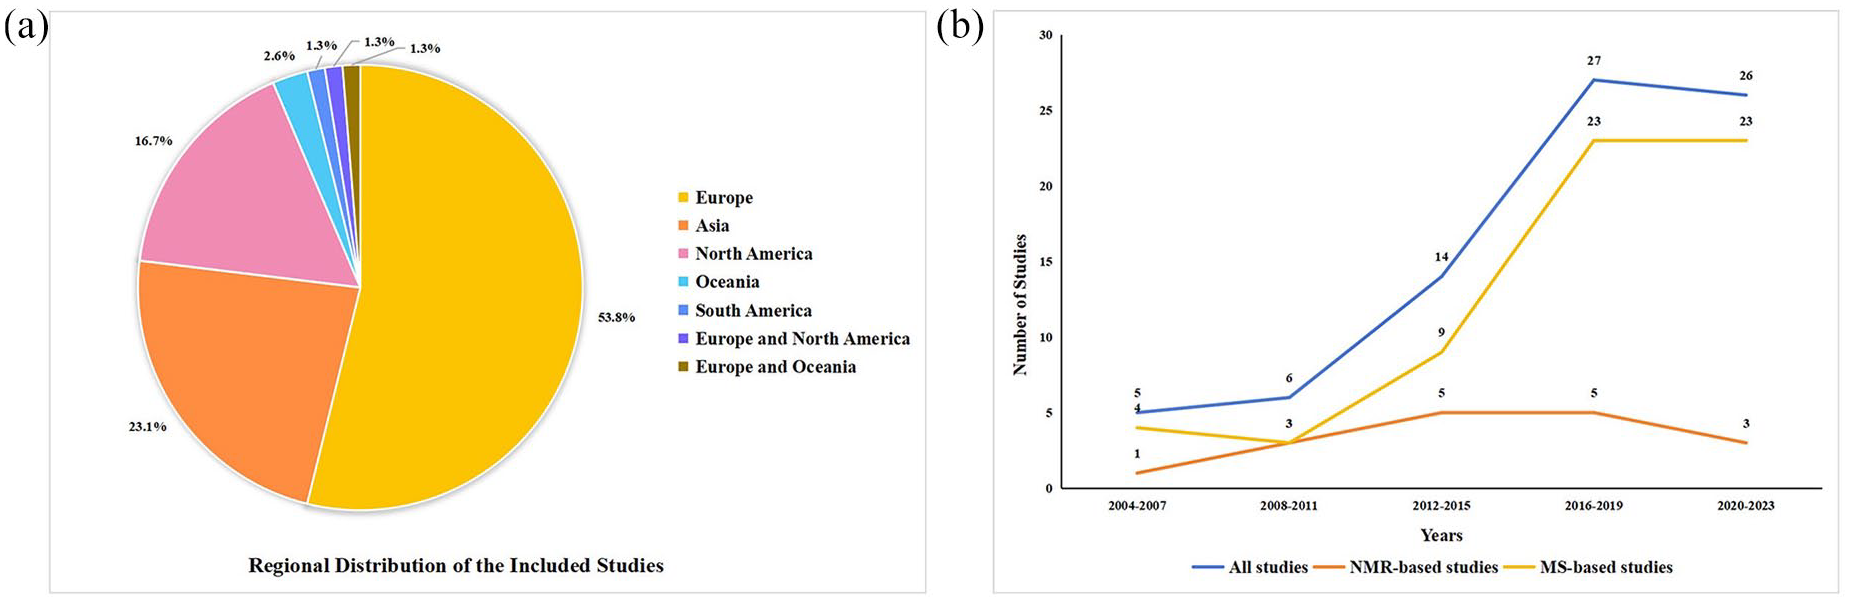
Distribution and trend of the included studies. (a) Pie chart illustrating the regional distribution of the included studies. The segments represent the percentage of studies from various regions. (b) Line graph depicting the number of studies conducted over different time periods. The blue line represents all studies, the yellow line represents MS-based studies, and the orange line represents NMR-based studies. The x-axis represents years grouped in intervals, while the y-axis represents the number of studies.
A total of 2868 differential metabolite entries were collected from the selected studies. The detailed information on these metabolites is summarized in Supplemental Table S5. These metabolites were extracted from nine different biological sample types (Figure 3). Blood and fecal samples were the most commonly utilized, followed by colonic mucosa and urine. Only a limited number of metabolites (n = 26) was detected in the remaining five sample types, which include breast milk, exhaled breath, luminal washes from the duodenum, luminal washes from the terminal ileum, and rectal mucus. Notably, two studies employed two sample types: one used both blood and urine, while another utilized both blood and fecal samples.

Distribution of metabolite entries across various sample types.
Colon metabolomic studies in UC
A total of 11 colon metabolomic studies were included in this analysis, comprising 341 patients with UC and 218 controls. These studies identified 322 metabolite entries exhibiting significant differences in colonic mucosa between the two groups. After the removal of duplicates, 258 unique metabolites were retained. Of these, 242 (93.8%) were reported in a single study, 15 (5.8%) appeared in two studies, and 1 metabolite (0.4%) was cited across three studies.
These unique metabolites were categorized by superclasses according to HMDB [Figure 4(a); Supplemental Table S6]. The majority belonged to four superclasses: lipids and lipid-like molecules, organic acids and derivatives, organic oxygen compounds, and organoheterocyclic compounds.

Metabolite classification and metabolic pathway enrichment in colonic mucosa. (a) Superclass distribution of metabolites in colonic mucosa. Each segment represents the percentage of metabolites classified into different superclasses. (b) Overview of the top 25 enriched metabolite sets in colonic mucosa. Each dot corresponds to a specific metabolic pathway. The color of each dot indicates its p value, while the size represents the enrichment ratio.
To extract meaningful insights from the data, metabolic pathway analysis was conducted using MetaboAnalyst 5.0. Six metabolic pathways were found to be significantly altered (FDR p < 0.05), namely ‘aminoacyl-tRNA biosynthesis’, ‘arginine biosynthesis’, ‘alanine, aspartate, and glutamate metabolism’, ‘biosynthesis of unsaturated fatty acids’, ‘valine, leucine, and isoleucine biosynthesis’, and ‘pantothenate and CoA biosynthesis’ [Figure 4(b); Supplemental Table S7].
Fecal metabolomic studies in UC
The analysis encompassed 26 fecal metabolomic studies, involving 1225 UC patients and 958 controls. A total of 1331 fecal metabolites exhibited significant differences between UC and control groups. After eliminating duplicate entries, 995 unique metabolites remained. Of these, 819 (82.3%) were reported in a single study, 118 (11.9%) in two studies, and 58 metabolites (5.8%) in three or more studies.
These unique metabolites were classified into 13 superclasses based on HMDB taxonomy [Figure 5(a); Supplemental Table S6]. The predominant subclasses were lipids and lipid-like molecules, organic acids and derivatives, organoheterocyclic compounds, and organic oxygen compounds.

Metabolite classification and metabolic pathway enrichment in feces. (a) Superclass distribution of metabolites in feces. Each segment represents the percentage of metabolites classified into different superclasses. (b) Overview of the top 25 enriched metabolite sets in feces. Each dot corresponds to a specific metabolic pathway. The color of each dot indicates its p value, while the size represents the enrichment ratio.
Subsequently, metabolic pathway analysis identified 11 significantly altered pathways [FDR p < 0.05; Figure 5(b); Supplemental Table S7]. The top-ranking pathways were ‘aminoacyl-tRNA biosynthesis’, ‘histidine metabolism’, ‘alanine, aspartate, and glutamate metabolism’, and ‘arginine biosynthesis’.
Blood metabolomic studies in UC
In all, 31 blood metabolomic studies were investigated, encompassing 1913 patients with UC and 2265 controls. A total of 1131 blood metabolites displayed significant differences between UC patients and control groups. Following deduplication, 693 unique metabolites remained. Specifically, 575 (82.9%) were mentioned solely in one study, 78 (11.3%) in two studies, and 40 (5.8%) in three or more studies.
These unique metabolites belonged to 13 superclasses according to HMDB taxonomy [Figure 6(a); Supplemental Table S6]. The top four subclasses were lipids and lipid-like molecules, organic acids and derivatives, organoheterocyclic compounds, and organic oxygen compounds.

Metabolite classification and metabolic pathway enrichment in blood. (a) Superclass distribution of metabolites in blood. Each segment represents the percentage of metabolites classified into different superclasses. (b) Overview of the top 25 enriched metabolite sets in blood. Each dot corresponds to a specific metabolic pathway. The color of each dot indicates its p value, while the size represents the enrichment ratio.
Metabolic pathway analysis unveiled 15 significantly altered pathways (FDR p < 0.05), with the top-ranked pathways being ‘arginine biosynthesis’, ‘aminoacyl-tRNA biosynthesis’, ‘alanine, aspartate, and glutamate metabolism’, and ‘arginine and proline metabolism’ [Figure 6(b); Supplemental Table S7].
Urinary metabolomic studies in UC
In urinary metabolomic studies focusing on UC, our analysis included five studies, collectively encompassing 527 patients with UC and 446 controls. A total of 58 urinary metabolites demonstrated statistically significant differences between UC and control groups. After eliminating duplicate entries, 41 unique metabolites were identified. Among these, 32 (78.0%) were documented in a single study, 7 (17.1%) in two studies, and 2 metabolites (4.9%) in three or more studies.
These unique metabolites were categorized into seven superclasses according to the HMDB taxonomy [Figure 7(a); Supplemental Table S6]. The four most prevalent superclasses were organic acids and derivatives, lipids and lipid-like molecules, benzenoids, and organic oxygen compounds.

Metabolite classification and metabolic pathway enrichment in urine. (a) Superclass distribution of metabolites in urine. Each segment represents the percentage of metabolites classified into different superclasses. (b) Overview of the top 25 enriched metabolite sets in urine. Each dot corresponds to a specific metabolic pathway. The color of each dot indicates its p value, while the size represents the enrichment ratio.
Subsequent metabolic pathway analysis identified eight pathways as significantly altered (FDR p < 0.05), with the highest-ranked pathways being ‘glyoxylate and dicarboxylate metabolism’, ‘glycine, serine, and threonine metabolism’, ‘aminoacyl-tRNA biosynthesis’, and ‘valine, leucine, and isoleucine biosynthesis’ [Figure 7(b); Supplemental Table S7].
Other metabolomic studies at UC
Seven metabolomic studies were conducted on other five biological sample types, involving 217 patients with UC and 294 controls. In these studies, 26 metabolite entries demonstrated significant differences between the two groups. After duplicate removal, 25 unique metabolites were retained. Of these, 24 (96.0%) were reported in a single study, while 1 (4.0%) was observed in two studies.
According to the HMDB taxonomy, these unique metabolites belonged to six superclasses [Figure 8(a); Supplemental Table S6]. The most frequently occurring superclasses were organic acids and derivatives, lipids and lipid-like molecules, organic oxygen compounds, and homogeneous non-metal compounds.

Metabolite classification and metabolic pathway enrichment in other samples. (a) Superclass distribution of metabolites in other samples. Each segment represents the percentage of metabolites classified into different superclasses. (b) Overview of the top 25 enriched metabolite sets in other samples. Each dot corresponds to a specific metabolic pathway. The color of each dot indicates its p value, while the size represents the enrichment ratio.
Metabolic pathway analysis identified six metabolic pathways with significant alterations [FDR p < 0.05; Figure 8(b); Supplemental Table S7]. The most prominent metabolic pathways included ‘arginine biosynthesis’, ‘aminoacyl-tRNA biosynthesis’, ‘alanine, aspartate, and glutamate metabolism’, and ‘histidine metabolism’.
Variation and correlation of metabolites among different sample types
In metabolomics studies, thousands of metabolites were differentially expressed between UC patients and controls. The type and quantity of these differential metabolites varied considerably across different sample types [Figure 9(a)]. Despite this heterogeneity, patterns of metabolite alterations exhibited partial consistency across these sample types.
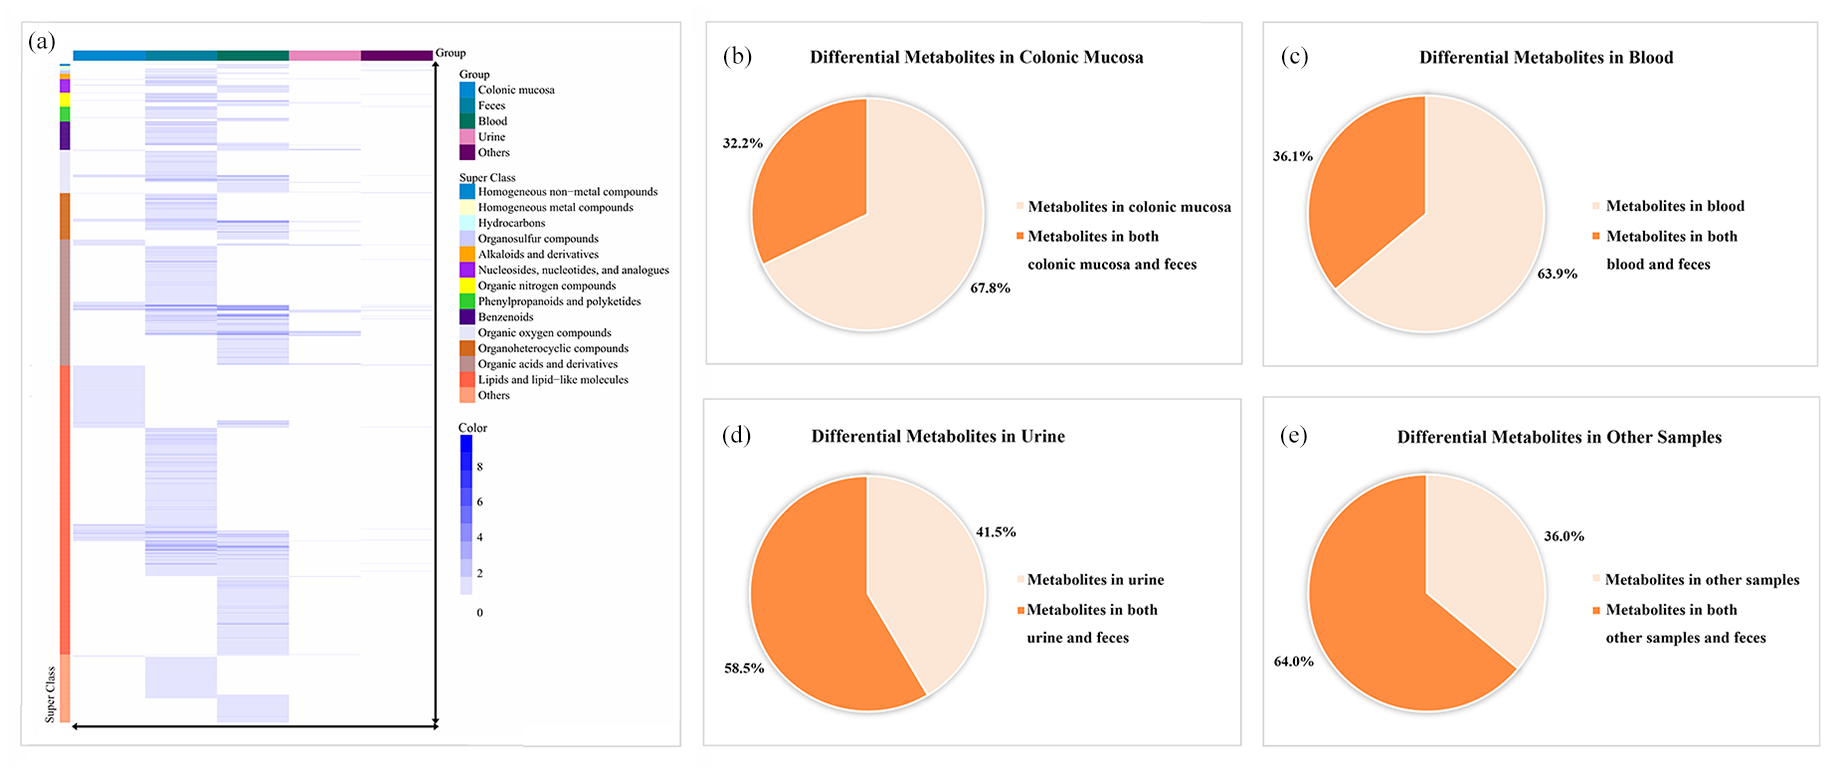
Variation and correlation of metabolites among different sample types. (a) Heat map of differential metabolites across various sample types. Columns represent different sample types: colonic mucosa, feces, blood, urine, and others. Rows correspond to specific differential metabolites, with colors indicating their superclasses. The same color represents a specific superclass. The color scale on the right indicates metabolite report frequency in metabolomic studies. (b–e) Distribution of differential metabolites across different sample types: colonic mucosa (b), blood (c), urine (d), and other samples (e). The pie charts depict the proportions of metabolites: those exclusive to a specific sample (represented by light shade) and those also found in feces (represented by dark shade).
First, according to the HMDB superclass classification, the majority of metabolites were classified into two predominant superclasses in each sample type: lipids and lipid-like molecules, and organic acids and derivatives. These superclasses collectively constituted between 58.1% and 89.5% of the total metabolites across various sample types, suggesting their potential significance in UC pathogenesis.
Second, our study revealed a notable overlap of differential metabolites across multiple sample types. For instance, 83 of 258 (32.2%) differential metabolites in colonic mucosa were also significantly altered in fecal samples [Figure 9(b)]. Likewise, 250 of 693 (36.1%) metabolites in blood, 24 of 41 (58.5%) metabolites in urine, and 16 of 25 (64.0%) metabolites in other sample types exhibited significant changes in fecal samples [Figure 9(c)–(e)]. These data highlight the inherent interrelationships among metabolites across various samples.
In total, 1601 unique metabolites were identified across all samples after eliminating duplicate entries (Supplemental Table S6). Of these, 101 metabolites (6.3%) showed significant alterations in three or more datasets within a given sample type, and 78 metabolites (4.9%) were present in at least three different sample types (Supplemental Tables S8 and S9). These metabolites with significant alterations across multiple independent datasets may serve as key indicators in UC pathology.
Notably, our study found that 62 metabolites exhibited consistent regulatory trends across multiple datasets. Specifically, of the metabolites showing significant alterations in at least three different datasets within a given sample type, 25 were consistently upregulated and 30 were consistently downregulated in UC compared to controls (Supplemental Table S8). Among metabolites with significant changes in three or more different sample types, three were consistently upregulated, while four were consistently downregulated in UC compared to controls (Supplemental Table S9). These metabolites may be promising diagnostic biomarker candidates for UC.
Variation and correlation of metabolic pathways among different sample types
In this study, we observed a significant enrichment of multiple metabolic pathways in UC across various sample types. Although the categories of enriched metabolic pathways varied among the sample types, considerable overlap existed. Specifically, 5 of 6 (83.3%) enriched pathways in colonic mucosa, 7 of 15 (46.7%) pathways in blood, 5 of 8 (62.5%) pathways in urine, and 4 of 6 (66.7%) pathways in other sample types also exhibited significant alterations in fecal samples [Figure 10(a)–(d)]. These findings highlight the intrinsic interconnectedness of metabolic pathways across different sample types.
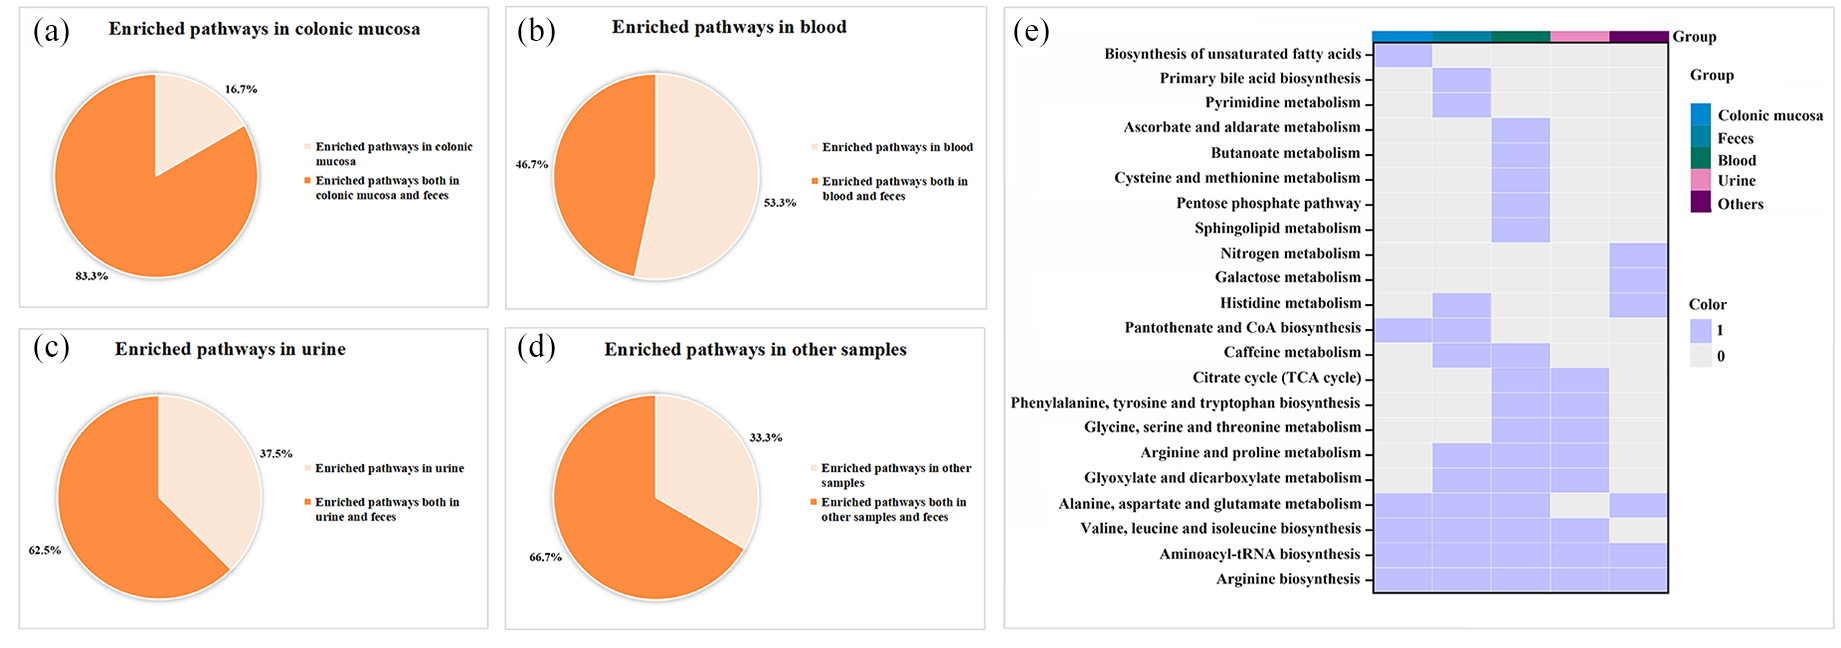
Variation and correlation of metabolic pathways among different sample types. (a–d) Distribution of enriched metabolic pathways across different sample types: colonic mucosa (a), blood (b), urine (c), and other samples (d). The pie charts describe the proportions of metabolic pathways that are enriched exclusively in a specific sample type (light shade) versus those enriched in both the sample type and feces (dark shade). (e) Heatmap illustrating various metabolic pathways and their enrichment in different sample types: colonic mucosa, feces, blood, urine, and others. Colors, blue for ‘1’ and gray for ‘0’, indicate the presence or absence of pathway enrichment in the respective samples.
Finally, 22 unique metabolic pathways were enriched across these sample types [Figure 10(e)]. Of these, 10 pathways (45.5%) were specifically enriched in a single sample type, while 6 pathways (27.3%) were enriched in two sample types. Noteworthily, another six pathways (27.3%), including ‘alanine, aspartate, and glutamate metabolism’, ‘aminoacyl-tRNA biosynthesis’, ‘arginine biosynthesis’, ‘valine, leucine, and isoleucine biosynthesis’, ‘arginine and proline metabolism’, and ‘glyoxylate and dicarboxylate metabolism’, were enriched in at least three different sample types (Supplemental Table S10). This suggests their potential significance in the pathogenesis of UC. To elucidate the interrelationships among the differential metabolites implicated in these six pivotal pathways, we integrated them into a simplified pathway diagram (Figure 11).
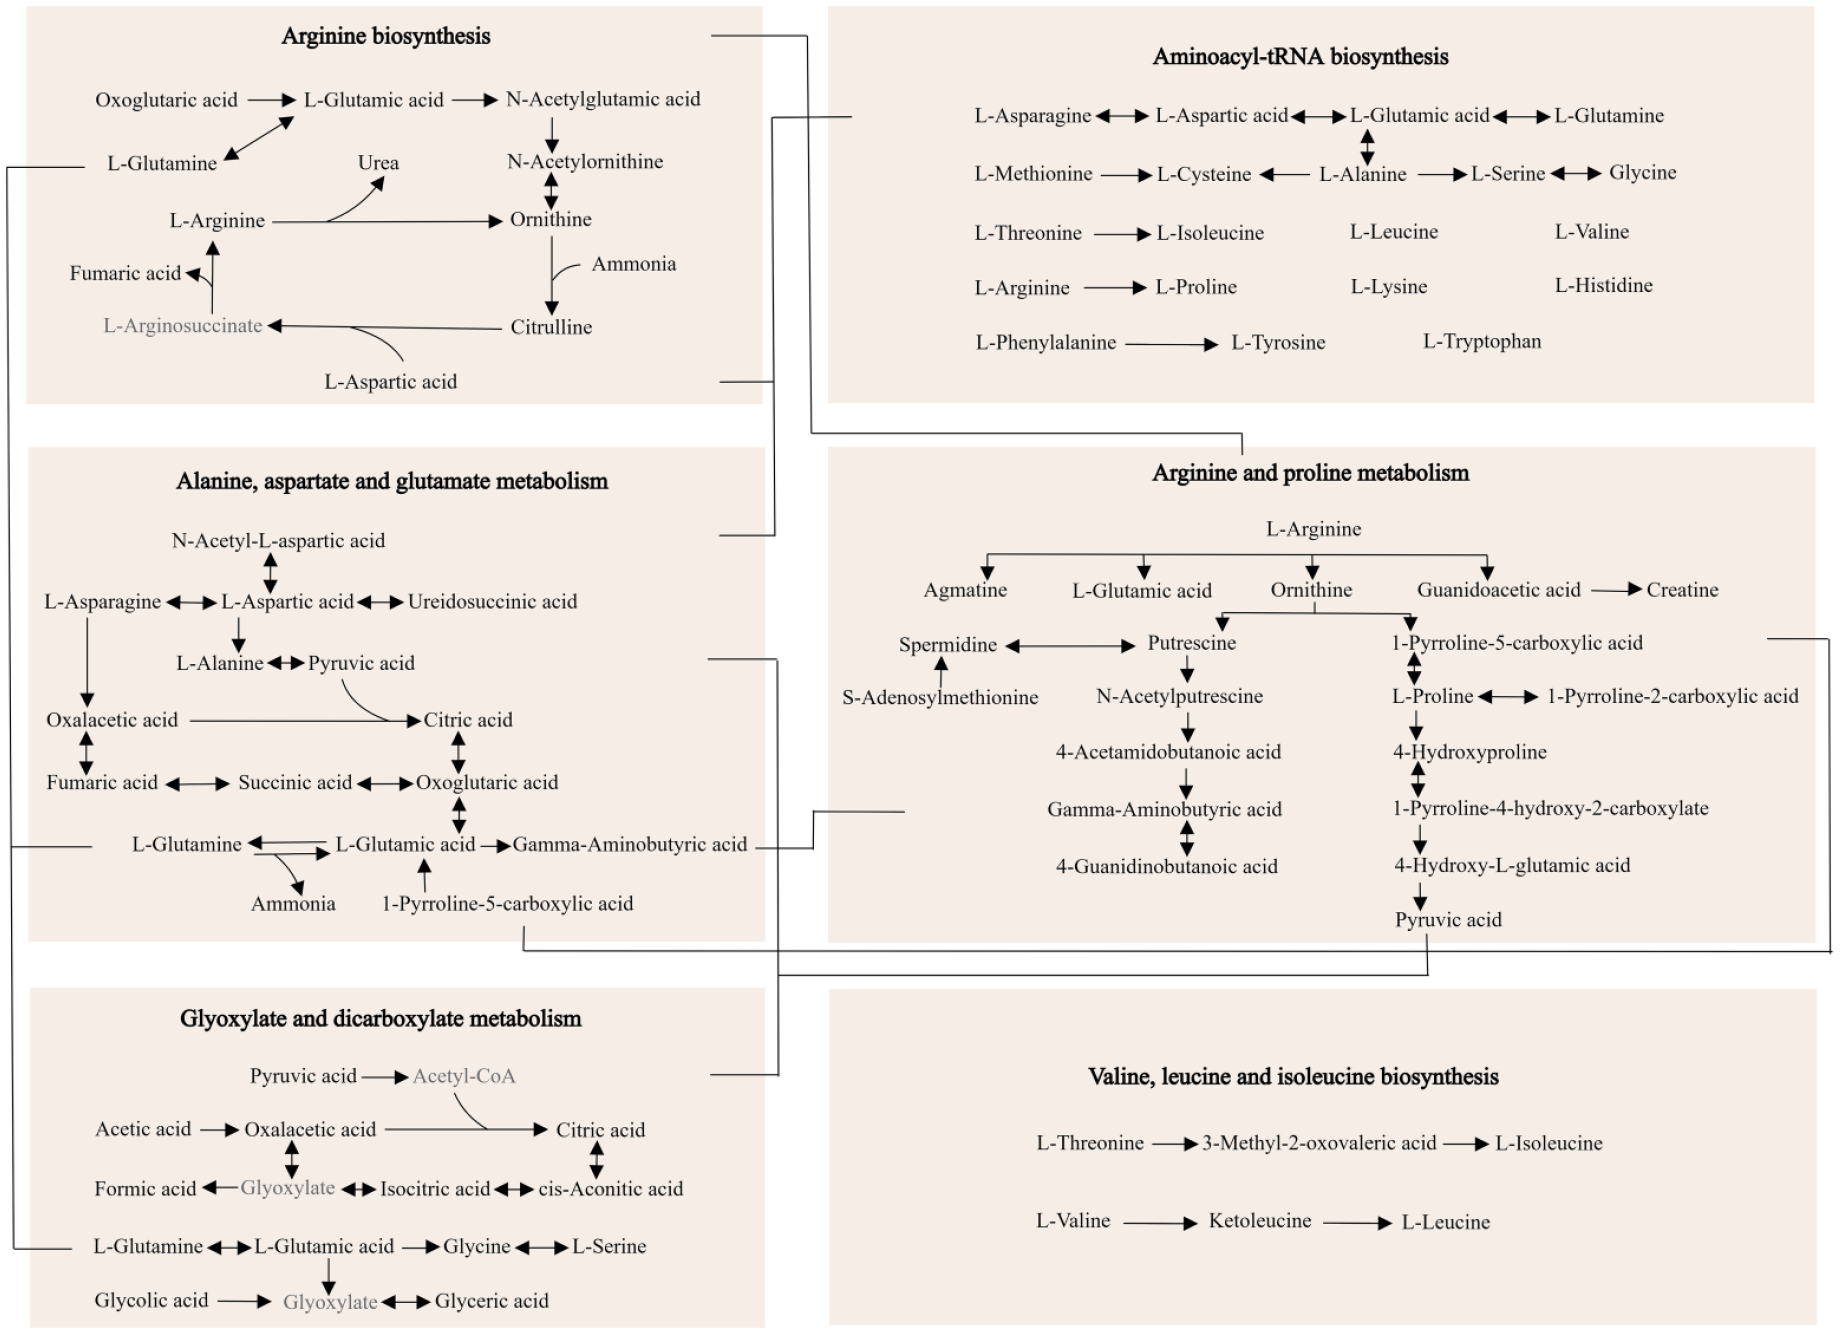
A schematic diagram depicts six metabolic pathways enriched in at least three sample types. Metabolites in black font exhibit significant differences between UC and control groups in previous metabolomics studies, while those in gray font have not been reported to exhibit such differences in prior metabolomics articles. The connecting lines between different pathways link the important metabolites between them.
Discussion
In this study, we comprehensively reviewed metabolomic studies on UC and extracted 2868 differential metabolite entries. The results of these studies varied widely; however, 179 metabolites exhibited consistent differential changes in UC compared to controls across multiple independent datasets. These pivotal metabolites potentially play a crucial role in UC pathogenesis and could serve as promising diagnostic biomarkers. Furthermore, we discerned several general characteristics in these metabolomic studies. The differential metabolites predominantly belonged to the superclasses ‘lipids and lipid-like molecules’ and ‘organic acids and derivatives’. In addition, specific metabolic features, such as differential metabolites and enriched metabolic pathways, partially overlapped among different sample types. Importantly, six metabolic pathways were disrupted across multiple sample types, indicating their potential importance in UC pathogenesis.
In our study, arginine biosynthesis and metabolism were the primary enriched metabolic pathways across all sample types. Most metabolites within these pathways also demonstrated notable differences between UC patients and controls in multiple independent datasets. This underscores the potentially critical role of arginine biosynthesis and metabolism in UC, corroborated by numerous prior studies. Previous metabolomic studies have found that
Leucine, isoleucine, and valine, known as branched-chain amino acids (BCAAs), are primarily obtained from the diet. Previous metabolomic studies frequently reported significant differences in the levels of these BCAAs between UC patients and controls, potentially attributable to malnutrition, altered gut microbiota, or increased metabolic demands during inflammation.32,33 Furthermore, the levels of leucine, isoleucine, and valine correlated with disease severity in UC patients.6,34–36 Animal model studies also unveiled the capability of BCAAs to modulate intestinal inflammation. For instance, leucine can trigger immune responses and exacerbate experimental colitis, potentially due to its ability to promote Th1/Th17 cell differentiation, M1 macrophage polarization, increase pro-inflammatory cytokine production, and elevate oxidative stress.37–39 Conversely, leucine also stimulates cell proliferation and migration, strengthens the intestinal barrier, prevents the translocation of bacterial products, and thereby exhibits anti-inflammatory properties. 40 Isoleucine, another BCAA, has been shown to ameliorate symptoms of colitis and intestinal inflammation. 41 Specifically, isoleucine induces the expression of antimicrobial peptides, downregulates the ratio of dendritic cells, monocytes, and macrophages, and reduces pro-inflammatory cytokine expression, modulating both intestinal innate and adaptive immune functions.42,43 Moreover, isoleucine can inhibit enterocyte apoptosis, regulate gene expression associated with enterocyte tight junctions, and preserve intestinal barrier integrity.41,43 These findings suggest that BCAAs may play a pivotal role in UC pathogenesis and offer potential therapeutic avenues.
In our study, alanine, aspartate, and glutamate metabolism pathways were found to be disrupted in UC across multiple sample types. Alanine, aspartate, and glutamate play pivotal roles in various metabolic processes, especially energy metabolism.44–46 They can be converted into pyruvic acid, oxalacetic acid, and oxoglutaric acid, which subsequently enter the tricarboxylic acid cycle to produce adenosine triphosphate (ATP), the primary energy source for the human body. An adequate energy supply is vital for functions such as colonic epithelial cell proliferation and differentiation, maintenance of the intestinal barrier, immune homeostasis, and overall intestinal health.47–50 Past metabolomic studies have shown notable differences in alanine, aspartate, glutamate, and intermediate metabolites of the tricarboxylic acid cycle (including citric acid, oxoglutaric acid, succinic acid, fumaric acid, and oxalacetic acid) between UC patients and healthy controls.6,51–53 This suggests potential abnormalities in energy metabolism among UC patients. Moreover, the levels of oxoglutaric acid, succinic acid, fumaric acid, and oxalacetic acid were often lower in UC patients than in healthy controls, indicating an energy deficiency in UC.12,51–54 Consistent with our findings, previous literature has reported that ATP levels were diminished in chemically induced colitis models, but they were restored upon recovery.
55
Besides, 13 genes regulating ATP production were found to be significantly reduced in the rectum of UC patients.
56
Indicators of ATP production capacity, such as mitochondrial electron transport chain complex I activity, mitochondrial membrane potential, and the pyridine nucleotide adenosine diphosphate/nicotinamide ratio, also declined in UC patients.55–58 Elevated
While there have been several systematic reviews published on UC metabolomics, most have concentrated on specific aspects such as particular sample types, metabolite classes, or patient groups.61–71 Only a handful of these reviews have aimed to provide a broader overview of metabolomic studies in UC, with the most recent data extending up to October 2022.72–75 These studies have offered valuable insights into the metabolomic profiles associated with UC. Building on these foundational works, our study extends this knowledge base with several distinct advantages. First, our analysis is more comprehensive, covering a broader spectrum of studies up to 28 December 2022. This allows for a more current understanding of the metabolomic landscape in UC, ensuring that our insights are grounded in the latest research. Second, unlike previous reviews which may have focused on specific sample types or metabolite classes, our review encompasses all study types, metabolite categories, and patient groups. This inclusive approach has enabled us to identify and analyze a wider range of differential metabolites, providing a more holistic view of the metabolic alterations in UC. Third, our systematic review goes beyond merely listing differential metabolites by also examining their frequency of occurrence and trends across multiple datasets and sample types. This comprehensive analysis has revealed core metabolites consistently associated with UC, enhancing our understanding of the disease’s metabolic signature. Finally, our in-depth metabolic pathway analysis, facilitated by advanced tools like MetaboAnalyst, has allowed us to identify key disrupted pathways across various sample types, shedding light on the underlying pathophysiological mechanisms of UC. These strengths highlight the unique contributions of our systematic review to the existing literature, providing valuable insights for future research and potential clinical applications in UC.
This study has several limitations. First, we did not analyze the relationship between metabolites and specific clinical variables such as gender, age, disease activity index, disease location, and medication status. This was primarily because many studies did not provide raw metabolite data or comprehensive clinical details of the participants. Future clinical studies should investigate the effects of these clinical variables on metabolites associated with UC. Second, we only included studies that utilized MS-based or NMR-based techniques due to their superior sensitivity, accuracy, and broader detection spectrum compared to other techniques. However, such a selection criterion might result in the omission of some important information relevant to UC. Broadening the inclusion criteria to encompass all metabolomics techniques could provide novel insights into UC research. Third, this study is an integration of prior research findings. Future investigations should validate the causative associations between key metabolites or metabolic pathways and UC. Lastly, this study was not registered with PROSPERO. In our future research, we are committed to taking this important step to enhance transparency and traceability.
Conclusion
In conclusion, we conducted a comprehensive analysis of metabolomics studies focused on UC. Although there were distinct variations in the results of individual studies, consistent metabolic patterns were discernible. Specifically, 179 metabolites were differentially expressed in UC compared to controls across multiple independent datasets. Of these, 62 metabolites exhibited consistent regulatory trends. Moreover, six metabolic pathways were recurrently disrupted across various sample types. These key metabolites and metabolic pathways could further elucidate the molecular mechanisms of UC and aid in biomarker research.
Supplemental Material
sj-docx-1-tag-10.1177_17562848241239580 – Supplemental material for Systematic review of metabolomic alterations in ulcerative colitis: unveiling key metabolic signatures and pathways
Supplemental material, sj-docx-1-tag-10.1177_17562848241239580 for Systematic review of metabolomic alterations in ulcerative colitis: unveiling key metabolic signatures and pathways by Meiling Liu, Siyi Guo and Liang Wang in Therapeutic Advances in Gastroenterology
Supplemental Material
sj-docx-10-tag-10.1177_17562848241239580 – Supplemental material for Systematic review of metabolomic alterations in ulcerative colitis: unveiling key metabolic signatures and pathways
Supplemental material, sj-docx-10-tag-10.1177_17562848241239580 for Systematic review of metabolomic alterations in ulcerative colitis: unveiling key metabolic signatures and pathways by Meiling Liu, Siyi Guo and Liang Wang in Therapeutic Advances in Gastroenterology
Supplemental Material
sj-docx-11-tag-10.1177_17562848241239580 – Supplemental material for Systematic review of metabolomic alterations in ulcerative colitis: unveiling key metabolic signatures and pathways
Supplemental material, sj-docx-11-tag-10.1177_17562848241239580 for Systematic review of metabolomic alterations in ulcerative colitis: unveiling key metabolic signatures and pathways by Meiling Liu, Siyi Guo and Liang Wang in Therapeutic Advances in Gastroenterology
Supplemental Material
sj-docx-3-tag-10.1177_17562848241239580 – Supplemental material for Systematic review of metabolomic alterations in ulcerative colitis: unveiling key metabolic signatures and pathways
Supplemental material, sj-docx-3-tag-10.1177_17562848241239580 for Systematic review of metabolomic alterations in ulcerative colitis: unveiling key metabolic signatures and pathways by Meiling Liu, Siyi Guo and Liang Wang in Therapeutic Advances in Gastroenterology
Supplemental Material
sj-docx-4-tag-10.1177_17562848241239580 – Supplemental material for Systematic review of metabolomic alterations in ulcerative colitis: unveiling key metabolic signatures and pathways
Supplemental material, sj-docx-4-tag-10.1177_17562848241239580 for Systematic review of metabolomic alterations in ulcerative colitis: unveiling key metabolic signatures and pathways by Meiling Liu, Siyi Guo and Liang Wang in Therapeutic Advances in Gastroenterology
Supplemental Material
sj-docx-7-tag-10.1177_17562848241239580 – Supplemental material for Systematic review of metabolomic alterations in ulcerative colitis: unveiling key metabolic signatures and pathways
Supplemental material, sj-docx-7-tag-10.1177_17562848241239580 for Systematic review of metabolomic alterations in ulcerative colitis: unveiling key metabolic signatures and pathways by Meiling Liu, Siyi Guo and Liang Wang in Therapeutic Advances in Gastroenterology
Supplemental Material
sj-docx-8-tag-10.1177_17562848241239580 – Supplemental material for Systematic review of metabolomic alterations in ulcerative colitis: unveiling key metabolic signatures and pathways
Supplemental material, sj-docx-8-tag-10.1177_17562848241239580 for Systematic review of metabolomic alterations in ulcerative colitis: unveiling key metabolic signatures and pathways by Meiling Liu, Siyi Guo and Liang Wang in Therapeutic Advances in Gastroenterology
Supplemental Material
sj-docx-9-tag-10.1177_17562848241239580 – Supplemental material for Systematic review of metabolomic alterations in ulcerative colitis: unveiling key metabolic signatures and pathways
Supplemental material, sj-docx-9-tag-10.1177_17562848241239580 for Systematic review of metabolomic alterations in ulcerative colitis: unveiling key metabolic signatures and pathways by Meiling Liu, Siyi Guo and Liang Wang in Therapeutic Advances in Gastroenterology
Supplemental Material
sj-xls-2-tag-10.1177_17562848241239580 – Supplemental material for Systematic review of metabolomic alterations in ulcerative colitis: unveiling key metabolic signatures and pathways
Supplemental material, sj-xls-2-tag-10.1177_17562848241239580 for Systematic review of metabolomic alterations in ulcerative colitis: unveiling key metabolic signatures and pathways by Meiling Liu, Siyi Guo and Liang Wang in Therapeutic Advances in Gastroenterology
Supplemental Material
sj-xls-5-tag-10.1177_17562848241239580 – Supplemental material for Systematic review of metabolomic alterations in ulcerative colitis: unveiling key metabolic signatures and pathways
Supplemental material, sj-xls-5-tag-10.1177_17562848241239580 for Systematic review of metabolomic alterations in ulcerative colitis: unveiling key metabolic signatures and pathways by Meiling Liu, Siyi Guo and Liang Wang in Therapeutic Advances in Gastroenterology
Supplemental Material
sj-xls-6-tag-10.1177_17562848241239580 – Supplemental material for Systematic review of metabolomic alterations in ulcerative colitis: unveiling key metabolic signatures and pathways
Supplemental material, sj-xls-6-tag-10.1177_17562848241239580 for Systematic review of metabolomic alterations in ulcerative colitis: unveiling key metabolic signatures and pathways by Meiling Liu, Siyi Guo and Liang Wang in Therapeutic Advances in Gastroenterology
Footnotes
References
Supplementary Material
Please find the following supplemental material available below.
For Open Access articles published under a Creative Commons License, all supplemental material carries the same license as the article it is associated with.
For non-Open Access articles published, all supplemental material carries a non-exclusive license, and permission requests for re-use of supplemental material or any part of supplemental material shall be sent directly to the copyright owner as specified in the copyright notice associated with the article.