
Abstract
Background:
Therapeutic targets for ulcerative colitis (UC) and prediction models of antitumor necrosis factor (TNF) therapy outcomes have not been fully reported.
Objective:
Investigate the characteristic metabolite and lipid profiles of fecal samples of UC patients before and after adalimumab treatment and develop a prediction model of clinical remission following adalimumab treatment.
Design:
Prospective, observational, multicenter study was conducted on moderate-to-severe UC patients (n = 116).
Methods:
Fecal samples were collected from UC patients at 8 and 56 weeks of adalimumab treatment and from healthy controls (HC, n = 37). Clinical remission was assessed using the Mayo score. Metabolomic and lipidomic analyses were performed using gas chromatography mass spectrometry and nano electrospray ionization mass spectrometry, respectively. Orthogonal partial least squares discriminant analysis was performed to establish a remission prediction model.
Results:
Fecal metabolites in UC patients markedly differed from those in HC at baseline and were changed similarly to those in HC during treatment; however, lipid profiles did not show these patterns. After treatment, the fecal characteristics of remitters (RM) were closer to those of HC than to those of non-remitters (NRM). At 8 and 56 weeks, amino acid levels in RM were lower than those in NRM and similar to those in HC. After 56 weeks, levels of 3-hydroxybutyrate, lysine, and phenethylamine decreased, and dodecanoate level increased in RM similarly to those in HC. The prediction model of long-term remission in male patients based on lipid biomarkers showed a higher performance than clinical markers.
Conclusion:
Fecal metabolites in UC patients markedly differ from those in HC, and the levels in RM are changed similarly to those in HC after anti-TNF therapy. Moreover, 3-hydroxybutyrate, lysine, phenethylamine, and dodecanoate are suggested as potential therapeutic targets for UC. A prediction model of long-term remission based on lipid biomarkers may help implement personalized treatment.
Introduction
Ulcerative colitis (UC), a type of chronic inflammatory bowel disease (IBD), is characterized by prolonged inflammation and ulceration in the mucosa and submucosa of the colon and rectum. 1 Several studies have suggested that the gut microbiota and its metabolites can affect the development and progression of IBD.2–5 Metabolic alterations [such as those in bile acids and short-chain fatty acids (SCFA)] have been identified in biofluids of patients with UC and Crohn’s disease (CD) in many studies and may provide novel therapeutic solutions.6,7 Fecal samples can serve as reliable and practical sources to determine the composition of metabolites derived from the gut microbiota.
Various biologics targeting tumor necrosis factor (TNF)-α, including adalimumab, have been widely used in patients with moderately to severely active UC by inducing and maintaining remission. 8 However, only 16.5% and 17.3% of patients with UC were found to exhibit clinical remission following anti-TNF (adalimumab) treatment at 8 and 52 weeks, respectively. 8 Age, weight, disease duration/severity/phenotype, early clinical response, baseline fecal calprotectin (FC) levels, and C-reactive protein (CRP) levels have been suggested as prognostic indicators that can predict the efficacy of anti-TNF therapy in patients with IBD.9,10 However, specific biomarkers for patients with IBD have not been reported yet.
Several studies have investigated alterations in gut microbial compositions and fecal metabolite profiles before and after anti-TNF therapy using metagenomic and metabolomic approaches.6,11–13 In patients with UC and CD, the fecal microbiota diversity (α-diversity) did not differ between remitters (RM) and non-remitters (NRM) after anti-TNF therapy (adalimumab, infliximab, and certolizumab). 11 In pediatric patients with CD, different fecal metabolite profiles were noted between sustained responders and non-sustained responders following infliximab therapy with sustained responders exhibiting higher levels of fecal amino acids at baseline. 6 Metabolic biomarkers related to lipid, bile acid, and amino acid pathways have been reported to be predictors of response to anti-TNF therapy (adalimumab or infliximab) in patients with CD. 12 However, most previous studies have not handled time-dependent metabolic changes at various time points for ⩾1 year during treatment. Furthermore, therapeutic target compounds and prediction models relevant to anti-TNF therapy outcomes have not been fully investigated.
Our study aimed to assess the characteristic metabolite and lipid profiles of fecal samples of patients with UC before and after adalimumab treatment. Longitudinal observations of fecal metabolite and lipid profiles at various time points were conducted using gas chromatography mass spectrometry (GC-MS) and nano electrospray ionization mass spectrometry (nano-ESI-MS). Changes in metabolites and lipids in patients exhibiting clinical remission following adalimumab treatment and potential novel therapeutic targets were explored. Furthermore, novel predictive biomarkers and prediction models of clinical remission following adalimumab treatment were developed using development datasets.
Methods
Patients and study design
This prospective, observational multicenter study was conducted at 17 academic hospitals in Korea from June 2015 to September 2018, and patients with UC (n = 146) who were aged >18 years were recruited. Of the total 146 patients with UC recruited, 116 patients were included in the final analysis because of the availability of fecal samples. Compared with our previous clinical research on the same patients, 14 this study included fewer fecal samples because of the limited sample amount. However, this may not affect the qualitative or quantitative analysis of fecal metabolite and lipid profiles in our study. The eligible patients with UC had moderate-to-severe disease activity (Mayo score = 6–12 and endoscopic subscore ⩾ 2). 15 The patients were administered adalimumab and were allowed to take other drugs under the investigator’s supervision. All the participants were asked to not take any antibiotics and maintain a routine diet before fecal sample collection. The dosing regimen of adalimumab was as follows: 160 mg at week 0, 80 mg at week 2, and 40 mg every other week from week 4 until week 56. All the experiments were conducted in compliance with the Ethical Principles for Medical Research Involving Human Subjects outlined in the Declaration of Helsinki in 1975 (revised in 2000) and registered at clinicaltrials.gov (study identifier: NCT02499263). This study followed the STROBE and TRIPOD guidelines. A workflow of the study design is presented in Supplemental Figure 1.
Patient assessments
Baseline evaluation of laboratory parameters (FC, CRP, and serum albumin levels), demographic characteristics [age, sex, and body mass index (BMI)], endoscopic findings, disease severity, and other clinical characteristics was performed. Disease severity was assessed using the Mayo score. Clinical remission was evaluated at 8 (short term) and 56 (long term) weeks of adalimumab treatment using the Mayo and partial Mayo scores. Weeks 8 and 56 after anti-TNF therapy were the time points commonly used to assess primary and sustained remission, respectively, in patients with IBD.16–18 The criteria for clinical remission were a Mayo score of ⩽2 without a subscore of >1 point and a partial Mayo score of 0 or 1.
Fecal sample collection
In total, 201 samples (83, 86, and 32 samples at 0, 8, and 56 weeks following adalimumab treatment, respectively) were collected from 116 patients with UC and 37 samples were collected from healthy controls (HC). Fewer fecal samples were collected at 56 weeks than at 0 and 8 weeks because patients who experienced reduced drug efficacy before week 56 discontinued the treatment and sampling. The collected samples were immediately stored in a freezer (−20°C). The frozen samples were placed in aluminum foil bags and delivered to the laboratory within 10 min. The samples thawed at 4°C to prevent metabolic changes were diluted in pH 7.4 phosphate-buffered saline (1:10) and stored at −80°C until further analyses. For metabolomic and lipidomic analyses, the frozen samples were freeze-dried and the lyophilized samples were stored at −80°C until use.
GC-MS analysis of fecal metabolome
The lyophilized fecal samples (20 mg) were extracted using pure methanol (1000 µL), vortexed (1 min), sonicated (20 min), and centrifuged (2530 ×g at 10°C for 5 min). The supernatant was filtered (PTFE 13-mm syringe filter, 0.45 μm, Whatman, England), and the filtrate (80 µL) was dried under a gentle nitrogen stream. An internal standard of 10 µL of 4000 pmol/µL (4 mM) 2-fluorobiphenyl (TCI America, Portland, OR, USA) in pyridine (Sigma-Aldrich, St. Louis, MO, USA) was added to the dried extract. Next, for derivatization, 30 μL of 20,000 μg/mL methoxyamine hydrochloride (Sigma-Aldrich) in pyridine and 50 μL N,O-bis (trimethylsilyl) trifluoroacetamide containing 1% trimethylchlorosilane (Sigma-Aldrich) were added. The derivatized samples were then incubated at 65°C for 60 min. The total volume of each sample (90 µL) was analyzed using GC-MS.
GC-MS (Agilent 7890A with an autosampler 7683B series and 5975C mass selective detector, Agilent Technologies, Santa Clara, CA, USA) was performed according to a previously reported method, 19 with some modifications. The sample (1.0 μL) was injected into the inlet at a split ratio of 1:10 at 230°C, and helium was used as the carrier gas at a constant flow rate of 1.0 mL/min. A DB-5 column (30 m × 0.25 mm × 0.25 μm, Agilent Technologies) with a silica capillary column of 5% phenyl methylpolysiloxane was used for GC-MS. The instrumental temperature conditions were as follows: MS quad, 150°C; MS source, 250°C; and auxiliary, 300°C. In the full scan mode, the mass data were collected in the 50–600 Da range. The oven temperature program was started at 70°C and increased as follows: 75°C (1°C/min), 135°C (5.63°C/min), 141°C (1°C/min), and 300°C (5.63°C/min). The quality control (QC) samples (n = 27, pooled samples with equal proportions of each sample) were analyzed after every 10 samples within the analytical run to ensure instrumental conditions and data quality during the analyses. The metabolites in the fecal samples were identified by comparing them with those reported in published data in the Human Metabolome Database (HMDB; http://www.hmdb.ca/) and Golm Metabolome Database (GMD; http://gmd.mpimp-golm.mpg.de/).
Nano-ESI-MS analysis of fecal lipidome
Fecal lipid extraction was performed using a previously reported method, 20 with some modifications. The lyophilized fecal samples (20 mg) were extracted using a cold solvent mixture (containing 0.01% butylated hydroxytoluene, w/v) of methanol, methyl-tert-butyl ether (MTBE), and 2.5% (w/v) trichloroacetic acid (1:4.5:2.5, v/v/v). Next, 20 μL of internal standard (1,2-diheptadecanoyl-sn-glycero-3-phosphoethanolamine; PE 17:0/17:0) was added to the mixture, vortexed, and homogenized for 1 min using a disperser (Ultra-Turrax, T10 basic, IKA, Staufen, Germany). The fecal slurry was centrifuged (7000 ×g at 4°C for 10 min), and the upper lipid-containing MTBE phase (240 μL) was dried under a gentle nitrogen stream. The dried lipid extract was reconstituted in chloroform/methanol (2:1, v/v) and further diluted with methanol/chloroform (2:1, v/v) containing 7.5 mM ammonium acetate before analysis.
Nano-ESI-MS (LTQ-XL linear-ion-trap mass spectrometer, Thermo Fisher Scientific, San Jose, CA, USA) equipped with the TriVersa NanoMate System (Advion Biosciences, Ithaca, NY, USA) was performed in the positive and negative ion modes using a previously reported method, 19 with some modifications. Next, a 10-μL sample was infused into the MS system through a nanoelectrospray chip with 5.5-μm-diameter spray nozzles. The ion source was controlled using Chipsoft 8.3.1 software (Advion Biosciences). The settings in the positive and negative ion modes were as follows: ionization voltage, 1.4 and −1.7 kV; backpressure, 0.4 and 0.95 psi; capillary voltage, 49 and −36 V; and tube lens voltage, 170 and −97.62 V, respectively. Xcalibur software (version 2.2.; Thermo Fisher Scientific) was used for spectrum acquisition. Data were acquired in the profile mode for 2 min, and the scan range was set at m/z 400–1200. A data-dependent MS/MS scan was performed under the collision energy offset of 35 eV. Dynamic exclusion parameters were set as follows: repeat duration of 60 s, exclusion duration of 60 s, and exclusion list size of 50. The QC samples (n = 30, pooled samples with equal proportions of each sample) were analyzed after every 10 samples within the analytical run to ensure instrumental conditions and data quality during the analyses. All spectra were recorded using Xcalibur software (version 2.2; Thermo Fisher Scientific), and lipid species were identified using LipidMAPS (http://www.lipidmaps.org/), LipidBlast, and an in-house MS/MS library. Lipid annotation was performed based on the matching quality, rank scores, and annotation probability of MS/MS ion fragments compared with those in LipidBlast libraries. MS/MS spectra for each lipid species in the experiment and library were directly compared based on the m/z values and intensities of each MS/MS ion fragment, and the lipid species showing the highest matching quality were annotated.
Data preprocessing and statistical analyses
The metabolite mass spectra were processed using Expressionist® MSX software (version 2013.0.39, Genedata, Basel, Switzerland) for further data processing. Raw data files (*.raw) of lipids were converted to *.mzXML files using ProteoWizard msConvert software, and the spectrum data were further processed using Expressionist® MSX software. Data matrices, including m/z and peak intensity, were exported as Excel files (version 2010, Microsoft, Redmond, WA, USA). Normalization for both metabolites and lipids was performed by dividing the peak intensity of each compound by that of each internal standard.
Principal component analysis (PCA) and (orthogonal) partial least squares discriminant analysis ([O]PLS-DA) were performed on SIMCA software (version 15.0, Umetrics, Umeå, Sweden) scaled using the unit-variance (UV) or Pareto method. The PCA and (O)PLS-DA models were evaluated using good fitness (R2X for PCA and R2Y for [O]PLS-DA) and predictability (Q2X for PCA and Q2Y for [O]PLS-DA) parameters, with values closest to 1 indicating an excellent model. The permutation test and sevenfold cross-validation were performed to prevent overfitting of the model. In the permutation test, intercept values of R2Y and Q2Y below 0.4 and 0.05, respectively, represent a valid model. Cross-validated analysis of variance (CV-ANOVA) was also performed to assess the significance of the Q2Y value and reliability of the model. Prediction models were developed using identified 82 metabolites and 44 lipids, and the final model was constructed by combining the most significant variables. The receiver operating characteristic (ROC) curve was analyzed to determine the prediction performance of the model using SIMCA software and MetaboAnalyst 4.0 (http://www.metaboanalyst.ca/) (by 500-time bootstrappings). Performance evaluators [sensitivity, specificity, and area under the ROC curve (AUC)] were used to assess the prediction performance of the model. Missing values from clinical and nano-ESI-MS data that could not be analyzed due to a lack of medical records or insufficient sample amounts were treated by the default function of each software. For SIMCA, the Non-linear Iterative Partial Least Squares (NIPALS) algorithm, which interpolates the missing point using a least squares fit, was applied. For MetaboAnalyst, replacement by one-fifth of the minimum positive values of their corresponding variables was applied.
The unpaired t-test or Mann–Whitney test was performed to assess the statistical significance using GraphPad Prism 9.3 (GraphPad Software, Inc., La Jolla, CA, USA). Comparison between pre- and post-treatment levels was performed by Wilcoxon signed-rank test using GraphPad Prism 9.3. Significance in univariate statistical analysis was determined by satisfying the p value and the adjusted p value (q) below 0.05. Non-parametric Kruskal–Wallis tests with multiple comparisons by Bonferroni correction and boxplots were performed using SPSS (version 25.0 for Windows, SPSS Inc., Chicago, IL, USA). Proximity matrix analysis was performed using SPSS (version 29.0 for Windows, SPSS Inc.) and dissimilarity was calculated based on the Euclidean distance. To increase the interpretation and visualization of the matrix, the average values of each group were used for proximity matrix construction because of a large number of sample pairs.
Predictive biomarkers for clinical remission following adalimumab treatment were selected based on the condition satisfying both univariate statistical analysis [p value and adjusted p value (q) below 0.05] and [O]PLS-DA-derived variable influence on the projection value (over 1.0).
Results
Study population and baseline characteristics
This study included 116 patients with UC (43 female and 73 male patients; mean age, 45.2 years) and 37 HC (mean age, 39.8 years). Baseline characteristics of patients with UC are listed in Supplemental Table 1. The baseline BMI was 22.6 kg/m2, and Mayo and partial Mayo scores were 8.7 and 6.2, respectively. The average FC, CRP, and albumin levels were 889.9 mg/kg, 4.2 mg/dL, and 3.8 g/dL, respectively.
Longitudinal analysis of fecal metabolite and lipid profiles after adalimumab treatment
GC-MS analysis revealed 82 metabolites in the fecal samples of HC and patients with UC at 0, 8, and 56 weeks of treatment (Supplemental Table 2). Nano-ESI-MS analysis revealed 44 lipid species, with 36 and eight species being detected in the positive and negative ion modes, respectively (Supplemental Table 3). Univariate and multivariate statistical analyses revealed that the fecal metabolite profiles of patients with UC markedly differed from those of HC at baseline (Table 1 and Figure 1(a) and (b)). However, the fecal lipid profiles of patients with UC did not differ from those of HC at baseline (Supplemental Table 4 and Figure 1(c) and (d)).
Fold change analysis and VIP value analysis of fecal metabolites between baseline samples of patients with UC and HC using GC-MS.
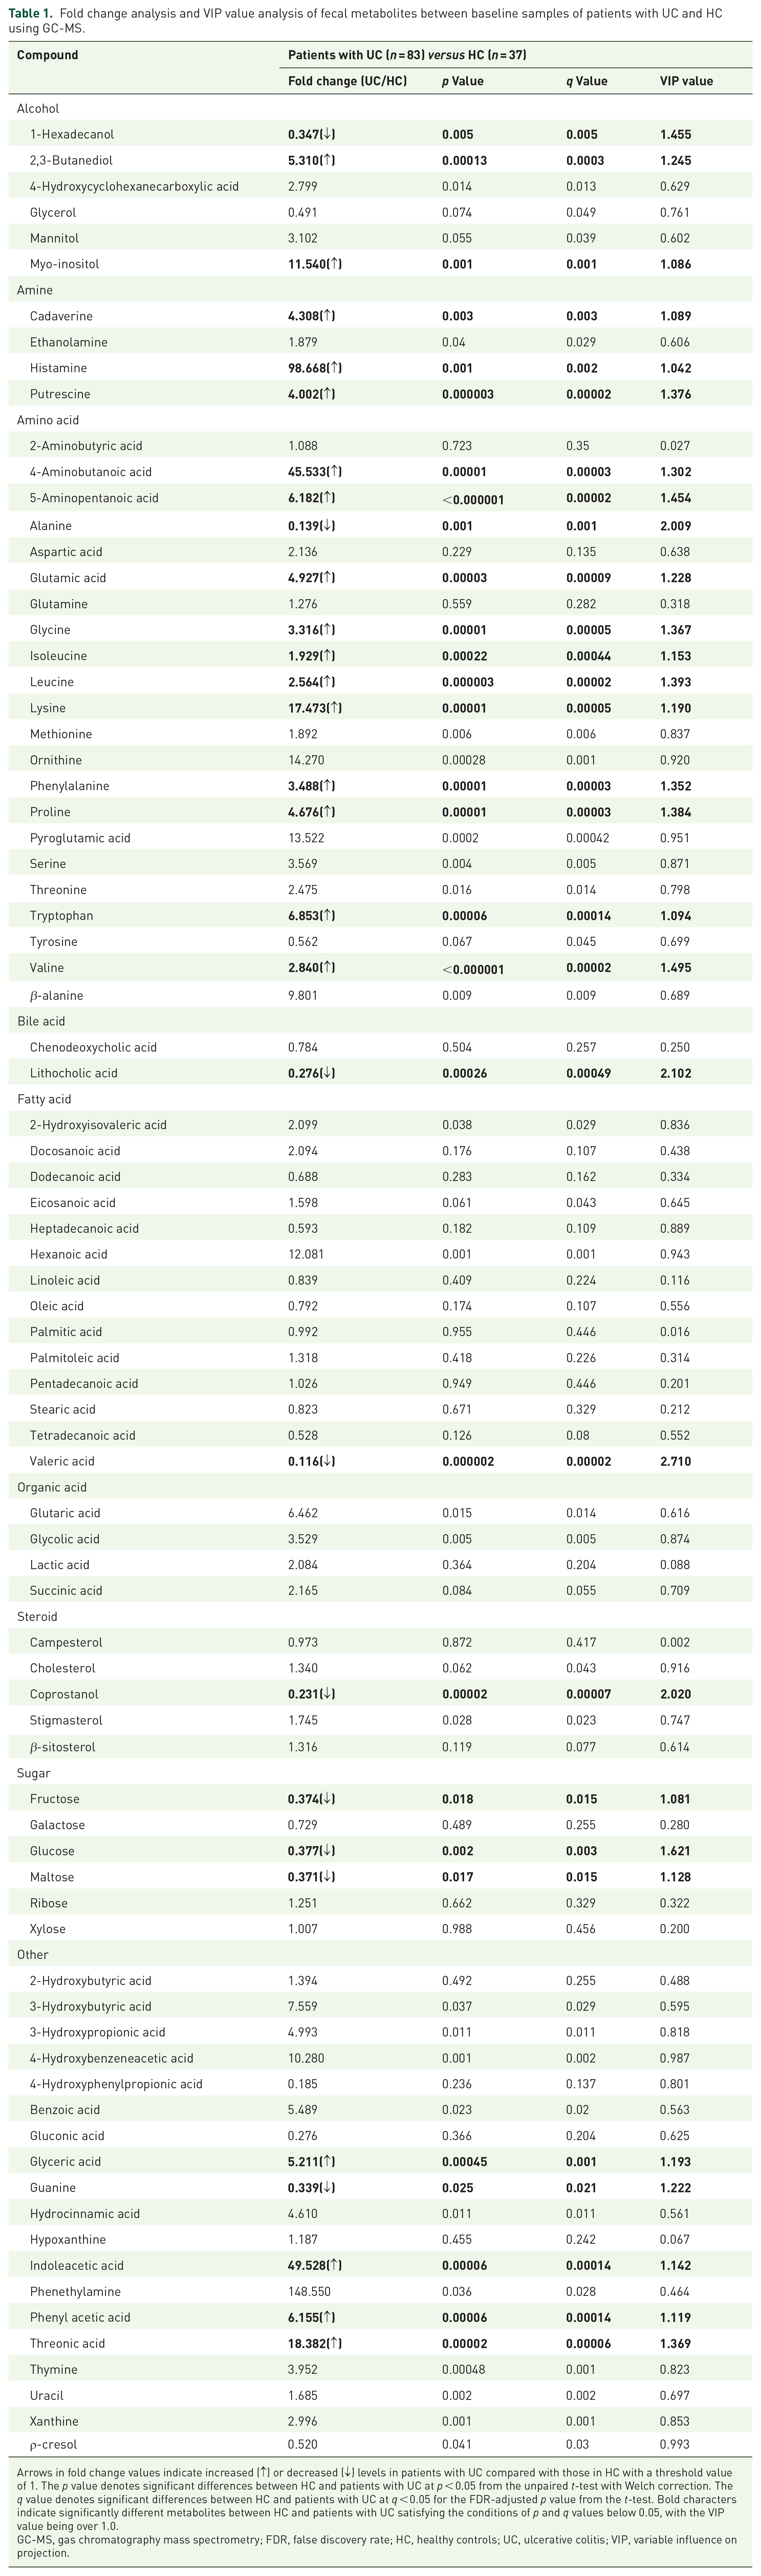
Arrows in fold change values indicate increased (↑) or decreased (↓) levels in patients with UC compared with those in HC with a threshold value of 1. The p value denotes significant differences between HC and patients with UC at p < 0.05 from the unpaired t-test with Welch correction. The q value denotes significant differences between HC and patients with UC at q < 0.05 for the FDR-adjusted p value from the t-test. Bold characters indicate significantly different metabolites between HC and patients with UC satisfying the conditions of p and q values below 0.05, with the VIP value being over 1.0.
GC-MS, gas chromatography mass spectrometry; FDR, false discovery rate; HC, healthy controls; UC, ulcerative colitis; VIP, variable influence on projection.

Discrimination between patients with UC and HC at baseline based on fecal metabolite and lipid profiles analyzed using GC-MS and nano-ESI-MS. (a) and (b) PCA-derived score plots and OPLS-DA-derived score plots of fecal metabolites between patients with UC (at week 0, n = 83) and HC (n = 37). (c) and (d) PCA-derived score plots and OPLS-DA-derived score plots of fecal lipids between patients with UC (at week 0, n = 83) and HC (n = 37).
As shown in the PCA-derived score plots, the metabolite profiles (from GC-MS analysis) of patients with UC were changed similarly to those of HC during the treatment periods, with reduced outliers being noted (Figure 2(a)). The QC samples were well clustered, indicating instrumental stability and analytical robustness (Supplemental Figure 2a). However, no changes were noted in the fecal lipid profiles during the treatment periods (Figure 2(b) and Supplemental Figure 2b). The proximity matrix also revealed that the Euclidean distance (dissimilarity) of fecal metabolite levels between HC and patients with UC (at 0, 8, and 56 weeks) decreased during the treatment periods (Supplemental Figure 2a). This implies that the metabolite profiles of patients with UC were changed similarly to those of HC during treatment. However, these tendencies were not found in the fecal lipid profile-based proximity matrix (Supplemental Figure 2b). Boxplots showed significantly changed fecal metabolites and lipids in RM and NRM at 0, 8, and 56 weeks (Figure 3 and Supplemental Figure 3). In RM, the baseline levels of 22 metabolites and three lipids were changed similarly to those in HC at 8 and 56 weeks of treatment (Figure 3(a) and Supplemental Figure 3). Meanwhile, in NRM, the baseline levels of six metabolites were changed similarly to those in HC at 8 and 56 weeks of treatment (Figure 3(b)). However, none of the lipids showed significant changes during treatment in NRM.

Fecal metabolite and lipid profiles of patients with UC changed similarly to those of HC during 56 weeks of adalimumab treatment, as analyzed using GC-MS and nano-ESI-MS. (a) PCA-derived score plots of fecal metabolites (from GC-MS analysis) in patients with UC at 0, 8, and 56 weeks of treatment and in HC. (b) PCA-derived score plots of fecal lipids (from nano-ESI-MS analysis) in patients with UC at 0, 8, and 56 weeks of treatment and in HC.

Significant changes in fecal metabolites by adalimumab treatment. (a) Changes in RM. (b) Changes in NRM. Comparison among three groups (W0, W8, and W56) was performed using the Kruskal–Wallis test, and multiple comparisons were performed using the Mann–Whitney test with Bonferroni correction. In multiple comparisons using the Mann–Whitney test, significant differences between two groups (W0 & W8, W0 & W56, and W8 & W56) were represented using an asterisk (*) at Bonferroni corrected p < 0.017 (0.05/3). Hash (#) indicates significant differences between two groups (W0 & HC, W8 & HC, and W56 & HC) in the t-test or Mann–Whitney test at p and false discovery rate-adjusted p (q) values <0.05.
Further analysis was conducted to assess the changes in fecal metabolites and lipids during adalimumab treatment using consistent samples (n = 21) obtained at 0, 8, and 56 weeks of treatment to identify the effect of potential bias by the loss of samples during treatment due to reduced drug efficacy. As shown in Supplemental Figure 4, the fecal metabolites of patients with UC were changed similarly to those of HC; however, no characteristic changes in fecal lipids were noted during 56 weeks of adalimumab treatment. This finding is similar to that of PCA analysis conducted using total samples collected at 0, 8, and 56 weeks (Figure 2), verifying the consistency of our results regardless of the effect of biased sample loss.
Fecal metabolic and lipidomic differences between RM and NRM after adalimumab treatment
A comparison of RM and NRM after 8 and 56 weeks of treatment revealed that fecal metabolite profiles of RM were more grouped and clustered with those of HC than with those of NRM in the PCA analysis (Figure 4(a) and (b)). However, the fecal lipid profiles showed no distinct separation among RM, NRM, and HC at 8 and 56 weeks of treatment in the PCA analysis (Figure 4(c) and (d)). Hierarchical heatmap and dendrogram analyses revealed similar results. In particular, the fecal metabolites of RM at 8 and 56 weeks of treatment were more clustered with those of HC than with those of NRM, while a less apparent clustering pattern was noted in the fecal lipids across samples (Supplemental Figure 5). In univariate statistical analyses, lower levels of 2,3-butanediol, putrescine, amino acids (glutamic acid, glycine, isoleucine, leucine, phenylalanine, pyroglutamic acid, tryptophan, and valine), threonic acid, thymine, and uracil were noted in RM than in NRM at 8 weeks (Supplemental Table 5). At 56 weeks, the levels of amino acids (glutamic acid and serine) and stearic acid were lower in RM than in NRM (Supplemental Table 5). The levels of the described metabolites in RM were more similar to those in HC in the fold change analysis (Supplemental Table 5). No significant difference was noted in the levels of lipids between RM and NRM at 8 and 56 weeks of treatment. Only one lipid (monoacylglycerol 22:5) significantly differed between RM and NRM at 56 weeks of treatment (Supplemental Table 6).

Fecal metabolite and lipid profiles of RM and NRM after adalimumab treatment and comparison with those of HC using GC-MS and nano-ESI-MS. (a) and (b) PCA-derived score plots of fecal metabolites in RM and NRM after 8 and 56 weeks of adalimumab treatment and in HC. (c) and (d) PCA-derived score plots of fecal lipids in RM and NRM after 8 and 56 weeks of adalimumab treatment and in HC.
As shown in Figure 5(a) to (d), compared with week 0 (baseline), four metabolites (3-hydroxybutyric acid, dodecanoic acid, lysine, and phenethylamine) exhibited significant changes after 56 weeks of adalimumab treatment in RM. Moreover, compared with baseline, the levels of dodecanoic acid in RM increased to the levels in HC, whereas the levels of 3-hydroxybutyric acid, lysine, and phenethylamine in RM decreased to the levels in HC after 56 weeks of treatment. However, no significant changes were noted in these metabolites in NRM before and after treatment. The fecal lipid profiles did not change significantly before treatment and after 56 weeks of treatment in both RM and NRM (data not shown).

Boxplots showing significant changes in the relative levels of fecal metabolites before and 56 weeks after adalimumab treatment in RM and NRM and comparison with those in HC. (a) 3-Hydroxybutyric acid, (b) dodecanoic acid, (c) lysine, and (d) phenethylamine. Significant changes in fecal metabolites between W0 and W56 were determined using Wilcoxon signed-rank test (p and adjusted p values <0.05). Significant differences in fecal metabolites between HC & W0 and HC & W56 were determined using the Mann–Whitney test (p and adjusted p values <0.05). The adjusted p (q) value is presented above the comparison line.
Establishment of prediction model of clinical remission following adalimumab treatment
Prediction models of remission following adalimumab treatment were established using baseline (pretreatment) fecal samples from patients with UC (total, 83; 30 female patients and 53 male patients). Prediction models of both short-term (8 weeks) and long-term (56 weeks) remission could not be established by GC-MS-based and nano-ESI-MS-based metabolite and lipid profiling for the total patient and female patient groups (Supplemental Figure 6a–c, p > 0.05 in the CV-ANOVA test, no significant model component). In contrast, for the male patient group, (O)PLS-DA-based prediction models of long-term remission could be developed by metabolite and lipid profiling and validated by permutation and CV-ANOVA tests (Supplemental Figure 7a–d), while those of short-term remission could not. We also tried to establish a prediction model of clinical remission at 56 weeks using only four fecal metabolites (3-hydroxybutyrate, lysine, phenethylamine, and dodecanoic acid), which were suggested to be dominantly changed in RM but not in NRM after 56 weeks of treatment (Figure 5). For the three subgroups (total, female, and male patients with UC), we could not obtain any validated prediction model because of insufficient parameters (p > 0.05 in the CV-ANOVA test, no significant model component) (Supplemental Figure 8). Furthermore, we searched for prediction models of long-term remission (56 weeks) at the early stage of treatment (8 weeks). However, for both fecal metabolites and lipids, validated models could not be developed because of insufficient parameters for total, female, and male patients (p > 0.05 in the CV-ANOVA test, Q2Y value < 0) (Supplemental Figure 9).
In male patients, the baseline clinical characteristics were not significantly different between RM and NRM (Supplemental Table 7). For potential biomarkers of long-term remission in male patients, metabolite biomarkers from GC-MS analysis could not be identified due to unsatisfied univariate statistical analysis (no metabolites with both p value and q value below 0.05) (Supplemental Table 8). In contrast, 10 lipid biomarkers from nano-ESI-MS analysis [DAG (diacylglycerol) 18:2/18:2, triacylglycerol (TG) 16:1/16:1/18:1, TG 16:0/16:0/18:2, TG 16:0/18:1/18:2, TG 16:0/18:1/18:1, TG 18:2/18:2/18:2, TG 18:1/18:2/18:2, TG 18:1/18:1/18:2, TG 18:2/18:2/20:1, and TG 18:2/18:2/20:0] could be identified (Supplemental Table 9). The (O)PLS-DA model comprising the selected 10 lipid biomarkers was successfully established, as shown in Figure 6(a). In ROC curve analysis, the prediction performance of these 10 lipid biomarkers was excellent, showing an AUC value of 0.869 and sensitivity and specificity of 0.935 and 0.750, respectively (Figure 6(b)). These values were higher than those of conventional clinical biomarkers [AUC values: FC, 0.677 (0.514–0.837); CRP, 0.619 (0.440–0.764); and albumin, 0.609 (0.439–0.775)] (Figure 6(c)).

Prediction model and its performance of predicting long-term remission following adalimumab treatment in male patients with UC. (a) OPLS-DA-derived score plots of baseline fecal samples between RM and NRM comprising 10 lipid biomarkers. t[1] and to[1] in the X- and Y-axes represent the predictive component (describes between-group variations) and orthogonal component (describes within-group variations), respectively. (b) ROC curve of the OPLS-DA model comprising 10 lipids. (c) ROC curves of three clinical markers after 500 times of bootstrapping.
Discussion
We noted changes in fecal metabolite and lipid profiles after adalimumab treatment in patients with UC, resulting in similar profiles to those of HC. Our findings suggest four potential therapeutic target compounds, namely 3-hydroxybutyric acid, dodecanoic acid, lysine, and phenethylamine, which significantly changed after 56 weeks of treatment only in RM but not in NRM. Decreased levels of lysine and phenethylamine similar to those noted in HC after adalimumab treatment were characteristic features of remission in our study. Higher levels of fecal amino acids, including lysine, were identified in patients with IBD (UC or CD) than in HC, which may be due to malabsorption or gut microbiota dysbiosis. 21 Higher levels of fecal amino acids were also found at baseline in pediatric patients with UC than in HC; these levels decreased after fecal microbiota transplantation therapy. 22 Phenethylamine, an aliphatic amine and putrefactive compound, is produced by the decarboxylation of endogenous and undigested amino acids during colonic fermentation. 23 Fecal phenethylamine levels in patients with CD were significantly higher than those in HC. Moreover, the prevalence of Faecalibacterium negatively correlated with phenethylamine levels, suggesting a role of this metabolite in the pathogenesis of inflammatory conditions. 5 Furthermore, in RM at 56 weeks of treatment, the baseline level of 3-hydroxybutyric acid at week 0 decreased at 56 weeks of treatment in our study. 3-Hydroxybutyric acid was found to attenuate stress-induced inflammatory responses and increase SCFA production in an in vitro colonic microbial model.24,25 In RM, a decrease in fecal 3-hydroxybutyric acid levels to the normal range noted in HC was observed after 56 weeks of treatment in our study. It is presumed that 3-hydroxybutyric acid might be actively utilized in the body system, including colon tissues in RM, resulting in a decreased level of 3-hydroxybutyric acid in fecal samples. Taken together, maintaining levels of 3-hydroxybutyric acid, lysine, and phenethylamine in fecal samples of patients with UC similar to those in HC may be a possible strategy for successful anti-TNF therapy outcomes in these patients.
Compared with baseline, increased levels of fecal dodecanoic acid were noted in RM at 56 weeks in our study. Dodecanoic acid, a medium-chain fatty acid, exhibits a broad spectrum of antibacterial activities against various bacteria and may play an important role in maintaining intestinal health by inhibiting pathogenic gut microbial activity. 26 Thus, dietary intervention to increase the intake of dodecanoic acid could be a strategy to improve the efficacy of anti-TNF therapy.
Some results of our study are controversial. In particular, similar changes in fecal metabolites were noted in NRM and RM during treatment (Figure 3(b)). The levels of six metabolites (3-hyrdroxybutyric acid, cadaverine, fructose, galactose, phenethylamine, and valeric acid) were changed similarly to those in HC from weeks 0 to 56, this is similar to the finding in RM. Clinical response or partial clinical response to treatment in some of NRM in our study may have affected these results, considering that some patients who did not show clinical remission at 8 and 56 weeks of treatment showed clinical response to treatment at each time point.
Taking another concomitant medication has been reported to interfere with the gut microbiota and fecal metabolites.27–30 Patients who participated in our study took another concomitant medication, including systemic corticosteroid, 5-aminosalicylate and azathioprine/6-mercaptopurine, during adalimumab treatment. However, corticosteroid was used in a small number of patients, and almost all of them were discontinued within 3 months. 5-aminosalicylate and azathioprine/6-mercaptopurine were started before adalimumab treatment and maintained steadily during the study period in most patients. Hence, the effect of concomitant medication on fecal metabolite changes may have been avoided.
A prediction model of long-term (56 weeks) remission could be developed for male patients based on lipid biomarkers (higher levels of DAG and TGs at baseline) and exhibited good prediction performance. Lipids in human feces are also considered important biomarkers of intestinal health and function. 31 A higher baseline level of fecal TG in RM noted in our study may have led to a lower level of blood TG in RM than in NRM. Similarly, among patients with CD, a higher baseline level of fecal TG and a lower level of serum TG were noted in responders to anti-TNF therapy, and fecal lipid biomarkers, including TG, exhibited good prediction performance. 12 TNF-α has been reported to inhibit TG clearance by suppressing the activity of lipoprotein lipase, which is the major enzyme responsible for the hydrolysis of circulating TG in the peripheral tissue.32,33 Moreover, a higher burden of TNF-α could result in lower trough levels of anti-TNF drugs, which could induce treatment failure with these drugs in obese patients. 34 Thus, increased systemic circulation of TG could be expected in NRM in our study, which may result from the higher level of TNF-α at baseline. We speculated that NRM in our study exhibited treatment failure with anti-TNF drugs because of a higher burden of TNF-α, which represented a lower level of excreted TG in fecal samples.
Our study has several limitations. First, a smaller number of samples at 56 weeks could be a bias factor in the longitudinal analysis. We tried to overcome this limitation by analyzing consistent samples at 0, 8, and 56 weeks and obtaining consistent results to those obtained from the total samples during 56 weeks of treatment. Furthermore, as most samples at 56 weeks were collected from patients who exhibited treatment efficacy at 56 weeks, similar fecal metabolite profiles at 56 weeks between patients with UC and HC could be a natural finding of our study. Second, we could not establish a prediction model for female patients, possibly because of a smaller sample size of female patients than male patients. Although our study did not find differences in the fecal metabolite and lipid profiles by gender (data not shown), previous studies have reported that the microbial abundance or fecal metabolite levels vary between males and females,35–38 which may be attributed to the different intakes of macronutrients and different metabolic states. Also, the incidence of IBD (UC and CD) among males is higher than that among females in Asian countries, 39 and males are associated with a higher risk of inflammation-related colon cancer than females because of hormonal differences. 40 These differences between men and women might result in the different patterns of prediction model establishment using fecal metabolites. Thus, our findings suggest that the development of a gender-specific prediction model may be necessary for predicting the efficacy of anti-TNF therapy in patients with UC. Third, there are limitations regarding the generalizability of our findings to the Korean cohort of patients with UC receiving adalimumab treatment. The results may not be applicable to other ethnic groups and other anti-TNF drugs, including infliximab, golimumab, and certolizumab. Further studies are warranted to validate our findings in a larger cohort comprising diverse countries, disease types, and biologics. Fourth, we could not validate our results using independent validation cohort. Validating of our results using larger number of samples collected from independent cohorts could improve the reliability and robustness of the developed models in future studies.
In conclusion, we believe that this is the first study to assess the changes in fecal metabolite and lipid profiles in patients with UC during 1 year of adalimumab treatment and to develop a prediction model of remission following adalimumab treatment. Furthermore, we assessed the differences in fecal metabolites and lipids between RM and NRM at various time points and found that the fecal metabolite profiles of RM were more similar to those of HC than to those of NRM. The potential therapeutic target compounds suggested in our study could be used to develop novel therapeutic agents for UC. The prediction model with a combination of the identified biomarkers exhibited higher prediction performance than clinical markers, and could help clinicians predict and select patients who are likely to maintain remission for ⩾1 year after adalimumab treatment and establish personalized treatment strategies for patients with UC.
Supplemental Material
sj-docx-1-tag-10.1177_17562848231168199 – Supplemental material for Changes in fecal metabolic and lipidomic features by anti-TNF treatment and prediction of clinical remission in patients with ulcerative colitis
Supplemental material, sj-docx-1-tag-10.1177_17562848231168199 for Changes in fecal metabolic and lipidomic features by anti-TNF treatment and prediction of clinical remission in patients with ulcerative colitis by Seok-Young Kim, Seung Yong Shin, Soo Jung Park, Jong Pil Im, Hyo Jong Kim, Kang-Moon Lee, Ji Won Kim, Sung-Ae Jung, Jun Lee, Sang-Bum Kang, Sung Jae Shin, Eun Sun Kim, You Sun Kim, Tae Oh Kim, Hyun-Soo Kim, Dong Il Park, Hyung Kil Kim, Eun Soo Kim, Young-Ho Kim, Dennis Teng, Jong-Hwa Kim, Wonyong Kim, Maham Saeed, Jung Min Moon, Kisung Kim, Chang Hwan Choi and Hyung-Kyoon Choi in Therapeutic Advances in Gastroenterology
Supplemental Material
sj-docx-2-tag-10.1177_17562848231168199 – Supplemental material for Changes in fecal metabolic and lipidomic features by anti-TNF treatment and prediction of clinical remission in patients with ulcerative colitis
Supplemental material, sj-docx-2-tag-10.1177_17562848231168199 for Changes in fecal metabolic and lipidomic features by anti-TNF treatment and prediction of clinical remission in patients with ulcerative colitis by Seok-Young Kim, Seung Yong Shin, Soo Jung Park, Jong Pil Im, Hyo Jong Kim, Kang-Moon Lee, Ji Won Kim, Sung-Ae Jung, Jun Lee, Sang-Bum Kang, Sung Jae Shin, Eun Sun Kim, You Sun Kim, Tae Oh Kim, Hyun-Soo Kim, Dong Il Park, Hyung Kil Kim, Eun Soo Kim, Young-Ho Kim, Dennis Teng, Jong-Hwa Kim, Wonyong Kim, Maham Saeed, Jung Min Moon, Kisung Kim, Chang Hwan Choi and Hyung-Kyoon Choi in Therapeutic Advances in Gastroenterology
Footnotes
References
Supplementary Material
Please find the following supplemental material available below.
For Open Access articles published under a Creative Commons License, all supplemental material carries the same license as the article it is associated with.
For non-Open Access articles published, all supplemental material carries a non-exclusive license, and permission requests for re-use of supplemental material or any part of supplemental material shall be sent directly to the copyright owner as specified in the copyright notice associated with the article.