
Abstract
Background:
Since not all Crohn’s disease (CD) patients respond adequately to ustekinumab therapy, biomarkers could aid to monitor treatment response and optimize therapeutic outcomes.
Objectives:
To explore the dynamics of serum biomarker concentrations to monitor the response to ustekinumab treatment in CD patients.
Design:
Retrospective, exploratory study to evaluate concentrations of serum cytokines and acute phase proteins and their relation to endoscopic remission in CD patients during ustekinumab treatment.
Methods:
Serum concentrations of 16 proteins including cytokines and acute phase proteins were measured using the Mesoscale Discovery Platform in serum of healthy controls (n = 13), and CD patients (n = 61) at baseline (week 0), week 8 and week 24 during ustekinumab treatment. Endoscopic remission was defined as simple endoscopic score for CD (SES-CD) <3 after 6 months of therapy.
Results:
Absolute concentrations of serum amyloid A protein (SAA; week 8), IL-6 (week 24), AGP (weeks 8 and 24), interferon (IFN)-γ (weeks 8 and 24), lipopolysaccharide binding protein (LBP; weeks 8 and 24) and IL-22 (weeks 8 and 24) were significantly lower in endoscopic remitters compared to non-responders (p-values ranging between <0.001 and <0.05). SAA (week 8) and AGP (week 24) were the biomarkers with the highest area under the ROC curve (AUROC; 0.761 and 0.760, respectively) for identifying patients in endoscopic remission, though their performance was not superior to C-reactive protein (CRP) or faecal calprotectin. AUROCs of the predictive probability of biomarker combinations showed superiority in discriminating endoscopic remitters from non-responders in comparison to single biomarker measurements, but not as compared to faecal calprotectin.
Conclusion:
Although not superior to faecal calprotectin, measurement of AGP, SAA, LBF, IFN-γ, IL-6 and IL-22 concentrations, and combinations thereof with or without CRP and faecal calprotectin, during ustekinumab therapy might contribute to adequate monitoring of treatment response in CD patients.
Keywords
Introduction
Crohn’s disease (CD) is a chronic inflammatory bowel disease characterized by transmural inflammation that can occur anywhere along the gastrointestinal tract. The disease is thought to arise from a complex interplay between genetics, environmental triggers, gut microbiota and a dysregulated immune system. 1
Both IL-12 and IL-23 have been implicated in the pathogenesis of CD.2,3 Interleukin (IL)-12 is a heterodimeric cytokine composed of a p40 and p70 subunit and induces the differentiation and activation of naïve T cells into T-helper (Th) 1 cells. 4 These cells secrete the pro-inflammatory cytokines interferon (IFN)-γ, tumour necrosis factor (TNF)-α and IL-2, among others. IL-23 is composed of the same p40 subunit as IL-12, and the p19 subunit, and promotes the differentiation of Th17 cells, which release several cytokines including IL-17A, IL-21 and IL-22. 4 Consequently, cytokines IL-12 and IL-23 have been used as a target for the development of new therapeutics. Ustekinumab is a monoclonal antibody directed against the shared p40 subunit of IL-12 and IL-23, and has shown effectiveness in inducing and maintaining clinical remission in moderate-to-severe CD patients. 5
As is the case with all biological therapies, not all patients benefit equally from treatment with ustekinumab. Some patients do not respond to therapy, while others initially respond but lose response over time. The standard approach for assessing treatment response is using endoscopy. However, this invasive technique is costly and time-consuming, not without risk and burdensome for the patient. 6 Although endoscopy can never be entirely abandoned, there is a need for non-invasive pharmacodynamic biomarkers which could aid the physician in monitoring treatment response and optimizing therapeutic outcomes. In this regard, C-reactive protein (CRP) is a widely-established marker of disease activity in CD and is routinely used in clinical practice to monitor inflammation and the patient’s response to treatment. 7 Although reductions in CRP have clearly been demonstrated in patients who respond to treatment, CRP does not necessarily reflect gut-related inflammation and about 30% of patients do not mount a CRP response despite having active disease. 8 Faecal calprotectin is a stool-based marker of intestinal mucosal inflammation and correlates well with intestinal disease activity. 7 The use of faecal calprotectin in routine clinical practice however, can be limited by patient compliance. Although non-invasive imaging techniques are emerging, 9 efforts have been made to identify blood-based biomarkers for treatment response monitoring but most markers lack accuracy and reproducibility.10,11
This study aimed to identify blood-based biomarkers for monitoring of response during ustekinumab therapy in CD patients. Therefore, 16 serum proteins including acute phase proteins and upstream and downstream cytokines of the IL-12/23 signalling pathway were measured during ustekinumab therapy, and their relation to endoscopic remission was investigated. The potential of these proteins as possible biomarkers for monitoring of endoscopic remission in ustekinumab-treated CD patients was examined and compared to CRP and faecal calprotectin.
Materials and methods
Study design and patients
This study was conducted at the University Hospitals Leuven (Leuven, Belgium) in accordance with the ethical principles of the Declaration of Helsinki. All patients provided written informed consent to participate in the Institutional Review Board-approved inflammatory bowel disease (IBD) Biobank (B322201213950/S53684), where serum/faecal samples and clinical characteristics are prospectively collected on predefined time points. This retrospective, exploratory study included consecutive CD patients with active endoscopic disease at baseline (presence of ulcerations), who started treatment with ustekinumab between October 2016 and June 2019 at our tertiary referral centre. All patients received an intravenous infusion of ~6 mg/kg ustekinumab at baseline (week 0), and subcutaneous dosing of 90 mg every 8 weeks thereafter. Serum samples were collected at baseline (week 0), weeks 8 and 24. Sampling at weeks 8 and 24 was performed at trough, that is, right before the next injection. The primary outcome was endoscopic remission, defined as simple endoscopic score for CD (SES-CD) <3 after 24 weeks of therapy. The group of endoscopic remitters was compared to patients not responding to ustekinumab treatment, defined as a decrease <50% in SES-CD score after 24 weeks of therapy, while patients achieving a partial or transient endoscopic response were excluded from the analyses (Figure 1). For comparative purposes, serum samples of 13 healthy controls were included. Because of the exploratory nature of the study, no power analysis for sample size was performed. The reporting of this study conforms to the Strengthening the Reporting of Observational Studies in Epidemiology (STROBE) statement. 12
Measurements
Protein concentrations of biomarkers
The concentration of a panel of 16 proteins was measured using the Mesoscale Discovery Platform (Rockville, MD, USA), an electrochemiluminescence-based, 96-well-format solid-phase multiplex assay. The biomarkers included: IL-1β, IL-6, IL-2, TNF-α, IFN-γ, IL-17A, IL-21, IL-22, IL-23, IL-12p70, IL-12/23p40, stromal cell-derived factor (SDF)-1, vascular endothelial growth factor (VEGF)-A, serum amyloid A protein (SAA), lipopolysaccharide-binding protein (LBP) and alpha-1-acid glycoprotein 1 (AGP). This selection of biomarkers was chosen either based on their upstream or downstream involvement in the IL-12/IL-23 signalling pathway(s), 4 or on our previously obtained, unpublished results. Biomarker serum concentrations were measured with the U-PLEX Biomarker Group 1 (human) assay (IL-21, IL-22, IL-23), the U-PLEX Metabolic Group 1 (human) assay in 8-plex format (IFN-γ, IL-1β, IL-2, IL-6, IL-12p70, IL-17A, TNF-α, VEGF-A) and in 2-plex format (IL-12/23p40, SDF-1), an R-PLEX Human AGP assay (AGP), an R-PLEX Human LBP assay (LBP) and a V-PLEX Human SAA kit (SAA). Sample dilutions and assay detection limits are shown in Supplemental Table 1. The assays were performed according to the manufacturer’s instructions by a single operator. Analyses were done on the MESO QuickPlex SQ120 instrument (MSD) and DISCOVERY WORKBENCH® 4.0 software (MSD), and concentrations were interpolated from a four-parameter logistic (4PL) standard curve. If the measured biomarker concentration was below the lower limit of quantification (LLOQ), the value that was used for analyses and representation in the graph was the LLOQ/2.
C-reactive protein and faecal calprotectin concentrations
CRP was measured in serum samples collected at baseline (week 0), weeks 8 and 24 at the routine laboratory of the University Hospitals Leuven. Faecal calprotectin was measured in faecal samples collected at the same time points with the fCAL ELISA kit (Bühlmann, Schönenbuch, Switzerland).
Ustekinumab concentrations
Ustekinumab concentrations were measured at baseline (week 0), weeks 8 and 24 of ustekinumab treatment using either an in-house-developed sandwich-type enzyme-linked immunosorbent assay (ELISA) or the corresponding CE-marked kit (apDia, Turnhout, Belgium). 13
Statistical analyses
Statistical analyses were performed with SPSS version 28.0.0.1 (IBM Corporation, Armonk, NY, USA), and figures were created with GraphPad Prism 9 (GraphPad Software, San Diego, CA, USA). Percentages were used for discrete variables and median with interquartile range (IQR) for continuous variables. Unpaired data were analysed using an unpaired t test or Mann–Whitney U-test for continuous variables, and Fisher’s exact or Chi square test for categorical variables. To investigate changes of biomarker concentrations over time from paired samples, the Friedman test with Dunn’s multiple comparisons test was performed. Receiver operating characteristic (ROC) curve analysis was performed to calculate the area under the ROC curve (AUROC) for identifying patients achieving endoscopic remission. Binary logistic regression was applied to calculate the predictive probability of combined biomarkers. ROC curves were constructed using the predictive probability as a covariate and AUROC was used to evaluate the performance of the marker combinations for the identification of patients achieving endoscopic remission. MedCalc software version 20.218 (MedCalc Software Ltd., Ostend, Belgium) was used to compare differences in AUROC by the DeLong method. 14 Spearman’s rank correlation coefficient (ρ) was used to investigate the relationship between two continuous variables. A two-sided p value of 0.05 or less was considered statistically significant.
Results
Patient characteristics
Of the 108 CD patients with active endoscopic disease that initiated ustekinumab treatment, 19 patients achieved endoscopic remission and 45 patients did not respond to ustekinumab treatment. Of the latter, four patients were excluded because of the unavailability of more than one of the three collected serum samples [baseline (week 0), weeks 8 and 24]. A total of 60 ustekinumab-treated CD patients (32% achieving endoscopic remission, 68% non-responders) were finally included in this study (Figure 1). All patients had active moderate to severe CD and started ustekinumab per approved reimbursement guidelines. Baseline demographic and clinical characteristics are summarized in Table 1. At baseline (week 0), endoscopic non-responders had significantly higher median SES-CD scores (11.0 versus 5.0, p < 0.05) and faecal calprotectin concentrations (1800 versus 434 µg/g, p < 0.05) compared to endoscopic remitters. Serum CRP concentrations were numerically higher in endoscopic non-responders, but significance was not reached (8.8 versus 5.8 mg/L, p = 0.098).
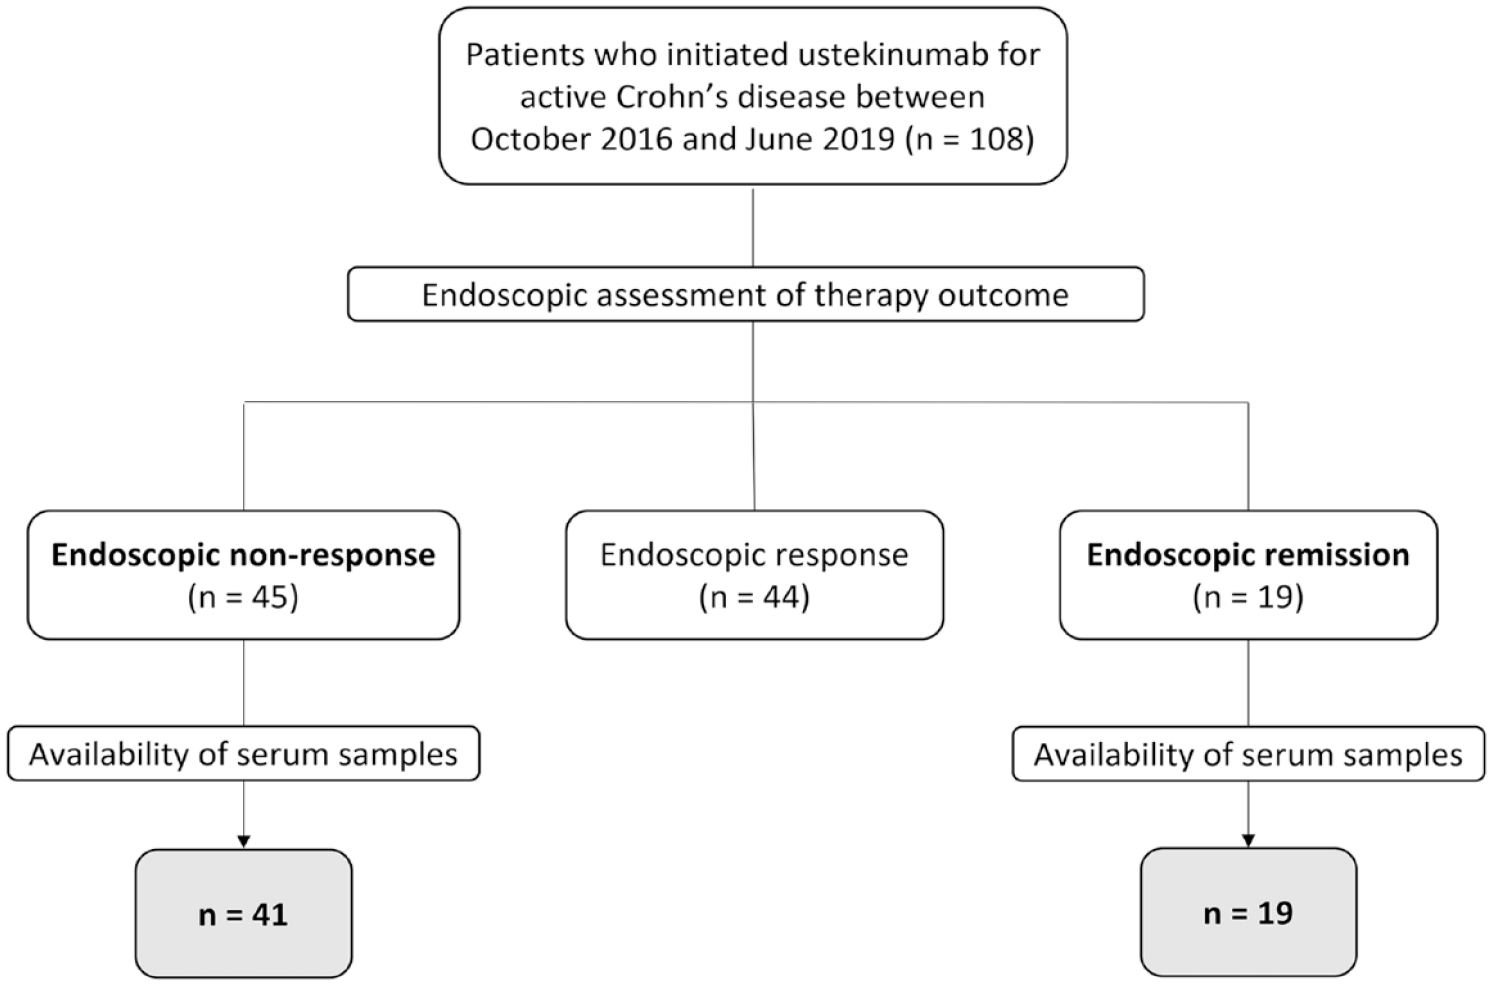
Flow chart of patients included in the study.
Baseline characteristics of the 60 included Crohn’s disease patients.

BMI, body mass index; GI, gastrointestinal; IQR, interquartile range.
Baseline (week 0) differences in biomarker concentrations between healthy controls and CD patients
Nine out of sixteen measured serum biomarkers were significantly elevated at baseline (week 0) in the CD population compared to healthy controls (Figure 2). These elevated markers included both upstream cytokines (TNF-α, p < 0.01 and IL-6, p < 0.0001) as well as downstream cytokines (IL-17A, p < 0.001; IL-21, p < 0.05; IL-22, p < 0.01 and IFN-γ, p < 0.01) associated with IL-12/23 signalling. Interestingly, the baseline (week 0) concentration of IL-12/23p40, the target of ustekinumab, was not elevated in active CD patients compared to healthy controls (p = 0.199, Supplemental Figure 1) whereas levels of IL-23 (p < 0.05), but not of IL-12(p70) (p = 0.233, Supplemental Figure 1), were significantly higher in the CD patient population. The acute phase proteins SAA and AGP were also significantly higher in CD patients compared to healthy controls (p < 0.001 and p < 0.05, respectively).
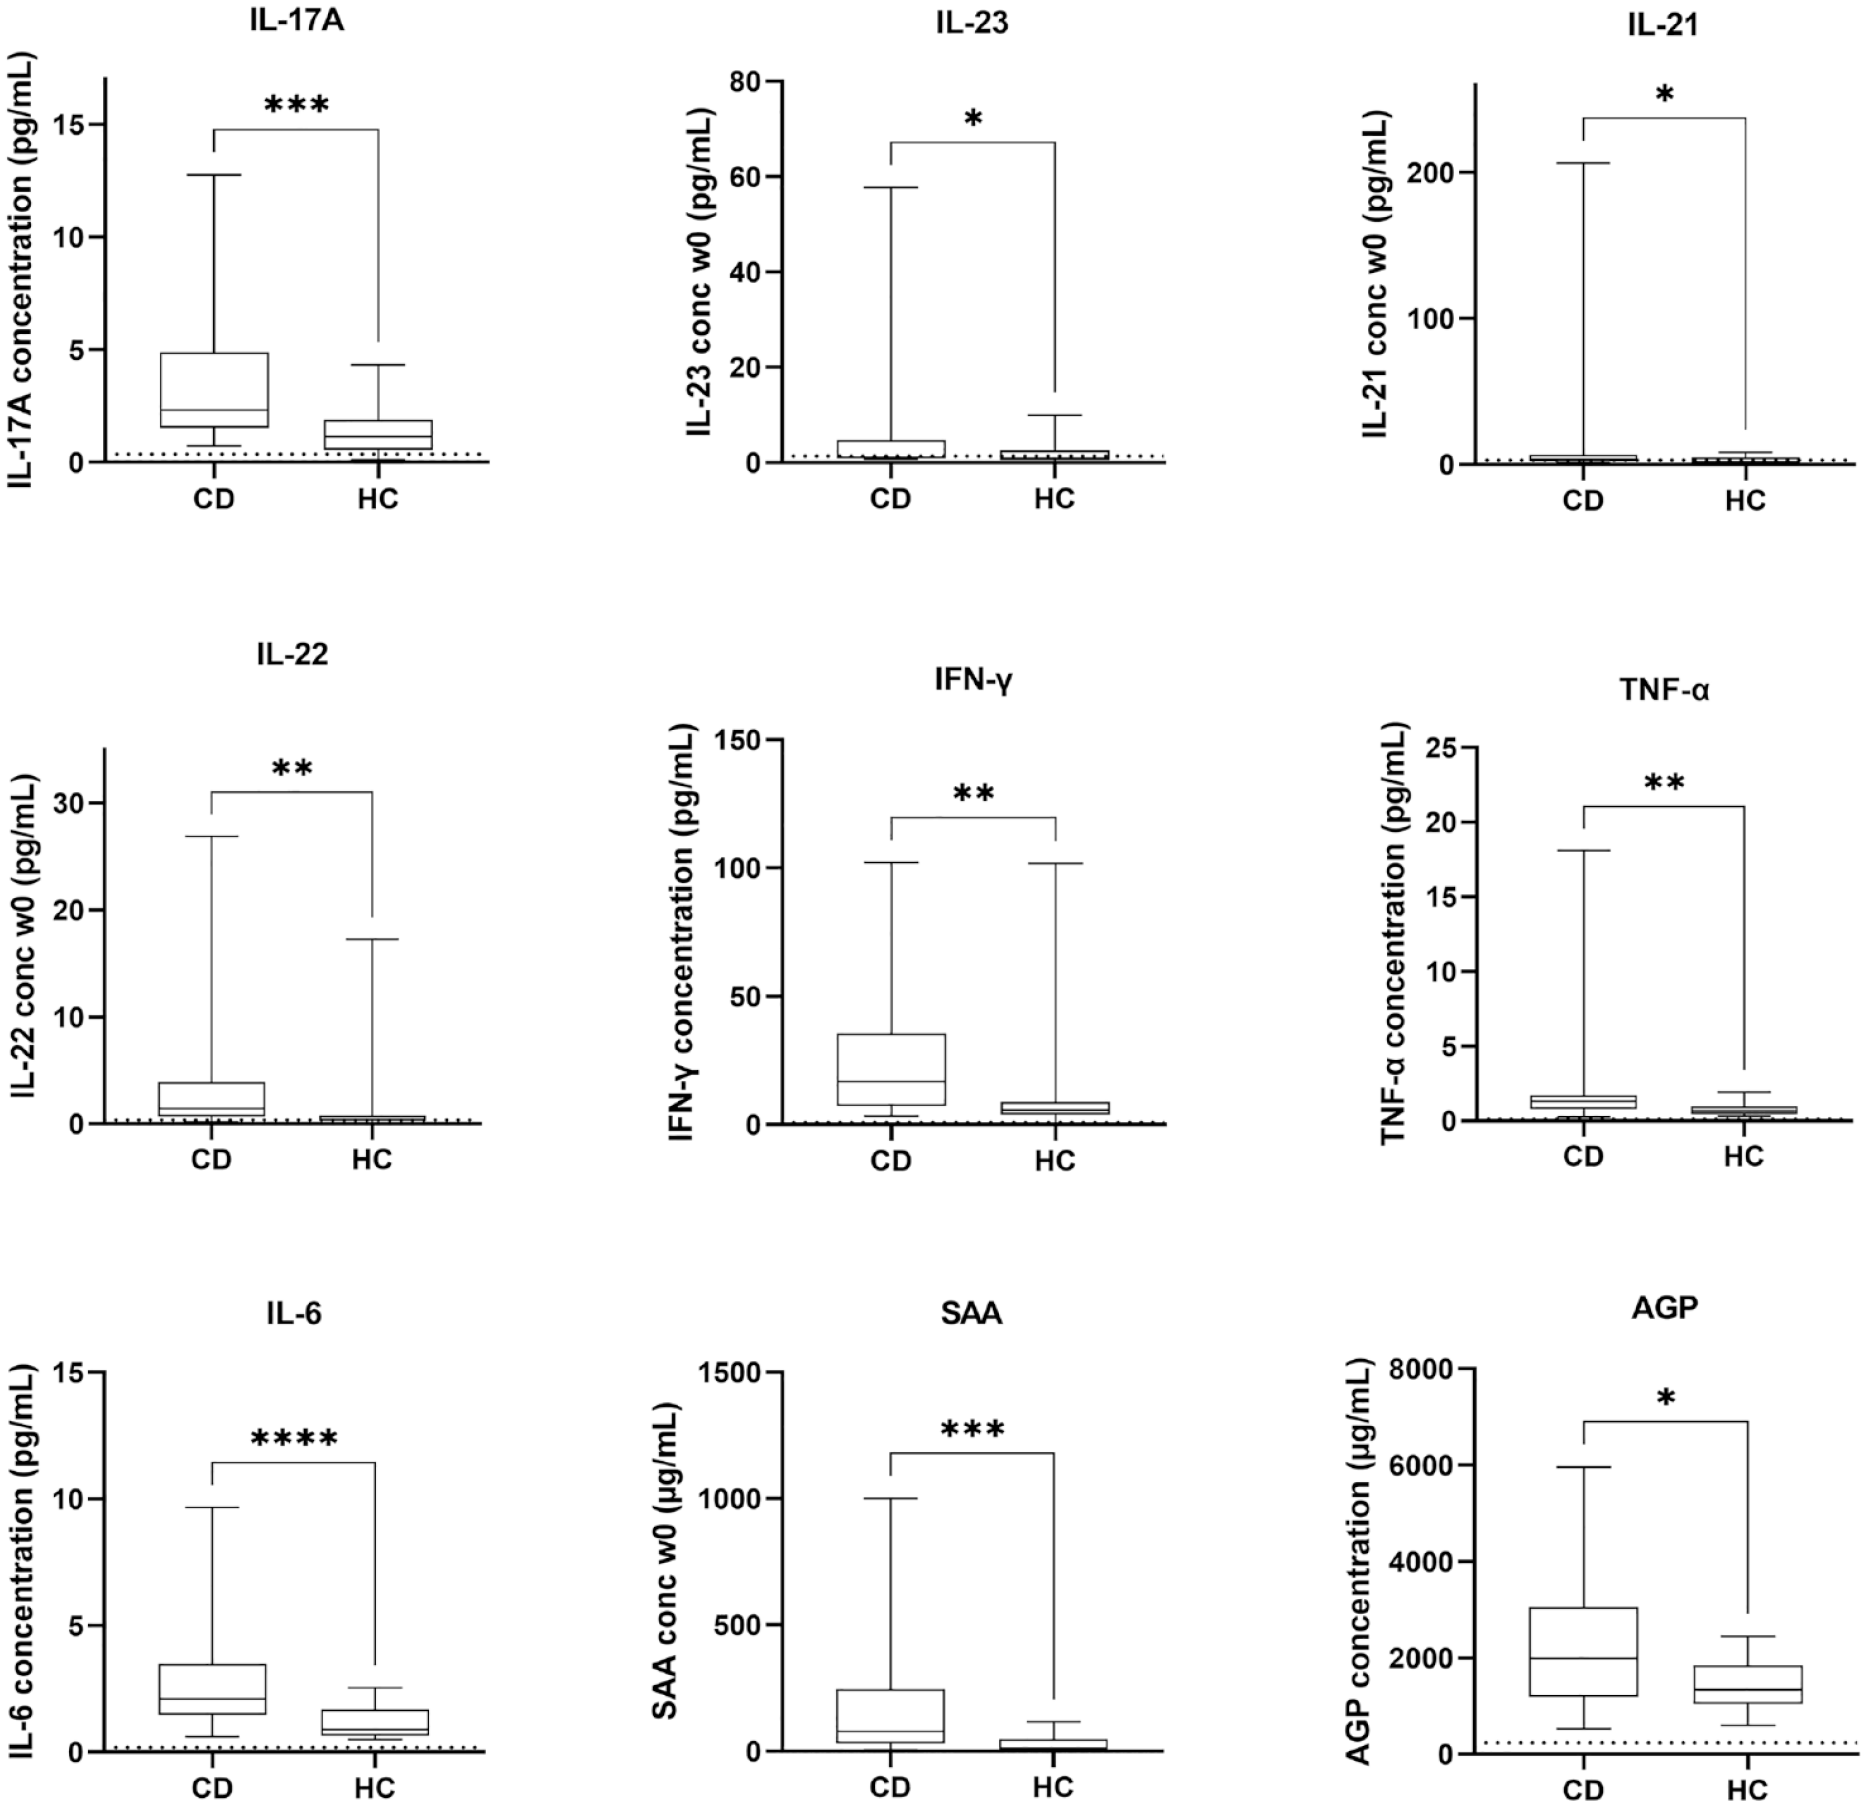
Baseline (week 0) serum concentrations of biomarkers in Crohn’s disease (CD, n = 60) and healthy controls (n = 13). The dotted line represents the LLOQ of the used immunoassay. Values below this limit are depicted as LLOQ/2.
Evolution of biomarker concentrations over time
The evolution of the concentration of the 16 serum biomarkers, serum CRP, faecal calprotectin and serum ustekinumab from baseline (week 0) to weeks 8 and 24 of ustekinumab therapy was evaluated in endoscopic remitters and non-responders (Figure 3 and Supplemental Figure 2).

Evolution of serum biomarker, CRP, faecal calprotectin and ustekinumab concentrations from baseline (week 0) to weeks 8 and 24 of therapy in patients achieving endoscopic remission (n = 19) and non-responders (n = 41). Serum concentrations of IL-12/23p40, IL-12p70, IL-1β, IFN-γ, IL-6, IL-17A, AGP, SDF-1, SAA, CRP and ustekinumab in patients in endoscopic remission (blue) and non-responders (red). Results are shown as the median concentrations with interquartile range.
Evolution of biomarker concentrations in endoscopic remitters
In patients achieving endoscopic remission, serum concentrations of IL-12/23p40 and IL-12p70 significantly increased from baseline (week 0) to week 8 (p < 0.001 and p < 0.0001, respectively) and to week 24 (p < 0.0001 and p < 0.05, respectively). Serum concentrations of IL-1β significantly increased from baseline (week 0) to week 8 (p < 0.05) but significantly decreased again from weeks 8 to 24 (p < 0.01). Concentrations of IL-17A and AGP significantly decreased from baseline (week 0) to week 8 (p < 0.05 for both), and concentrations of IFN-γ significantly decreased from baseline (week 0) to week 8, and from baseline (week 0) to week 24 (p < 0.05 for both) to values that were similar to those observed in healthy controls. Ustekinumab and IL-6 concentrations decreased significantly from week 8 to week 24 (p < 0.05 for both). Serum concentrations of CRP significantly decreased from baseline (week 0) to week 8 and to week 24 (p < 0.05 and p < 0.01, respectively) and faecal calprotectin concentrations did not significantly change over time.
Evolution of biomarker concentrations in patients not responding to ustekinumab treatment
In patients not responding to ustekinumab treatment, serum concentrations of IL-12/23p40 and IL-12p70 significantly increased from baseline (week 0) to week 8 (p < 0.0001 for both) and to week 24 (p < 0.0001 and p < 0.01, respectively). Concentrations of IL-17A and SDF-1 significantly decreased from baseline (week 0) to week 8 (p < 0.05 for both) and concentrations of SAA, IFN-γ and IL-17A significantly decreased from baseline (week 0) to week 24 (p < 0.05 for all). The decrease in concentrations of SDF-1 but not IFN-γ, SAA and IL-17A resulted in values similar to those observed in healthy controls. Ustekinumab concentrations decreased significantly from weeks 8 to 24 (p < 0.05). Serum concentrations of CRP and faecal calprotectin concentrations did not significantly change over time.
Relative changes in biomarker concentrations in endoscopic remitters
Patients who achieved endoscopic remission had a significantly greater relative median increase in IL-1β concentrations from baseline (week 0) to week 8 (+71.6% versus +0%, p < 0.05), and a decrease in IL-1β concentrations from week 8 to week 24 (−48.4% versus −14.1%, p < 0.01), and decrease in CRP concentrations from baseline (week 0) to week 8 (−57.1% versus 15.7%, p < 0.05) compared with those who did not respond to treatment. For all other biomarkers, changes in serum concentrations over time were not significantly different between remitters and non-responders.
Comparison of biomarker concentrations at individual time points during treatment between endoscopic remitters and non-responders
Absolute serum biomarker concentrations at weeks 8 and 24 during ustekinumab treatment were compared between endoscopic remitters and non-responders (Figure 4 and Supplemental Figure 3).

Median serum biomarker, CRP and faecal calprotectin concentrations at week 8 and week 24 of treatment in patients achieving endoscopic remission (n = 19) and non-responders (n = 41). Serum concentrations of AGP, IL-6, SAA, IFN-γ, LBP, IL-22, IL-1β, ustekinumab, CRP and faecal calprotectin in patients in endoscopic remission (white bars) and non-responders (dark grey bars).
At week 8, patients achieving endoscopic remission had significantly lower levels of AGP, SAA, IFN-γ, LBP and IL-22, compared to non-responders (p < 0.01 for AGP and SAA, and p < 0.05 for IFN-γ, LBP and IL-22). In endoscopic remitters, week 8 serum concentrations of AGP, SAA, IFN-γ, LBP and IL-22 were similar to those observed in healthy controls (data not shown). At week 24, patients achieving endoscopic remission had significantly lower levels of AGP, IFN-γ, LBP, IL-22 and IL-6 compared to non-responders (p < 0.001 for AGP, p < 0.01 for IL-22, IL-6 and IFN-γ, and p < 0.05 for LBP). In endoscopic remitters, week 24 serum concentrations of AGP, IFN-γ, LBP, IL-22 but not IL-6 were similar to what was observed in healthy controls (data not shown). Notably, AGP, SAA, IFN-γ, LBP, IL-22, IL-6 and IL-1β are almost all correlated with each other (Supplemental Table 2). For all other biomarkers, no significant differences between the two response groups were observed at any of the individual time points (Supplemental Figure 3).
With respect to CRP and faecal calprotectin, at week 8, patients achieving endoscopic remission had significantly lower levels of faecal calprotectin (p < 0.01) but not CRP (p = 0.206) compared to patients not responding to ustekinumab treatment. At week 24, patients achieving endoscopic remission had significantly lower levels of faecal calprotectin and CRP (p < 0.01 for both) compared to non-responders. In this study cohort, patients achieving endoscopic remission had significantly higher ustekinumab concentrations at week 8 compared to non-responders (9.9 versus 5.9 µg/mL, p < 0.05). This was however not the case at week 24 (3.4 versus 2.6 µg/mL, p = 0.332; Figure 3). Regarding individual ustekinumab levels in the non-responders, one patient had undetectable ustekinumab levels at both week 8 and week 24, and another patient had an undetectable ustekinumab level at week 24.
Evaluation of the diagnostic potential of the biomarkers relative to that of CRP and faecal calprotectin
AUROC analyses of single biomarkers for identification of patients in endoscopic remission
AUROC analyses were performed to compare the ability of the different biomarkers, relative to CRP and faecal calprotectin, to identify patients in endoscopic remission (Figure 5). The seven biomarkers (i.e. AGP, SAA, IFN-γ, LBP, IL-22, IL-1β and IL-6) for which a significant difference was observed in absolute serum concentrations between endoscopic remitters and non-responders at either weeks 8 or 24 of ustekinumab treatment (Figure 4) were included in the analysis.

Area under the receiver operating characteristic (AUROC) curve analyses for identifying patients in endoscopic remission based on concentrations of IL-6, SAA, IFN-γ, LBP, IL-22, IL-1β, AGP, CRP, fCAL and ustekinumab at week 8 (a) and week 24 (b). The legend shows the AUROC and 95% confidence interval (CI) for each individual marker.
At week 8 of treatment and among the seven evaluated serum biomarkers, SAA had the highest AUROC (95% CI) with a value of 0.761 (0.640–0.882, p = 0.001), and AGP had the second highest AUROC (95% CI) with a value of 0.733 (0.597–0.869, p < 0.01) for identifying patients in endoscopic remission (Figure 5(a)), which were however not different from each other (p = 0.765). The AUROC (95% CI) of CRP and faecal calprotectin at week 8 were 0.630 (0.447–0.813, p = 0.200) and 0.869 (0.743–0.994, p < 0.001), respectively, and were significantly different from each other (p < 0.05). However, the AUROC of SAA was not statistically different from that of CRP or faecal calprotectin (SAA versus CRP, p = 0.105; SAA versus faecal calprotectin, p = 0.251), while the AUROC of AGP was statistically different from that of CRP but not from that of faecal calprotectin (AGP versus CRP, p < 0.05; AGP versus faecal calprotectin, p = 0.851).
At week 24 of treatment and among the seven evaluated biomarkers, AGP had the highest AUROC (95% CI) with a value of 0.760 (0.632–0.888, p = 0.001), and IFN-γ had the second highest AUROC (%95 CI) with a value of 0.748 (0.614–0.880, p < 0.01) for identifying patients in endoscopic remission (Figure 5(b)), which were not different from each other (p = 0.899). The AUROC (95% CI) of CRP and faecal calprotectin at week 24 was 0.713 (0.576–0.850, p < 0.01) and 0.893 (0.777–1.000, p < 0.01), respectively, and were significantly different from each other (p < 0.01). Furthermore, the AUROC of AGP was not statistically different from that of faecal calprotectin (p = 0.606), but it was significantly different from that of CRP (p < 0.01). The AUROC of IFN-γ was not statistically different from either CRP or faecal calprotectin (IFN-γ vs CRP, p = 0.504; IFN-γ versus faecal calprotectin, p = 0.089).
AUROC analyses were also performed on relative changes of biomarker concentrations over time. With respect to concentration changes from baseline (week 0) to week 8, an increase in IL-1β concentration could identify patients in endoscopic remission with an AUROC (95% CI) value of 0.688 (0.543–0.833, p < 0.05). With respect to concentration changes from week 8 to week 24, a decrease in IL-1β could identify patients in endoscopic remission with an AUROC (95% CI) value of 0.714 (0.576–0.853, p < 0.01). With respect to concentration changes from baseline (week 0) to week 8, a decrease in CRP concentration could identify patients in endoscopic remission with an AUROC (95% CI) value of 0.733 (0.582–0.885, p < 0.05). For all other serum biomarkers and faecal calprotectin, relative concentration changes over time could not distinguish patients in endoscopic remission from patients not responding to ustekinumab treatment (data not shown).
Finally, the correlation between these biomarkers and the concentrations of CRP and faecal calprotectin, was investigated (Supplemental Table 2). At week 8, a significant positive correlation was observed between CRP and IL-6, SAA, IFN-γ, LBP and IL-22 (p < 0.01 for IL-6; p < 0.001 for SAA, IFN-γ and LBP; and p < 0.05 for IL-22) but not with AGP and IL-1β (p = 0.668 and p = 0.953, respectively). On the other hand, at week 8, faecal calprotectin correlated positively with IL-6, SAA, IFN-γ, LBP, IL-22, AGP and CRP (p < 0.05 for IL-6 and LBP; p < 0.01 for SAA and AGP, p < 0.001 for IFN-γ, IL-22 and CRP). At week 24, a significant positive correlation was observed between CRP and SAA, IFN-γ, LBP and IL-22 (p < 0.05 for IL-22; p < 0.001 for SAA, IFN-γ and LBP), and faecal calprotectin correlated positively with IL-6, SAA, AGP and CRP (p < 0.05 for IL-6, AGP and CRP; p < 0.01 for SAA).
AUROC analyses of combinations of biomarkers for identification of patients in endoscopic remission
We also investigated whether the combination of biomarkers could be superior in discriminating endoscopic remitters from non-responders. ROC curves for the combination of biomarkers were constructed based on binary logistic regression (Figure (6)), with combinations based on the two biomarkers with the highest AUROC in the single biomarker analyses (AGP and SAA for week 8; AGP and IFN-γ for week 24; Figure 5) and CRP and faecal calprotectin.
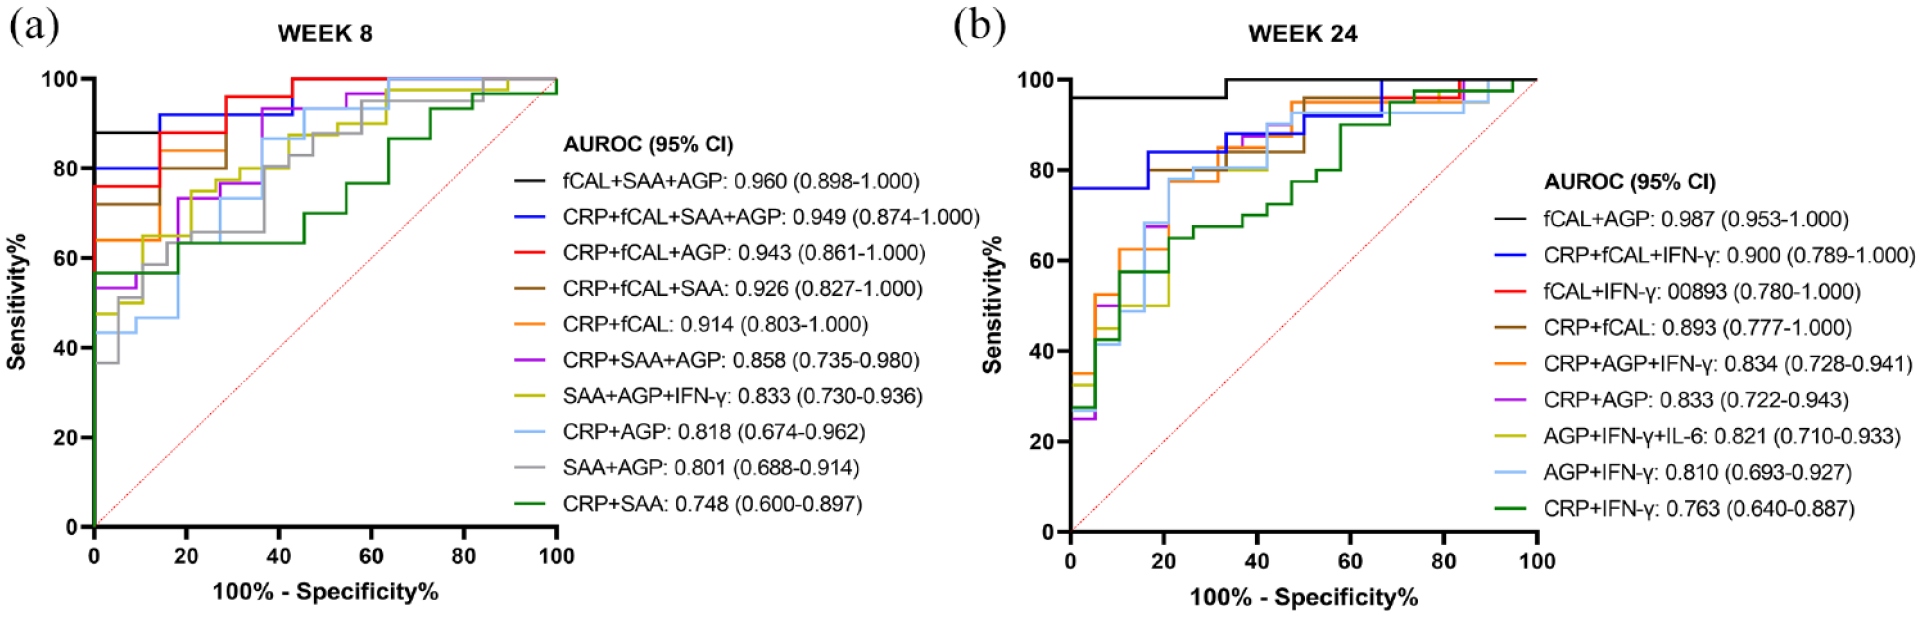
AUROC curve analyses for identifying patients in endoscopic remission based on combinations of SAA, AGP, CRP and faecal calprotectin at week 8 (a), and on combinations of AGP, IFN-γ, CRP and faecal calprotectin at week 24 (b).
At week 8 of treatment (Figure 6(a)), the combined measurement of faecal calprotectin with SAA and AGP had the highest AUROC (95% CI) of 0.960 (0.898–1.000, p < 0.0001). Furthermore, combining SAA and AGP did not significantly increase the AUROC as compared to the single biomarker measurement (SAA versus SAA+AGP, p = 0.390; and AGP versus SAA+AGP, p = 0.300), also not when combined with a third serum biomarker (e.g. SAA versus SAA+AGP+IFN-γ, p = 0.191; and AGP versus SAA+AGP+IFN-γ, p = 0.092). Combining CRP with SAA did not significantly increase the AUROC as compared to CRP alone (CRP versus CRP+SAA, p = 0.130). However, the combination of CRP with AGP increased the AUROC significantly as compared to CRP alone (CRP versus CRP+AGP, p < 0.01), but this AUROC could not be further increased with addition of SAA to the combination (CRP+AGP versus CRP+AGP+SAA, p = 0.271), or even not with addition of a third biomarker to the combination (CRP+AGP versus CRP+AGP+SAA+IFN-γ, p = 0.298). In contrast, combining CRP and SAA with AGP, or AGP and IFN-γ, increased the AUROC significantly as to CRP combined with SAA alone (CRP+SAA vs CRP+SAA+AGP, p < 0.05; and CRP+SAA versus CRP+SAA+AGP+IFN-γ, p < 0.05). Combining CRP with faecal calprotectin significantly increased the AUROC in comparison with CRP alone (CRP versus CRP+fCAL, p < 0.05), but this combination was not superior to the other biomarker combinations with CRP. None of the combination predictions were however superior to the measurement of faecal calprotectin alone for discriminating endoscopic remitters from non-responders at week 8 of ustekinumab treatment.
At week 24 of treatment (Figure 6(b)), the highest AUROC (95% CI) of 0.987 (0.953–1.000) was obtained by four combinations with faecal calprotectin and AGP (fCAL+AGP; fCAL+AGP+IFN-γ; CRP+fCAL+AGP; and CRP+fCAL+AGP+IFN-γ; p < 0.0001 for all). Also here, combining the biomarkers with the highest AUROC from Figure 5(b) (AGP and IFN-γ) did not significantly increase the AUROC as compared to the single biomarker measurement (AGP vs AGP+IFN-γ, p = 0.253; and IFN-γ versus AGP+IFN-γ, p = 0.317), and neither when combined with a third biomarker (e.g. AGP versus AGP+IFN-γ+IL-6, p = 0.204; and IFN-γ versus AGP+IFN-γ+IL-6, p = 0.299). Combining CRP with IFN-γ did not significantly increase the AUROC as compared to CRP alone (CRP versus CRP+IFN-γ, p = 0.273). However, the combination of CRP with AGP increased the AUROC significantly as compared to CRP (CRP versus CRP+AGP, p < 0.01), but this AUROC could not be further increased with addition of IFN-γ to the combination (CRP+AGP versus CRP+AGP+IFN-γ, p = 0.480). Furthermore, and similar to week 8 of treatment, the combination of CRP with faecal calprotectin was significantly different as compared to CRP alone (CRP versus CRP+fCAL, p < 0.05). Also at week 24, none of the biomarker combination predictions showed to be superior to the measurement of faecal calprotectin alone for identification of endoscopic remitters.
Discussion
Endoscopy is the current standard approach for accurately assessing treatment response, which is, in the case of ustekinumab therapy for CD, usually performed before start and after 24 weeks of treatment. However, endoscopy is an invasive procedure, is time-consuming and expensive, not without risk, and burdensome for the patient. 6 Non-invasive pharmacodynamic biomarkers could aid the physician in monitoring response to treatment and optimizing therapeutic outcomes in CD patients. Blood-based biomarkers are preferred over faecal biomarkers as they are more convenient in terms of specimen sampling, storage and processing and have the patient’s preference. This study therefore evaluated the concentration of serum cytokines and acute phase proteins in CD patients during treatment with ustekinumab and their relation to endoscopic remission.
At individual time points during treatment, absolute serum concentrations of several biomarkers could distinguish patients achieving endoscopic remission from non-responders. With respect to the evaluated acute phase proteins, serum concentrations of AGP, LBP and SAA were found to be significantly lower in patients achieving endoscopic remission. These three proteins have previously been shown to be markers of disease activity in CD.15–17 Moreover, a study by Yarur et al. showed that in a cohort of 94 anti-TNF treated CD patients, SAA concentrations were significantly lower in patients with mucosal healing. 18 With respect to the evaluated cytokines, serum concentrations of IL-6, IFN-γ and IL-22 were also significantly decreased in endoscopic remitters compared to non-responders. Lower IL-6 values have been associated with treatment response to anti-TNF agents.18,19 In a phase III trial including patients treated with anti-IL-23p19 therapy, baseline (week 0) IL-22 values could identify patients achieving endoscopic remission. 20 Overall, the findings of our study highlight the potential use of measuring the acute phase proteins AGP, SAA, LBP and the cytokines IFN-γ, IL-6 and IL-22 to monitor endoscopic remission to ustekinumab in CD patients and optimize therapeutic outcomes.
Through AUROC curve analyses, SAA at week 8 and AGP at week 24 were identified as the two blood-based biomarkers with the highest AUROC value for distinguishing patients achieving endoscopic remission. The AUROC values were however not statistically different from the values of CRP, except for AGP, or faecal calprotectin, indicating that SAA and AGP are at least as good as CRP or faecal calprotectin for monitoring of treatment response in CD patients on ustekinumab therapy. Currently, faecal calprotectin, and its combination with CRP, is the most frequently used biomarker for monitoring disease activity and therapeutic response in IBDs, although its accuracy is not perfect, and associations between faecal calprotectin, CRP and endoscopic disease activity have been shown to appear inconsistent.21,22 Furthermore, several studies have suggested that single biomarkers are unlikely to be accurate enough for monitoring endoscopic disease activity, and that a combination of different biomarkers might substitute such single-marker approaches in the future.21–23 We therefore also explored whether combining biomarkers would increase the ability to discriminate between endoscopic remitters and non-responders. AUROCs could however not be increased significantly by combining different biomarkers, as compared to the single biomarkers, and also none of the investigated combinations was superior to faecal calprotectin alone in discriminating endoscopic remitters from non-responders. Combining CRP with one or more other serum biomarkers however increased the AUROC significantly as compared to CRP alone, although none of the combinations could be considered better than faecal calprotectin or the combination of CRP with faecal calprotectin. Interestingly, a study by Bourgonje et al. 24 also showed that a combination of four serum biomarkers, which outperformed CRP and faecal calprotectin, does have the potential to be used for monitoring of endoscopic disease activity in IBD patients.
Next to biomarkers, the measurement of drug concentrations has also been proposed as a tool to monitor response to treatment. 25 Ustekinumab concentrations at week 8 were significantly higher in endoscopic remitters compared to non-remitters with a median value of 10.3 µg/mL versus 5.9 µg/mL. These ustekinumab concentrations are slightly higher than what is reported in literature but can be explained by the use of a more stringent outcome in our study, that is, a SES-CD score ⩽1 compared to a 50% SES-CD decrease (8.5 versus 6.4 µg/mL ustekinumab) or a SES-CD score ⩽3 (5.7 versus 4.5 µg/mL ustekinumab).13,26 In general, more ambitious outcomes require higher drug concentrations. Although slightly numerically higher ustekinumab concentrations were noted at week 24 in endoscopic remitters compared to non-remitters, the difference did not reach significance. These results are in line with a study by Verstockt et al. 13 In contrast, Adedokun and colleagues did observe a significant difference in week 24 ustekinumab levels but with clinical remission as the evaluated outcome. 27 Since in our study drug trough levels were not identified as one of the serum biomarkers with highest AUROC value for distinguishing patients achieving endoscopic remission, no further analyses were performed on their combination with the inflammatory markers. However, combining drug trough levels might be an interesting topic to further investigate in future studies on blood-based biomarkers for monitoring endoscopic disease activity and therapy response, also for other biological therapies than ustekinumab.
The real-life cohort, the serial serum samples and the assessment of not only a 16-protein panel but also CRP, faecal calprotectin and ustekinumab levels are the major strengths of this study. Two important limitations are the retrospective and exploratory nature of the study and the inclusion of only two selective patient populations, that is, patients achieving endoscopic remission and patients not responding to ustekinumab treatment, while patients achieving only a partial response to treatment were excluded. Furthermore, the included patient population consisted of a somewhat higher proportion of women and mainly included patients of Caucasian ethnicity. Also, patients achieving endoscopic remission at week 24 had a lower baseline SES-CD score, CRP and faecal calprotectin levels than non-responders. The higher baseline inflammatory burden might be a reason why patients did not achieve endoscopic remission when treated with the standard ustekinumab dosing regimen. Finally, because the study cohort is comprised entirely of ustekinumab-treated patients, it is unknown whether these findings are applicable for patients treated with other biological therapies.
Our results demonstrate that a combination of serum inflammatory biomarkers might have the potential to monitor endoscopic disease activity and treatment response in ustekinumab-treated CD patients. Therefore, it is important that larger retrospective and prospective studies in real-world CD patient populations including biological-naïve patients are performed to confirm our findings and to identify serum concentration cut-offs associated with endoscopic remission, before these markers or combinations thereof could be used to monitor treatment response in clinical practice. In the future, validating and implementing the measurement of reliable blood-based biomarkers, next to or in combination with faecal calprotectin and/or CRP, might lead to reliable treatment response assessment with less invasive procedures. This may also lead to an improved disease monitoring adherence in CD patients.
Conclusion
In this study, serum concentrations of AGP, SAA, LBP, IFN-γ, IL-6 and IL-22 during ustekinumab treatment could help identifying patients achieving endoscopic remission. Although not superior to faecal calprotectin, these pharmacodynamic biomarkers hold potential as tools to monitor treatment response to ustekinumab and optimize therapeutic outcomes. Especially, the added value of monitoring a combination of blood-based biomarkers warrants further investigation to assess their diagnostic potential in relation to endoscopic disease activity measurements.
Supplemental Material
sj-docx-1-tag-10.1177_17562848231189110 – Supplemental material for Evaluation of serum cytokines and acute phase proteins as possible pharmacodynamic biomarkers to monitor endoscopic remission during ustekinumab therapy in patients with Crohn’s disease
Supplemental material, sj-docx-1-tag-10.1177_17562848231189110 for Evaluation of serum cytokines and acute phase proteins as possible pharmacodynamic biomarkers to monitor endoscopic remission during ustekinumab therapy in patients with Crohn’s disease by Nathalie Van den Berghe, Dahham Alsoud, Bram Verstockt, Séverine Vermeire, Paul Declerck and Debby Thomas in Therapeutic Advances in Gastroenterology
Footnotes
References
Supplementary Material
Please find the following supplemental material available below.
For Open Access articles published under a Creative Commons License, all supplemental material carries the same license as the article it is associated with.
For non-Open Access articles published, all supplemental material carries a non-exclusive license, and permission requests for re-use of supplemental material or any part of supplemental material shall be sent directly to the copyright owner as specified in the copyright notice associated with the article.