
Abstract
Background:
Rising prevalence of gastroesophageal reflux disease (GERD) in US Veterans is concurrent with increasing excess body weight.
Objective:
The objective of this cross-sectional study is to examine relationships between dietary macronutrients, gastrointestinal hormones, and GERD status.
Methods:
Ninety-eight veterans with overweight/obesity and empiric proton pump inhibitor (PPI) treatment were enrolled from the Tennessee Valley Healthcare System. Subjects had esophageal manometry and 24-h pH monitoring. Subjective symptoms were assessed with Gastroesophageal Reflux Disease Questionnaire (GERDQ) and Symptom Assessment Scale (GSAS). The primary outcomes, total acid exposure time (AET) and number of reflux episodes, enabled categorizing subjects as either pathologic GERD or inconclusive GERD. Data analysis included independent T-tests, Spearman Rho correlations, and multivariable linear regression modeling.
Results:
Higher intake of sugar-sweetened beverages (sugar-sweetened tea, soda, and fruit juice) associated with higher AET. Higher saturated-to-unsaturated fat intake is associated with higher AET and number of reflux episodes. Overall, sugar-sweetened beverage intake, saturated-to-unsaturated fat ratio, tomato-based food items, glucagon-like polypeptide 1 (GLP-1) level, time of first meal, and education status accounted for a significant amount of the variability in AET. Pathologic GERD subjects reported more heartburn (p = 0.006), regurgitation (p = 0.01), acid taste (0.001), and nausea severity (p = 0.04). GERDQ score associated with AET (r = 0.31, p = 0.005), but GSAS did not (r = 0.12, p = 0.28).
Conclusion:
Of the many foods and nutrients tested, the type (not amount) of carbohydrate (simple sugars) and the type (not amount) of fat (saturated vs unsaturated fat) consumed associated with objective and/or subjective GERD testing. These novel findings contribute to the evidence base guiding specific dietary recommendations in the clinical management of GERD.
Introduction
Gastroesophageal reflux disease (GERD) is the most common outpatient diagnosis and the most common inpatient discharge diagnosis for gastrointestinal (GI) disorders in US healthcare systems.1,2 Overall, spending for GERD is more than $10 billion in the United States and the Department of Veterans Affairs healthcare system spends ~$149 million on outpatient prescriptions for GERD treatment annually with 40–45% of US veterans diagnosed with GERD.3–5 Concurrent with the increasing prevalence of GERD in the US civilian and veteran population, there has been a steep rise in the prevalence of excess body mass. Indeed, 78% of US Veterans are now categorized as overweight or obese based on body mass index (BMI).6,7 High BMI or obesity is an established risk factor for GERD, 8 as it may increase the percentage of time with esophageal pH < 4.0 and the total number of acid reflux episodes experienced.9,10 The cause for the increased prevalence of GERD in high body mass remains speculative.
It has long been thought that several dietary factors (acidic foods such as tomato or citrus, spicy foods, mint, chocolate, caffeine, carbonated sodas, and alcohol) may precipitate GERD symptoms either by acting as mucosal irritants, by affecting gastric pH, or by reducing lower esophageal sphincter (LES) pressure.11–15 In addition, dysmotility secondary to delayed esophageal clearance rate or delayed gastric transit time (GTT) may promote reflux due to prolonged retention of food and stimulation of increased acid secretion.16–18 Furthermore, higher abdominal obesity, particularly excess intra-abdominal (visceral) fat, increases risk for developing esophagitis, Barrett’s esophagus, and esophageal adenocarcinoma.2,19–21 The role of visceral fat may be related to increased secretion of humoral factors including the adipokines tumor necrosis factor (TNF)-α and interleukin (IL)-6 or activity of hormones, such as ghrelin, leptin, and insulin, which have been associated with Barrett’s esophagus and GERD.22–25 Ghrelin also acts as a stimulator of gastric emptying, and an impaired response to ghrelin and leptin in obesity may adversely affect gastric motility. 26 Other hormonal factors that may be involved in the relationship between dietary intake, overweight/obesity, and GERD include glucagon-like polypeptide 1 (GLP-1) signaling, which may inhibit gastric emptying,27,28 and gastrin which stimulates acid release in the stomach and increases LES tone.29–31
Historically, recommendations to avoid certain food items derive from anecdote or data from hospitalized patients with the most severe forms of GERD (erosive esophagitis and adenocarcinoma).32–34 Thus, there remains little definitive evidence to support recommendations to avoid specific foods as a component of primary prevention or standard of care empiric treatment of GERD. 35 More recent investigation of dietary factors has targeted macronutrient composition of the diet rather than specific food items. While results for the relationship between dietary fat intake and GERD symptoms have been inconsistent,36–43 prospective trials show that lower carbohydrate intake is associated with decreased GERD symptoms and/or esophageal reflux,44–47 whereas higher carbohydrate intake is associated with more GERD symptoms and number of reflux episodes. 48 Although, a 2017 meta-analysis showed consuming more indigestible carbohydrate (dietary fiber) may reduce the risk of Barrett’s esophagus in persons with GERD, 49 investigation of dietary fiber as the mechanism driving the effect of dietary carbohydrates on GERD has yielded inconclusive results.50,51 Nevertheless, interpretation of the published data suggests that modifying either carbohydrate amount or type may be beneficial for treatment of GERD.
The purpose of this study is to determine relationships between dietary macronutrient intake, GI hormones, and GERD status in US veterans empirically treated with proton pump inhibitors (PPIs). Recognizing that the pathophysiology of GERD is multifactorial, we hypothesized that both objective GERD status (determined by total acid exposure time (AET) and number of reflux episodes) and subjective symptoms would correlate most robustly with consumption of specific types of dietary carbohydrate and fat. We further hypothesized that relationships between dietary intakes and GERD status would be mediated by GI hormones that may affect GTT or LES pressure.
Materials and methods
Study design and population
This study is a cross-sectional analysis of baseline data (Supplemental Figure) from veterans enrolled in a randomized controlled trial to test the effects of dietary carbohydrate amount and type on GERD signs and symptoms. To be included, veterans had a diagnosis of GERD documented in their electronic health record upon assessment by their attending physician of the cardinal GERD symptoms of heartburn and reflux. In addition, potential subjects had to be aged ⩾21 years, have a BMI of 25–45 kg/m2, and be receiving prescription for PPIs (omeprazole or pantoprazole) for ⩾3 months from the outpatient pharmacy at the Tennessee Valley Healthcare System (TVHS, Department of Veterans Affairs, Nashville, TN). Subjects were recruited via posted flyers in the TVHS primary-care outpatient clinics and a study-specific advertisement played weekly on the internal TVHS television system. In addition, an HIPAA waiver allowed prescreening via phone calls from lists generated from the VA Informatics and Computing Infrastructure (VINCI) database based on outpatient pharmacy prescription. Potential subjects were excluded if they had a diagnosis of type-1 diabetes, esophageal stricture, extra-esophageal GERD, Barrett’s esophagus, gastroparesis or esophageal motility disorders, esophageal adenocarcinoma or other cancer, or a history of esophageal or bariatric surgery. Subjects were also excluded if they had a hiatal hernia >5 cm, food allergies or dietary restrictions, GI malabsorption, alcohol consumption averaging more than two drinks a day during the 3 months prior to enrollment, or were pregnant or lactating. The study was approved by the VA Tennessee Valley Healthcare System (IRB#676769-14) and the Vanderbilt University Medical Center (IRB#141715) Institutional Review Boards and registered at ClinicalTrials.gov (
Dietary intake and body composition
Dietary intake was assessed by averaging three 24-h diet recalls obtained within 10 days of the baseline visit that included two nonconsecutive weekdays and one weekend day. Recalls were performed by two trained dietitians at the Vanderbilt Diet, Body Composition, and Human Metabolism Core using the validated USDA 5-step multi-pass methodology,52,53 a standardized script, measuring utensils, and computer-generated prompts, while dietary data were being directly entered into the Nutrition Data System for Research software (NDS-R, v. 2018, Nutrition Coordinating Center, Minn, MN). The NDS-R database includes more than 18,000 foods and ingredients which generates values for 174 nutrients, nutrient ratios, and other food components. Whole body scans were acquired for total and regional measurements of fat, lean, and bone masses using a Lunar iDXA (GE Healthcare, Chicago, IL). Scans and anthropometric measures (height, weight, waist, and hip circumference) were performed at the Vanderbilt Clinical Research Center by one research technician certified in densitometry.
Objective GERD testing: 24-h ambulatory pH monitoring
Following standard clinical practice instructions, acid-suppressive medications were discontinued for 7 days prior to ambulatory pH monitoring.54,55 Testing was performed using a combined MII-pH monitoring device (Sandhill Scientific, Inc; Highlands Ranch, CO) comprising a data recorder (Sleuth System; Sandhill Scientific, Inc) and a 2.1 mm diameter polyvinyl catheter embedded by one pH and six impedance sensors at predefined positions. The pH sensors were calibrated before placement using standardized buffer solutions per manufacturer instructions. The catheter was placed intranasally so that the esophageal pH sensor was positioned 5 cm above the manometrically defined upper border of the LES. Intraluminal impedance was measured at 3, 5, 7, 9, 15, and 17 cm above the LES. Data sampling frequency for both impedance and pH sensors are 50 Hz. Data were analyzed using BioView Analysis software (Sandhill Scientific, Inc) with reflux episodes identified by computerized detection of proximally directed decreases in impedance. Tracings were also manually reviewed by an experienced gastroenterologist (MFV) to confirm accuracy and correct errors. Total, upright and supine reflux events were recorded. Acid reflux events were defined as those with pH ⩽ 4.0 and non- or weakly acid reflux events at pH > 4.0. The primary outcomes were percent total AET in 24 h and total number of reflux episodes.
Subjective GERD testing
The type, frequency, and severity of GERD symptoms were assessed using the GERD Symptom Assessment Scale (GSAS) and the Gastroesophageal Reflux Disease Questionnaire (GERDQ). The GSAS assesses frequency, severity, and distress of 15 GERD symptoms. Internal consistency of the GSAS is >0.80 for symptom severity and symptom distress scales.56,57 The GERDQ is a 6-item self-administered questionnaire designed to differentiate patients with occasional versus frequent symptoms on the day of assessment; two items assess impact of GERD symptoms on daily life and four items are used to monitor and evaluate the impact of treatment. 58 Both questionnaires were administered in the morning prior to pH sensor placement.
Clinical data
Blood was drawn on the same morning in a 10-hour fasted state. Female subjects had serum β-hCG pregnancy testing. Plasma glucose (glucose oxidase method) and insulin (radioimmunoassay method) were analyzed at the TVHS Clinical Pathology Laboratory. HOMA-IR (Homeostatic Model Assessment of Insulin Resistance) score was calculated from glucose and insulin values. Serum gastrin was assessed by immunochemiluminometric assay at LabCorp (Burlington, NC). Glucagon and GLP-1 were assessed by Luminex multiplex assay and ghrelin (total and active acylated form) by radioimmunoassay at the Vanderbilt Diabetes Hormone Core Laboratory.
Statistical analysis
Descriptive analysis for continuous variables is presented as mean and standard error. Categorical variables are presented as number and frequency. PPI usage (dose and frequency) was converted to omeprazole units for analyses. Missing data were omitted from analysis. Univariate analysis was performed using Spearman Rho correlation coefficients. Multivariable linear regression modeling was performed for the primary outcomes of total AET and GTT. Modeling included the potential confounding factors of age and BMI. Upon completion of these analyses, subjects were divided into two phenotype groups based on Lyon Consensus criteria: subjects categorized as Pathologic GERD had pH < 4.0 for ⩾6% AET and/or ⩾80 reflux episodes and subjects categorized as Inconclusive GERD had pH < 4.0 for <6% AET and/or <80 reflux episodes. 55 Power analysis using an independent t-test showed that with 40 or more subjects per group, if the true mean difference in AET is ⩾6.4 and the standard deviation is 10.0, we would be able to reject the null hypothesis that the population means of the two groups are equal with a probability (power) of 0.82. Continuous variables were compared between the two groups using t-tests and categorical variables by Pearson’s chi-square analysis. All statistical analysis was performed using SPSS version 28 (IBM Corp, Montauk, NY). P values of <0.05 were considered statistically significant. All authors had access to the study data and reviewed and approved the final manuscript.
Results
Of 339 veterans who were assessed for eligibility, 163 met inclusion/exclusion criteria and were scheduled for baseline testing visits (Supplemental Figure). Of the scheduled 163, 55 did not show up, 4 pulled their pH catheter out, 3 had undiagnosed hernias, and 3 had severe gag reflex preventing catheter placement. Of the 98 who completed baseline testing, 83.0% were male, about half (54.6%) were Caucasian, the average age was 58.1 ± 1.0 years, the average BMI was 32.8 ± 0.6 kg/m2, and the average waist circumference was 108.9 ± 1.8 cm. There were no significant differences in demographic or anthropometric variables between GERD phenotype groups (Table 1). The frequency of PPI administration (Pathologic GERD: 78% daily/22% twice daily; Inconclusive GERD: 75% daily/25% twice daily, χ2 = 0.28, p = 0.60) did not differ between groups nor did the average PPI dosage (pathologic GERD: 32.9 ± 2.8 mg/d vs inconclusive GERD: 28.5 ± 1.7 mg/d, omeprazole units, p = 0.23). There was also no difference in the frequency of over-the-counter antacid medication use between groups (pathologic GERD: 1.2 ± 1.2 vs inconclusive GERD: 1.6 ± 1.2, days/week, p = 0.17). No subjects were taking histamine 2 receptor antagonists (H2RAs) for GERD.
Demographic and anthropometric characteristics of overweight/obese veterans empirically treated for GERD.
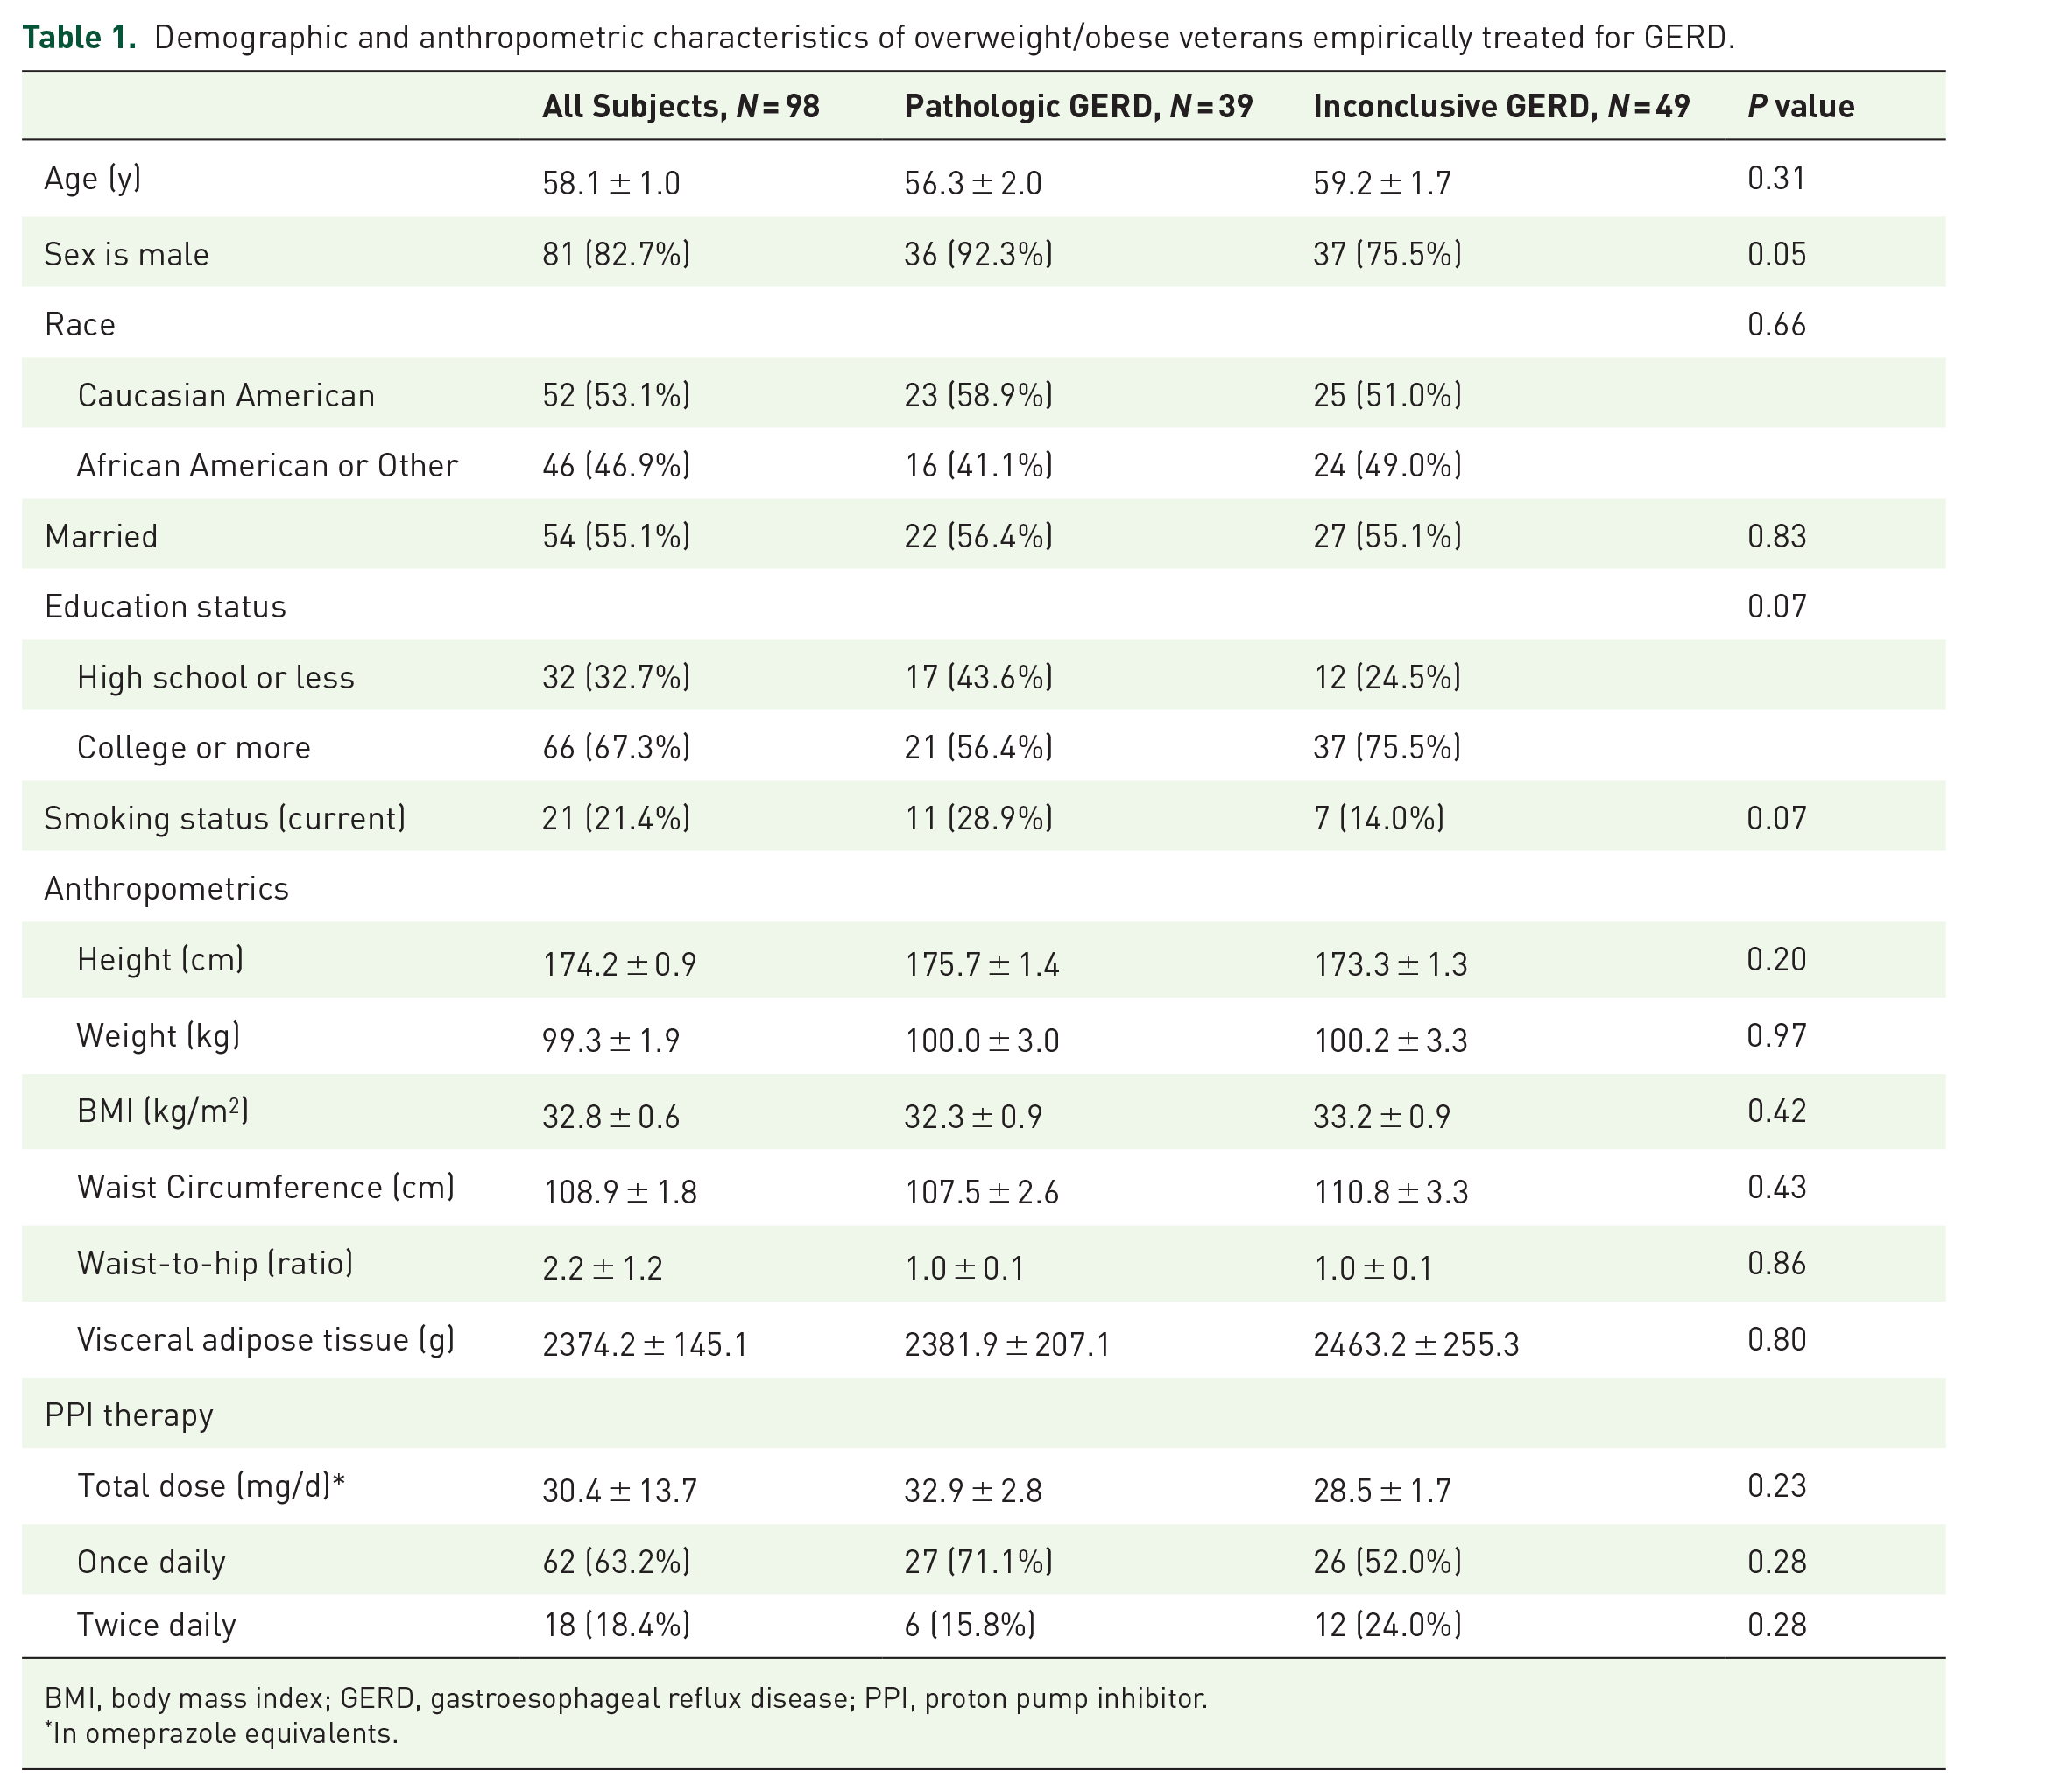
BMI, body mass index; GERD, gastroesophageal reflux disease; PPI, proton pump inhibitor.
In omeprazole equivalents.
The average basal LES pressure was 32.2 ± 2.9 mmHg (range: 3.2–106.4 mmHg). Basal LES pressure was inversely associated with AET (r = –0.53, p < 0.001) and total number of reflux episodes (r = −0.42, p = 0.002). A significant difference in basal LES pressure was observed between Pathologic and Inconclusive GERD groups (21.7 ± 3.9 mmHg vs 39.2 ± 4.0 mmHg, p = 0.001). Overall, 44.3% of subjects met criteria for Pathologic GERD. Total AET was 13.3 ± 3.4% in Pathologic GERD subjects compared to 4.1 ± 0.6% in Inconclusive GERD subjects (p < 0.001). Pathologic GERD subjects had 4.4 times as many reflux episodes during the 24-h ambulatory pH testing period as Inconclusive GERD subjects (Tables 2). Figure 1(a)–(e) presents comparisons between GERD phenotype groups for LES and pH variables.
Objective measures of GERD status in veterans with GERD and overweight/obesity.

LES, lower esophageal sphincter.

Comparison of objective ambulatory pH testing outcomes in veterans with overweight/obesity: (a) basal LES pressure, (b) total acid exposure time, pH < 4.0, (c) total number of reflux episodes, (d) number of reflux episode >5 min, and (e) upright and recumbent time, pH < 4.0.
Dietary energy intake averaged 2405.0 ± 122.9 kcal/d with a composition of 39.3 ± 9.2% of calories from dietary fats, 43.7 ± 11.9% of calories from carbohydrates, and 16.8 ± 6.7% of calories from protein (Table 3). No significant associations were detected for the relationships between average daily amount of food (grams per day) consumed, energy intake (calories), protein intake, amount of fat intake, amount of carbohydrate intake, and AET or total number of reflux episodes. However, higher intake of sugar-sweetened beverages (sugar-sweetened tea, soda, and fruit juice) was significantly associated with higher AET (r = 0.30, P = 0.01). Indeed, the Pathologic GERD group reported greater consumption of sugar-sweetened beverages (sugar-sweetened tea, soda, and fruit drinks: 4.7 ± 1.4 vs 2.1 ± 0.6 servings/day). The Pathologic GERD group also reported greater consumption regarding the number of servings of solid food items high in simple sugars (cake, cookies, and candy) consumed per day (3.6 ± 1.1 vs 1.3 ± 0.3, p = 0.02). The total amount of simple sugars (mono- and di-saccharides) consumed and the amount of sucrose consumed trended toward significantly higher consumption in the Pathologic GERD group. Although there were no significant associations between total dietary fiber intake, soluble fiber intake, insoluble fiber intake, and AET or total number of reflux episodes, there was a statistical trend observed for higher consumption of total, soluble and insoluble dietary fiber in the Inconclusive GERD group who reported greater consumption of whole grain–type breads and crackers (2.3 ± 0.5 vs 1.4 ± 0.4 servings/day).
Dietary intake and gastrointestinal hormone data from veterans with GERD and overweight/obesity.
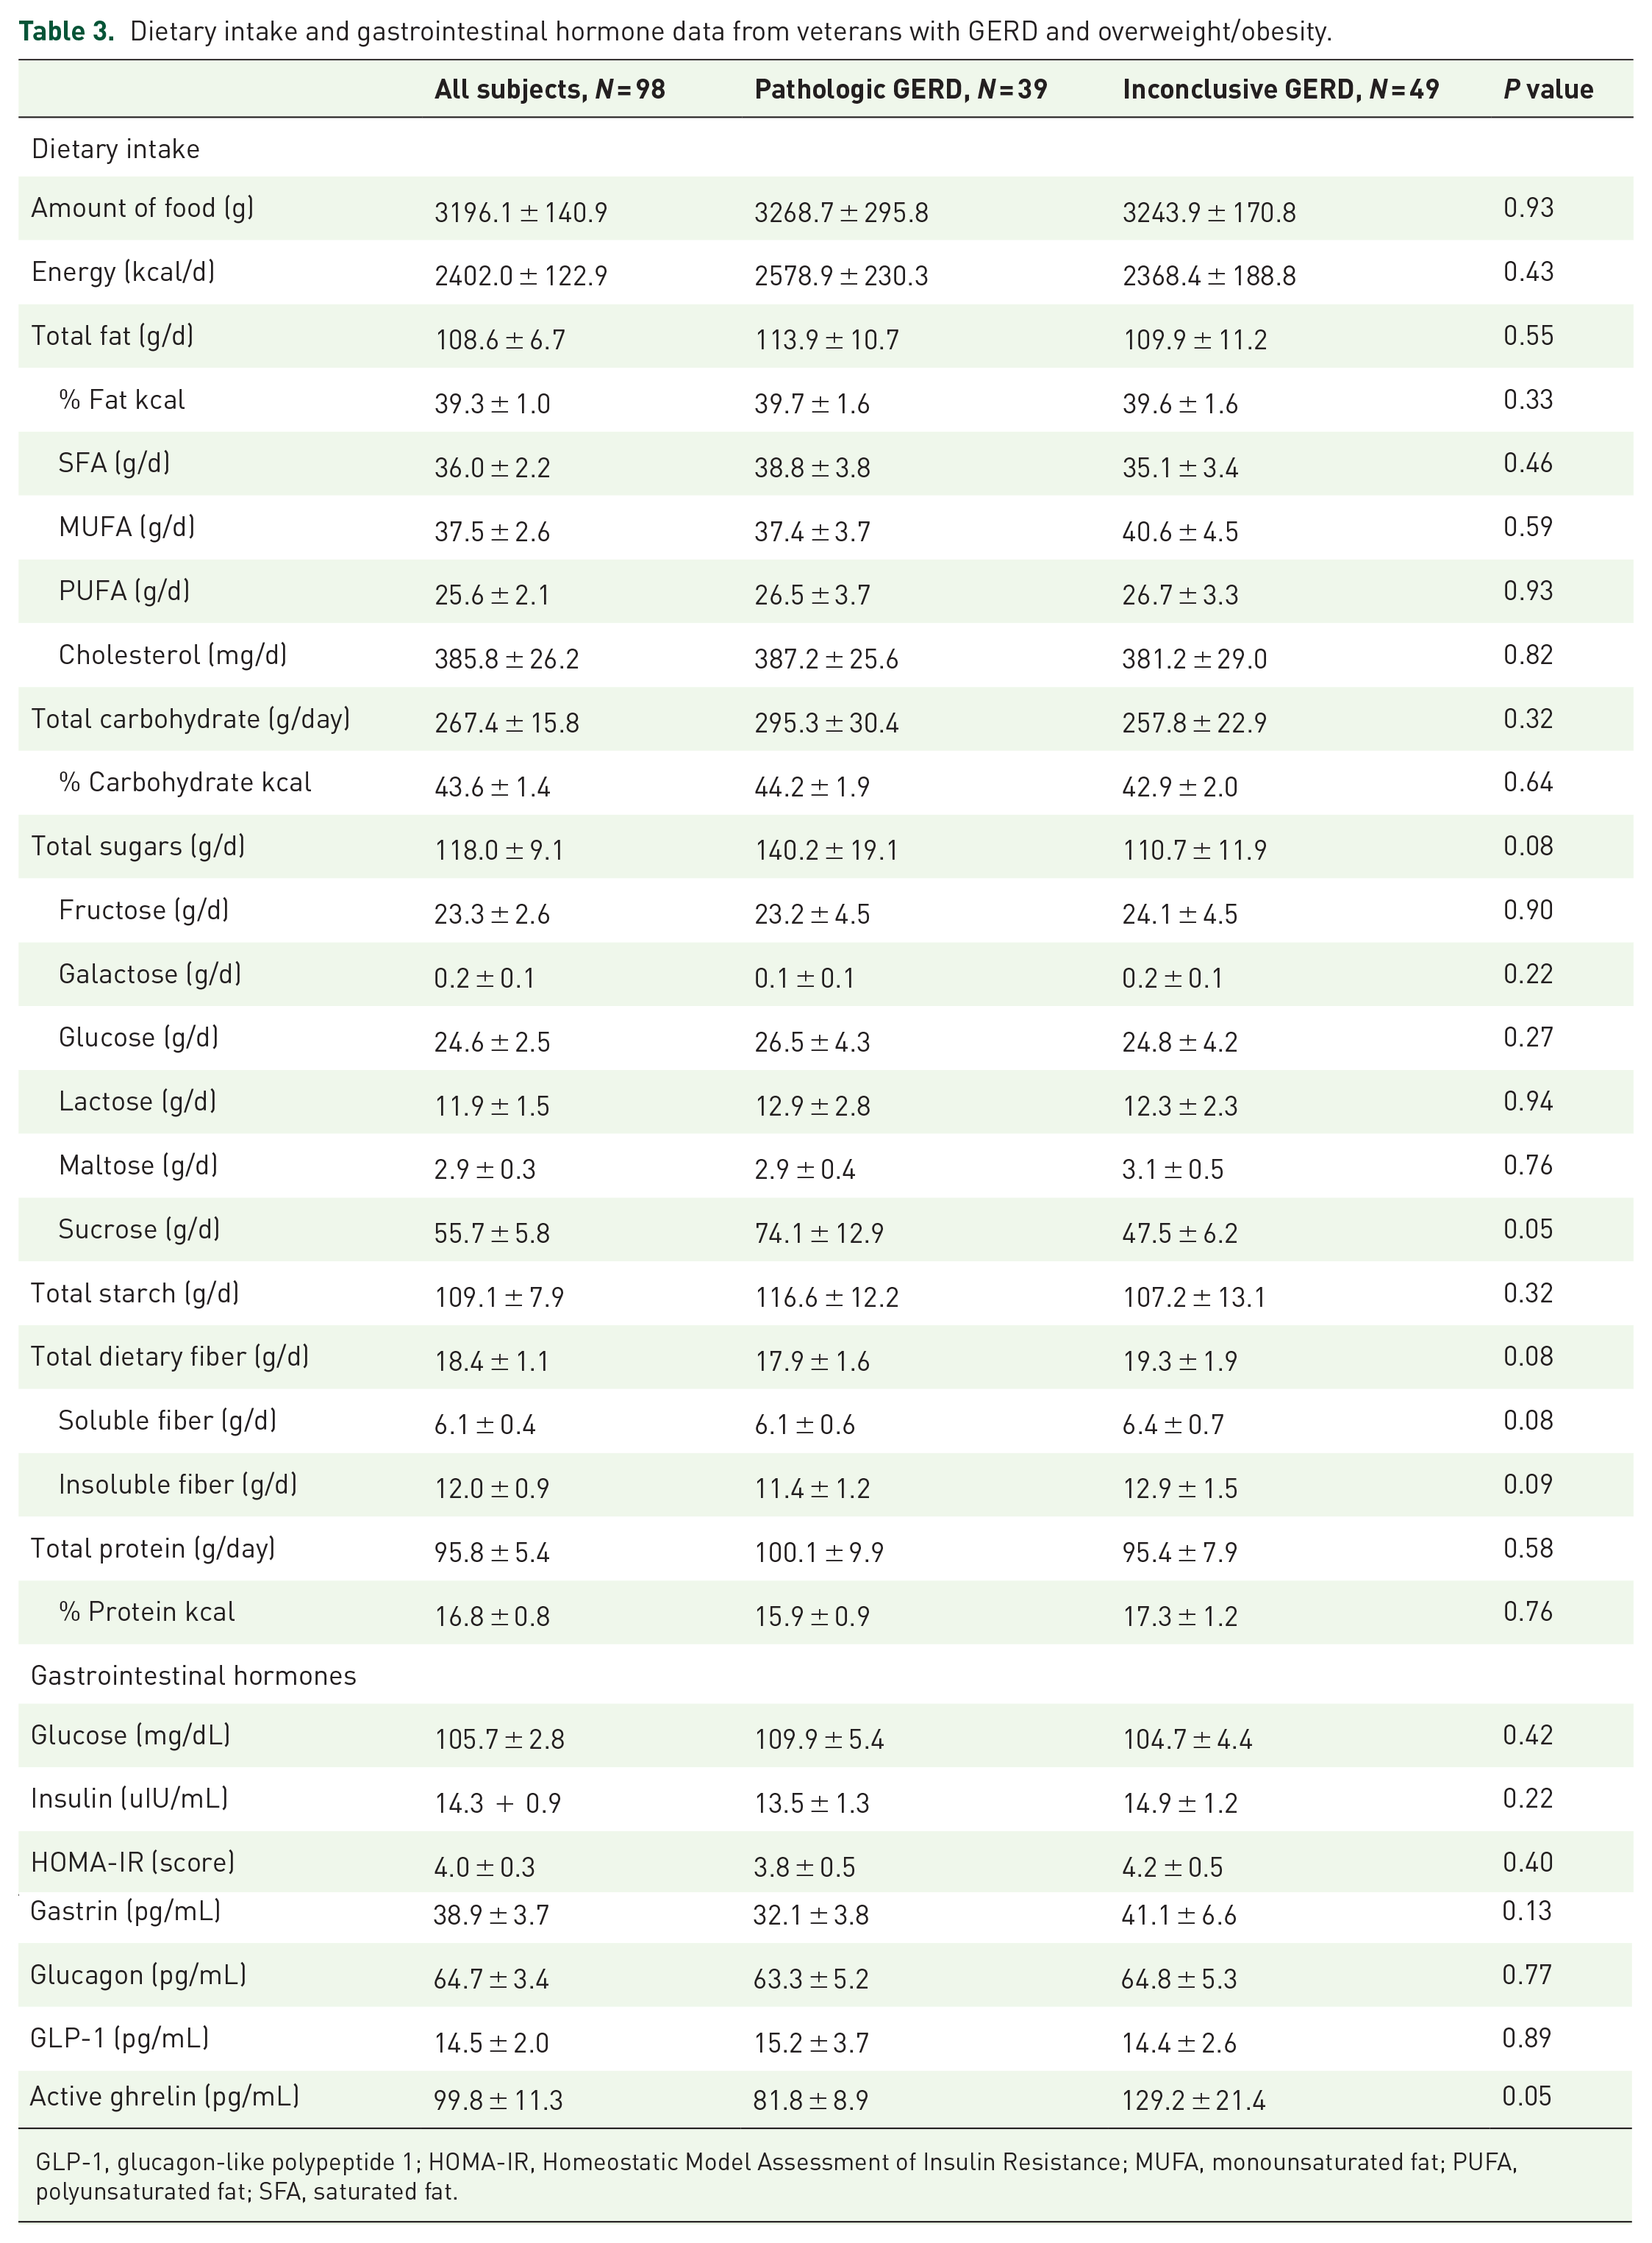
GLP-1, glucagon-like polypeptide 1; HOMA-IR, Homeostatic Model Assessment of Insulin Resistance; MUFA, monounsaturated fat; PUFA, polyunsaturated fat; SFA, saturated fat.
A higher ratio of dietary unsaturated-to-saturated fat intake was associated with lower AET (r = –0.32, p = 0.01), total number of reflux episodes (r = –0.29, p = 0.02), and upright AET (r = –0.35, p = 0.005). Furthermore, higher intake of dietary polyunsaturated fat (PUFA) was associated with lower upright AET (r = –0.26, p = 0.04). Comparison between the Inconclusive and Pathologic GERD groups showed a significant difference in average daily proportion of unsaturated to saturated fat intake (p = 0.03). Of the specific foods investigated (Figure 2), tomato consumption was inversely associated with total number of reflux episodes (r = –0.31, p = 0.01), number of reflux episodes >5 min (r = –0.29, p = 0.02), recumbent AET (r = –0.25, p = 0.04), and trended toward significance for AET (r = –0.22, p = 0.07).

Comparison of average daily intake of food groups and trigger foods in veterans with overweight/obesity: (a) total amount of food consumed (grams/day), (b) total energy consumed (kcal/day), (c) macronutrient intakes (%/kcal), and (d) average number of servings of trigger food groups consumed.
Although BMI was positively correlated with total fat intake (r = 0.25, p = 0.03), monounsaturated fat (MUFA) intake (r = 0.34, p = 0.003), and PUFA intake (r = 0.26, p = 0.03), there was no significant association observed between BMI and AET (r = –0.15, p = 0.18) or number of reflux episodes (r = –0.09, p = 0.45). No other anthropometric or body composition measures were significantly associated with AET or total number of reflux episodes. While both active and total ghrelin appeared to be higher in the Inconclusive GERD group, there were no statistically significant differences in baseline GI hormone levels between GERD groups. Likewise, there were no significant univariate associations between GI hormones and AET, even though several dietary factors associated with hormone levels, including relationships between ghrelin and percent of calories consumed as protein (r = 0.26, p = 0.04; r = 0.23, p = 0.05, respectively), fruits (r = 0.46, p < 0.001), chocolate (r = –0.27, p = 0.03), fried foods (r = –0.31, p = 0.01), and sodas (r = –0.35, p = 0.004). It is likely that the physiological mechanism whereby type of carbohydrate and type of fat would influence AET and total number of reflux episodes is via stimulating the release of GI hormones such as ghrelin, gastrin, and glucagon-like peptide-1 that affect secretion of gastric acid and thereby decrease LES pressure and increase transient LES relaxations.31,59,60
Univariate relationships between objective and subjective assessment of GERD status (Table 4) showed that the GERDQ score was positively associated with AET (r = 0.31, p = 0.005), total number of reflux episodes (r = 0.32, p = 0.003), and upright AET (r = 0.28, p = 0.01). The specific GERDQ components of heartburn frequency (r = 0.36, p = 0.001), regurgitation (r = 0.28, p = 0.01), sleep disturbance frequency (r = 0.22, p = 0.04), and the use of over-the-counter medications (r = 0.30, p = 0.007) also significantly associated with AET (Supplemental Table 2) and total number of reflux episodes. While the GSAS total score was not significantly associated with AET (r = 0.12, p = 0.28), the GSAS components of heartburn frequency (r = 0.48, p < 0.001), heartburn severity (r = 0.35, p = 0.001), acid taste in mouth frequency (r = 0.42, p < 0.001), and acid taste in mouth severity (r = 0.25, p = 0.02) were positively associated with AET. The ratio of saturated-to-unsaturated fat intake was significantly associated with GERDQ acid taste in the mouth (r = 0.24, p = 0.04), GSAS heartburn frequency (r = 0.25, p = 0.04), and GSAS heartburn severity (r = 0.31, p = 0.01). The Pathologic GERD group had higher GERDQ total scores (p = 0.02) and reported greater heartburn frequency (p = 0.006), and a tendency toward greater frequency of sleep disturbance (p = 0.12) (Figure 3(a), (b)). There was no significant difference between groups on the GSAS total score (Figure 3(c)–(e)), but the Pathologic GERD group reported greater heartburn frequency (p = 0.02) and severity (p = 0.006), greater regurgitation frequency (p = 0.03), greater acid taste in the mouth frequency (p = 0.001), and greater nausea severity (p = 0.04).
Subjective symptom assessment of GERD status in veterans with GERD and overweight/obesity.


Comparison of Subjective Testing by GERDQ and GSAS Questionnaires in Veterans with Overweight/Obesity: (a) GERDQ Total Score, (b) GERDQ Items Score, (c) GSAS Total Score, (d) GSAS Items Frequency Scores, and (e) GSAS Items Severity Scores.
In multivariable regression analyses, accounting for age and BMI, the most parsimonious model (p < 0.01) showed that sugar-sweetened beverage intake, ratio of unsaturated to saturated fat intake, tomato-based food intake, GLP-1 level, time of first meal during the 24-h testing period, and education status accounted for 38.9% of the variability in AET (Table 5).
Results from multivariable linear regression modeling for the outcome of esophageal acid exposure time in veterans empirically treated for GERD.

Discussion
Despite a long history of providing dietary recommendations to avoid ‘trigger foods’ in routine clinical practice for GERD, little objective evidence exists supporting most recommendations. Interestingly, recent small studies have shown fewer reflux episodes, less esophageal acid exposure, and reduced AET, when consuming lower carbohydrate meals.45,48 In this cohort of veterans on PPIs for empiric treatment of GERD, one unique and remarkable finding was that the type (as opposed to amount) of carbohydrate associated with objective GERD status. Scientifically, the types of carbohydrate (the macronutrient typically comprising the majority of calories consumed) are categorized based on chemical structure: monosaccharides, often referred to as simple sugars, versus oligosaccharides and polysaccharides, referred to as complex carbohydrates. We observed that consumption of sugar-sweetened beverages (sugar-sweetened tea, soda, and fruit juice) associated with total AET. Notably, sugar-sweetened beverages are a major source of added simple sugars in the American diet. One typical 12-ounce serving of sugar-sweetened tea contains 5–6 teaspoons of added simple sugars, a typical 12-ounce can of soda contains nine teaspoons of added simple sugars, and a typical 10-ounce bottle of sweetened fruit juice contains 7–8 teaspoons of added simple sugars. National guidelines recommend limiting added simple sugar intake to 6–12 teaspoons per day due to the relationship with chronic diseases.61,62
In the context of avoiding ‘trigger foods’, a common recommendation has been to avoid dietary fats. It is hypothesized that high-fat foods, particularly fried foods, would affect hormonal mediators of LES tone such as cholecystokinin. However, large epidemiological investigation using NHANES data showed no association between fat intake and GERD symptoms, 41 and comparison of consuming a high-fat to a low-fat meal showed no difference in LES pressure. 40 These prior studies targeted the amount of dietary fat (total grams or percentage of energy calories), rather than distinguishing the type of fat.40–43 Like carbohydrate, types of dietary fats are categorized based on chemical structure – carbon chain length and degree of saturation. Another novel and thought-provoking finding of this study is that AET and total number of reflux episodes associated specifically with the ratio of saturated-to-unsaturated (MUFA and PUFA) fat intake. The ratio of saturated-to-unsaturated fat intake was also significantly associated with the commonly reported GERD symptoms of heartburn (frequency and severity) and acid taste in the mouth. Focusing on the type of fat, rather than amount, may be an important distinction to incorporate in clinical recommendations as we also observed no association between GERD status and the amount of fat consumed.
Curiously, lower consumption of tomato-based foods was inversely associated with GERD status in the Pathologic GERD subjects. It is likely that these subjects, who reported greater frequency of heartburn, reflux, and regurgitation, were intentionally avoiding tomatoes and tomato-based food products. We did not observe food avoidance for other items typically considered ‘trigger foods’. It remains confusing that recent evidence suggests consuming certain acidic foods may actually reduce GERD symptoms by adding hydrogen ions in the stomach that suppress additional acid production – although this has only been observed in the context of low simple sugars intake. 63
Although our veteran cohort was overweight (34% BMI 25.0–29.9) or obese (66% BMI ⩾ 30) and much evidence suggests a dose-dependent relationship between high body mass and GERD status,8,9,12–15,41 we observed only a trend for a significant association between BMI and GERD. It is noteworthy that in several of these studies, the linear relationship between BMI and GERD appears to plateau at BMI > 30 kg/m2. Indeed, a study of 223 patients showed the relationship between BMI and esophageal acid exposure was non-linear and S-shaped, with the strongest effect at BMI 25–30 kg/m2 and the strength of relationship declining at BMI > 30.10,64 Investigating other indices of obesity, such as percent body fat or body fat distribution, may be more useful in populations with high BMI.
Based on results from two widely used subjective assessment tools, we also observed that the GERDQ total score, but not the GSAS total score, was significantly associated with objective pH results, suggesting that the GERDQ may be a better tool for empiric PPI initiation. One explanation for this finding may be that the GERDQ was designed to focus on frequency of symptoms while the GSAS targets severity, a more subjective construct, and includes assessment of more extra-esophageal or laryngopharyngeal symptoms. Notably, Pathologic GERD subjects reported greater frequency of heartburn, regurgitation, acid taste in the mouth, and severity of nausea. The symptoms most frequently reported by the Pathologic GERD subjects might need further diagnostic workup to determine mechanisms of symptom generation. 54 For example, both GERD and dyspepsia are commonly occurring GI conditions in the general population that may share common pathophysiology and have overlapping symptoms but are distinct disorders. 65
A limitation of our study is the cross-sectional design which does not elucidate causation. Another limitation is that all diet assessment methods are subject to under- or over-reporting. However, the study dietitian had extensive experience in the 5-step multi-pass 24-h diet recall methodology, and several studies have shown validity and reliability of the method employed,52,53 particularly when using additional training and tools for portion size estimation. Finally, our study subjects are predominantly male and were overweight or obese which reflects the US veteran population but may limit the generalizability of the results. Nevertheless, these novel findings offer noteworthy insights that may be applicable to other high-risk populations.
In summary, several distinct findings have been uncovered in this study that can inform clinical management of GERD. One novel finding was that the type of carbohydrate, simple sugars in the form of sugar-sweetened beverages, was significantly associated with total AET. Another unique finding was that the type of fat, saturated versus unsaturated fat, was significantly associated with total AET and number of reflux episodes. Moreover, dietary saturated versus unsaturated fat intake was significantly associated with commonly reported symptoms of GERD. These findings underscore the importance of investigating not simply the amounts of macronutrients but the types of carbohydrates and fats consumed, and they indicate integration of recommendations to reduce or avoid simple sugars and saturated fats as part of dietary management of GERD. Surprisingly, despite decades of recommendations to avoid several foods and food ingredients, the only specific food items that associated with objective pH monitoring or subjective GERD assessments in this cohort were consumption of sugar-sweetened tea and tomato-based food products. Yet, these findings do not imply that consumption of other ‘trigger’ foods should be encouraged. A significant proportion of this cohort of veterans on empiric PPI treatment were categorized as Inconclusive GERD based on lower AET and number of reflux episodes, and thus, the true response to all known trigger foods remains in need of further investigation. Finally, we found that the GERDQ was a better predictor of objectively measured GERD status than the GSAS, and thus, has the potential to be used more reliably in empiric assessment of GERD in veterans.
Supplemental Material
sj-docx-2-tag-10.1177_17562848221101289 – Supplemental material for Objective ambulatory pH monitoring and subjective symptom assessment of gastroesophageal reflux disease show type of carbohydrate and type of fat matter
Supplemental material, sj-docx-2-tag-10.1177_17562848221101289 for Objective ambulatory pH monitoring and subjective symptom assessment of gastroesophageal reflux disease show type of carbohydrate and type of fat matter by Cihang Gu, Timothy Olszewski, Michael F. Vaezi, Kevin D. Niswender and Heidi J. Silver in Therapeutic Advances in Gastroenterology
Supplemental Material
sj-docx-3-tag-10.1177_17562848221101289 – Supplemental material for Objective ambulatory pH monitoring and subjective symptom assessment of gastroesophageal reflux disease show type of carbohydrate and type of fat matter
Supplemental material, sj-docx-3-tag-10.1177_17562848221101289 for Objective ambulatory pH monitoring and subjective symptom assessment of gastroesophageal reflux disease show type of carbohydrate and type of fat matter by Cihang Gu, Timothy Olszewski, Michael F. Vaezi, Kevin D. Niswender and Heidi J. Silver in Therapeutic Advances in Gastroenterology
Supplemental Material
sj-jpg-1-tag-10.1177_17562848221101289 – Supplemental material for Objective ambulatory pH monitoring and subjective symptom assessment of gastroesophageal reflux disease show type of carbohydrate and type of fat matter
Supplemental material, sj-jpg-1-tag-10.1177_17562848221101289 for Objective ambulatory pH monitoring and subjective symptom assessment of gastroesophageal reflux disease show type of carbohydrate and type of fat matter by Cihang Gu, Timothy Olszewski, Michael F. Vaezi, Kevin D. Niswender and Heidi J. Silver in Therapeutic Advances in Gastroenterology
Footnotes
Acknowledgements
The authors thank the veterans who volunteered to participate.
Author contribution(s)
Funding
The authors disclosed receipt of the following financial support for the research, authorship, and/or publication of this article: This study was funded by VA Merit Award #CX001009-05.
Conflict of interest statement
The authors declared no potential conflicts of interest with respect to the research, authorship, and/or publication of this article.
Supplemental material
Supplemental material for this article is available online.
References
Supplementary Material
Please find the following supplemental material available below.
For Open Access articles published under a Creative Commons License, all supplemental material carries the same license as the article it is associated with.
For non-Open Access articles published, all supplemental material carries a non-exclusive license, and permission requests for re-use of supplemental material or any part of supplemental material shall be sent directly to the copyright owner as specified in the copyright notice associated with the article.