
Abstract
Background:
The loss of response to adalimumab (ADL) has been related to low serum concentrations at trough. Currently, most methods commercially available for the quantification of ADL are enzyme-linked immunosorbent assay (ELISA) based, with a turnaround time of approximately 8 h, delaying the target dosage adjustment to the subsequent infusion. In this study, we aimed to evaluate the performance of the newly available rapid-test ADL quantification assay by comparing it with three established ELISA methods, using spiked samples and a set of clinical samples.
Methods:
Spiked samples from control donors and 120 serum samples from inflammatory bowel disease (IBD) patients undergoing ADL therapy were quantified using lateral flow Quantum Blue® Adalimumab and, the ELISA formats from Immundiagnostik, R-Biopharm and an in-house assay.
Results:
The rapid-test assay had intraclass correlation coefficients of 0.590, 0.864 and 0.761 when comparing with the Immundiagnostik, R-Biopharm and in-house assays, respectively. For the five therapeutic windows, the accuracy was high: ADL rapid test compared with the Immundiagnostik (58–88%); R-Biopharm, 68–89%; and in house, 60–88%; and kappa statistics revealed 0.492–0.602, 0.531–0.659 and 0.545–0.682, respectively.
Conclusions:
The Quantum Blue® Adalimumab assay can replace the commonly used ELISA-based ADL quantification kits and it is a reliable alternative to these methods. This rapid-test assay enables the quantitative determination of ADL serum trough level in only 15 min. The developed assay allows measurement of ADL over a wide range. Hence, it represents a valuable tool for the clinician to assess the ADL trough level.
Introduction
Biological therapies using antitumour necrosis factor alpha (anti-TNFα) monoclonal antibodies (mAbs) are extensively prescribed for inflammatory bowel disease (IBD) patients. Adalimumab (ADL) was the first fully humanized anti-TNFα mAb approved for the treatment of IBD. This mAb is able to bind with a high affinity and specificity to TNFα, thereby blocking its interaction with the p55 and p75 cell-surface TNF receptors.1–3 ADL mechanisms of action include the downregulation of pro-inflammatory cytokines, the induction of T-cell apoptosis and the reduction of leucocyte and lymphocyte migration to the sites of inflammation.4,5
Despite ADL proven efficacy in the treatment of IBD, about 10–30% of all patients fail to respond favourably to the induction phase of the ADL therapy (primary nonresponders) and up to 50% of initial responders lose their clinical response over time (secondary nonresponders).6,7 This loss of response has been related to low serum trough ADL concentrations; in fact, different studies have reported a clear correlation between serum drug concentrations and clinical response, with IBD patients in clinical remission demonstrating higher median levels of ADL than those with active disease. 8 Still, an optimal ADL cut-off value, from a therapeutic perspective, remains to be established; whereas some investigators argue that levels above 4.9 μg/ml9–11 can predict clinical remission, others suggest that levels above 5.85 μg/ml12,13 and above 7.5 μg/ml14,15 are able to predict clinical response. In the absence of a specific cut-off, an ADL therapeutic window of 5–12 μg/ml is a generally accepted desirable goal.16–18
Several factors can interfere with the pharmacokinetics and pharmacodynamics of therapeutic mAbs: albumin, body weight, sex, smoking, disease severity and immunogenicity (with formation of antidrug antibodies) are known to alter mAb availability and overall metabolism.9,19,20 Therapeutic drug monitoring (TDM) comprises assessment of drug and antidrug antibody levels during mAb therapy. This knowledge allows the optimization of treatment by adjusting drug serum levels in such a way that a minimal efficacious dosage is maintained while adverse effects are minimized. Moreover, TDM can also be used to determine the causes of loss of response to treatment (i.e. low serum levels of the drug or high levels of antidrug antibodies, among other scenarios), allowing informed decision making concerning the patients’ therapy. In addition to its therapeutic benefit, TDM can also avoid unnecessary therapeutic interventions, consequently enhancing cost effectiveness of the therapeutic process.21–24
TDM relies on an accurate quantification of the drug and antidrug antibodies from the patients’ serum, and several methods have been developed to achieve it. The most common one is the enzyme-linked immunosorbent assay (ELISA), in which the biopharmaceutical is captured on a plate and detected using a secondary antibody; alternative methods include those based on fluid-phase radioimmunoassay, reporter-gene assay, enzyme immunoassay, homogenous mobility shift assay and liquid chromatography–tandem mass spectrometry.25–28 However, these techniques require highly trained staff. Moreover, the time from sampling to result reading is often too long to allow an immediate therapeutic adjustment, which is therefore delayed till the patients’ next consultation. Considering this, the development of rapid-test assays is highly useful: these systems allow an on-site and almost immediate reading of the analytical results. The Quantum Blue® Adalimumab (BÜHLMANN Laboratories AG, Schönenbuch, Switzerland) test is a new assay for ADL quantification: this rapid test allows quantitative determination of the drug levels from patients’ serum in 15 min, allowing an immediate drug dosage adjustment (should it prove necessary). 29
In this study, we aim to evaluate the performance of the Quantum Blue® Adalimumab quantification assay. To do so, its performance was compared with that of three established ELISA methods in the assessment of exogenously spiked and clinical samples.
Material and methods
Samples and patients
Clinical samples were obtained from IBD patients immediately before an ADL infusion (trough levels): blood samples were collected, centrifuged, and serum samples were kept at −80°C until being processed. Spiked samples of known ADL concentrations (1.5, 4.8, 8.0, 11.3, 14.5, 17.8, 21.0, 24.3, 27.5, 30.8 and 34.0 µg/ml) were generated by diluting the appropriate amount of exogenous ADL (Humira®, AbbVie Inc., North Chicago, IL, USA) into a pool of serum from control donors.
This study was approved by the Ethics Committees of all involved institutions, and all patients signed a written informed consent prior to their participation.
ADL quantification assays
ADL quantifications using the Quantum Blue® Adalimumab assay, hereafter referred to as Quantum Blue® Adalimumab, were carried out adhering to the manufacturers’ instructions. Briefly, serum samples were diluted 1:20 and 80 µl aliquot was loaded into the port of the test cartridge. After incubation for 15 min, the cartridge was read and the results were shown on the Quantum Blue® Adalimumab reader display. The test information and calibration curve for each specific cartridge lot was provided with a chip card to each test kit. According to the manufacturer, this kit has the following analytical characteristics: the limit of detection is 0.8 µg/ml, and the lower and upper limits of quantification are 1.3 µg/ml and 35 µg/ml, respectively.
The following assays were used as standards in the ADL quantification: the IDKmonitor® ADL drug level ELISA kit (Immundiagnostik AG, Bensheim, Germany), hereafter referred to as Immundiagnostik; the RIDASCREEN®ADM Monitoring (R-Biopharm AG, Darmstadt, Germany), hereafter referred to as R-Biopharm; and an in-house procedure. The quantifications using Immundiagnostik and R-Biopharm were performed strictly following manufacturers’ instructions, whereas the in-house procedure was carried out as previously described by Ben-Horin et al.30,31 Briefly, serum samples were diluted (1:100) and added to a plate precoated with TNFα (Peprotech, Rocky Hill, NJ, USA). After 60 min of incubation and an appropriate number of washes, a horseradish peroxidase (HRP)-labelled goat antihuman fragment-crystallizable (Fc) antibody (MP Biomedicals, Solon, OH, USA) was added and the plate was incubated for 60 min. Afterwards, tetramethylbenzidine (Millipore, MA, USA) substrate was added, and the reaction was stopped 3 min later with 2 mol/l H2SO4. Lastly, the samples’ absorbance was read at 450/540 nm, and the ADL concentration was quantified by interpolating the absorbance values in a standard curve built with known concentrations of exogenous ADL. According to the manufacturer, the Immundiagnostik kit has the following analytical characteristics: the lower and upper limits of quantification are the limit of blank × sample dilution factor and the highest concentration of the standard curve × sample dilution factor, respectively. For the R-Biopharm, the lower and upper limits of quantification are 0.5 and 12 µg/ml. For the in-house procedure, the upper limit of quantification was calculated as the highest concentration of the standard curve × the sample dilution factor used. Whenever the results obtained were above these limits of quantification, samples were additionally diluted to obtain linear results within the measuring range of the assays.
Each spiked concentration was repeated between 9 and 13 times and analysed in duplicate. All measurements were carried out by the same researcher.
Statistical analyses
Continuous variables were described using the median, percentile and minimum/maximum value. The reliability between methods was assessed by calculating the intraclass correlation coefficients (ICCs) and the corresponding 95% confidence intervals (CIs). Values less than 0.5 are indicative of poor reliability, values between 0.5 and 0.75 indicate moderate reliability, values between 0.75 and 0.9 indicate good reliability and values greater than 0.90 indicate excellent reliability. 32
Moreover, Bland and Altman plots were used to compare the different techniques. For analysis purposes, the results of all patients’ samples measured by the Quantum Blue® Adalimumab for which the concentrations were below or above the limits of quantification (1.3 µg/ml and 35 µg/ml, respectively) were considered to be those same limits. The accuracy and kappa statistics were computed based on five different therapeutic windows of ADL (⩽3 μg/ml, 3–6.85 μg/ml, >6.85 μg/ml; 33 ⩽4.90 μg/ml, >4.90 μg/ml;10,11 ⩽5.85 μg/ml, >5.85 μg/ml;12,13 ⩽7.50 μg/ml, >7.50 μg/ml;14,15 and ⩽5 μg/ml, 5–12 μg/ml, >12 μg/ml16–18). Statistical significance was considered whenever p values were below 0.05. All data were arranged, processed, and analysed with SPSS® version 24 (Statistical Package for Social Sciences, IBM Corp., Armonk, NY).
Results
Study population
This cohort enrolled 120 samples of 89 IBD patients under ADL therapy whose clinical characteristics are depicted in Table 1. The female proportion of the population was 42%, and 22% of all patients were current smokers. A total of 95.5% of the patients were Crohn’s disease patients. All patients were on maintenance phase. A total of 36 patients were medicated with azathioprine (40.4%) and 76 patients (85.4%) were or had been under steroids. Moreover, 35 patients were dependent on steroids and three were steroid resistant.
Cohort characterization.

Data not available for all subjects. Missing values for smoking status, n = 5.
Quantitative analysis
In order to compare the quantification assays’ intravariability and recovery rates, 11 exogenously spiked samples ranging from 1.5 to 34 μg/ml were quantified using the different methods (Figure 1). The results suggest that the assays yield closer results for lower concentrations, with the standard deviations ranging from 0.3 to 10.6 for the Immundiagnostik, 0.1–7 for the R-Biopharm, 0.74–9.31 for the in-house method, and 0.38–9.66 for the Quantum Blue® Adalimumab. Intrasample variability was calculated for each assay showing a mean of intra-assay coefficient of variation (CV) of 24%, 13%, 29% and 24% for Immundiagnostik, R-Biopharm, in house and Quantum Blue® Adalimumab, respectively. The average recovery rates were 111% (range 65–163%), 113% (range 84–149%), 110% (range 92–132%) and 85% (range 76–98%) for the Immundiagnostik, R-Biopharm, in house and Quantum Blue® Adalimumab methods, respectively.

ADL quantification of exogenously spiked samples (µg/ml).
Table 2 shows the ICCs between the spiked and the measured ADL concentrations for each method, as well as the average differences. The results show that all assays have a high ICC (above 0.927), which means they have values close to the theoretical concentrations. In accordance with recovery rates, the Immundiagnostik and in-house assays have a negative average difference between the spiked and measured concentrations, and the 95% CI did not include 0, which means that these assays tend to overestimate drug concentration, whereas the opposite is seen for the Quantum Blue® Adalimumab, which has a positive average difference and excludes 0, meaning this assay tends to underestimate drug concentration. All assays have the tendency to measure accurate values in the range from 0 to 20 µg/ml and reach a plateau at higher concentrations.
ICC between the theoretical and measured concentrations of exogenously spiked samples.
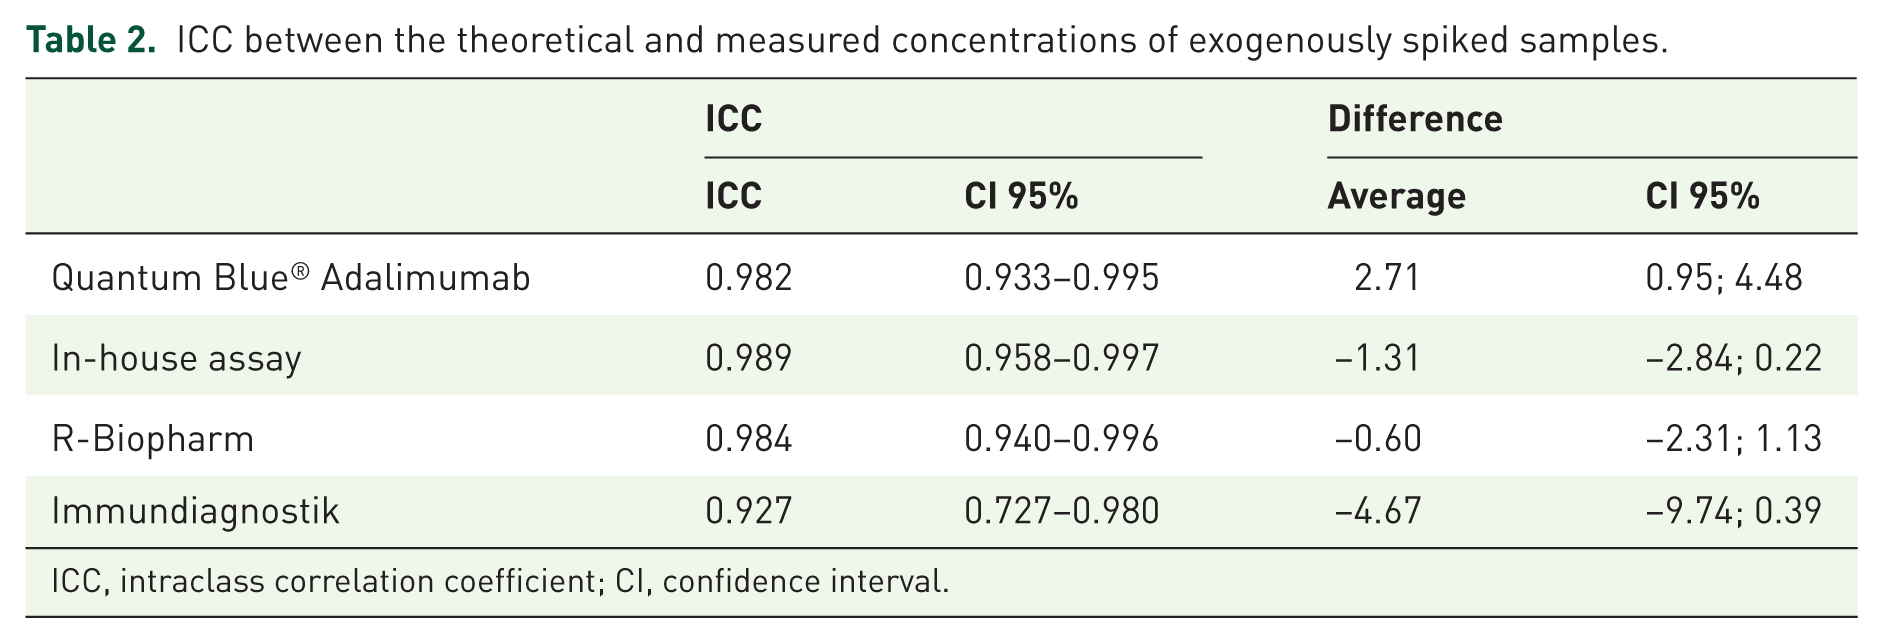
ICC, intraclass correlation coefficient; CI, confidence interval.
Moreover, in order to test the Quantum Blue® Adalimumab assay in a real-life context, both this and the reference assays were used to quantify the ADL amount in 120 serum samples of IBD patients being medicated with this mAb. All patients were in the maintenance phase of ADL therapy. The ICCs and the average differences between the different assays are shown in Table 3. The highest ICCs were found between the R-Biopharm the Quantum Blue® Adalimumab (0.864) and the Quantum Blue® Adalimumab and in house (0.761), showing a good agreement between these pair of assays. The highest average difference was found between the Immundiagnostik and the R-Biopharm (10.20), in house (13.93), and Quantum Blue® Adalimumab assay (13.34), respectively, and the 95% CI did not include 0, showing that the concentrations measured by Immundiagnostik were consistently higher than those measured by the other assays. Bland–Altman plots were computed to establish whether those differences were related to certain concentration ranges (Supplementary Figure S1). And indeed, these plots suggest that the differences between the methods increase for higher concentrations, although rarely exceed the ±1.96 SD interval. This is especially evident for the Immundiagnostik ELISA test that shows very good correlations with other tests at concentrations below 20 µg/ml, but very poor correlations above this concentration.
ICC and differences found upon comparing the different ADL quantification assays in clinical samples.
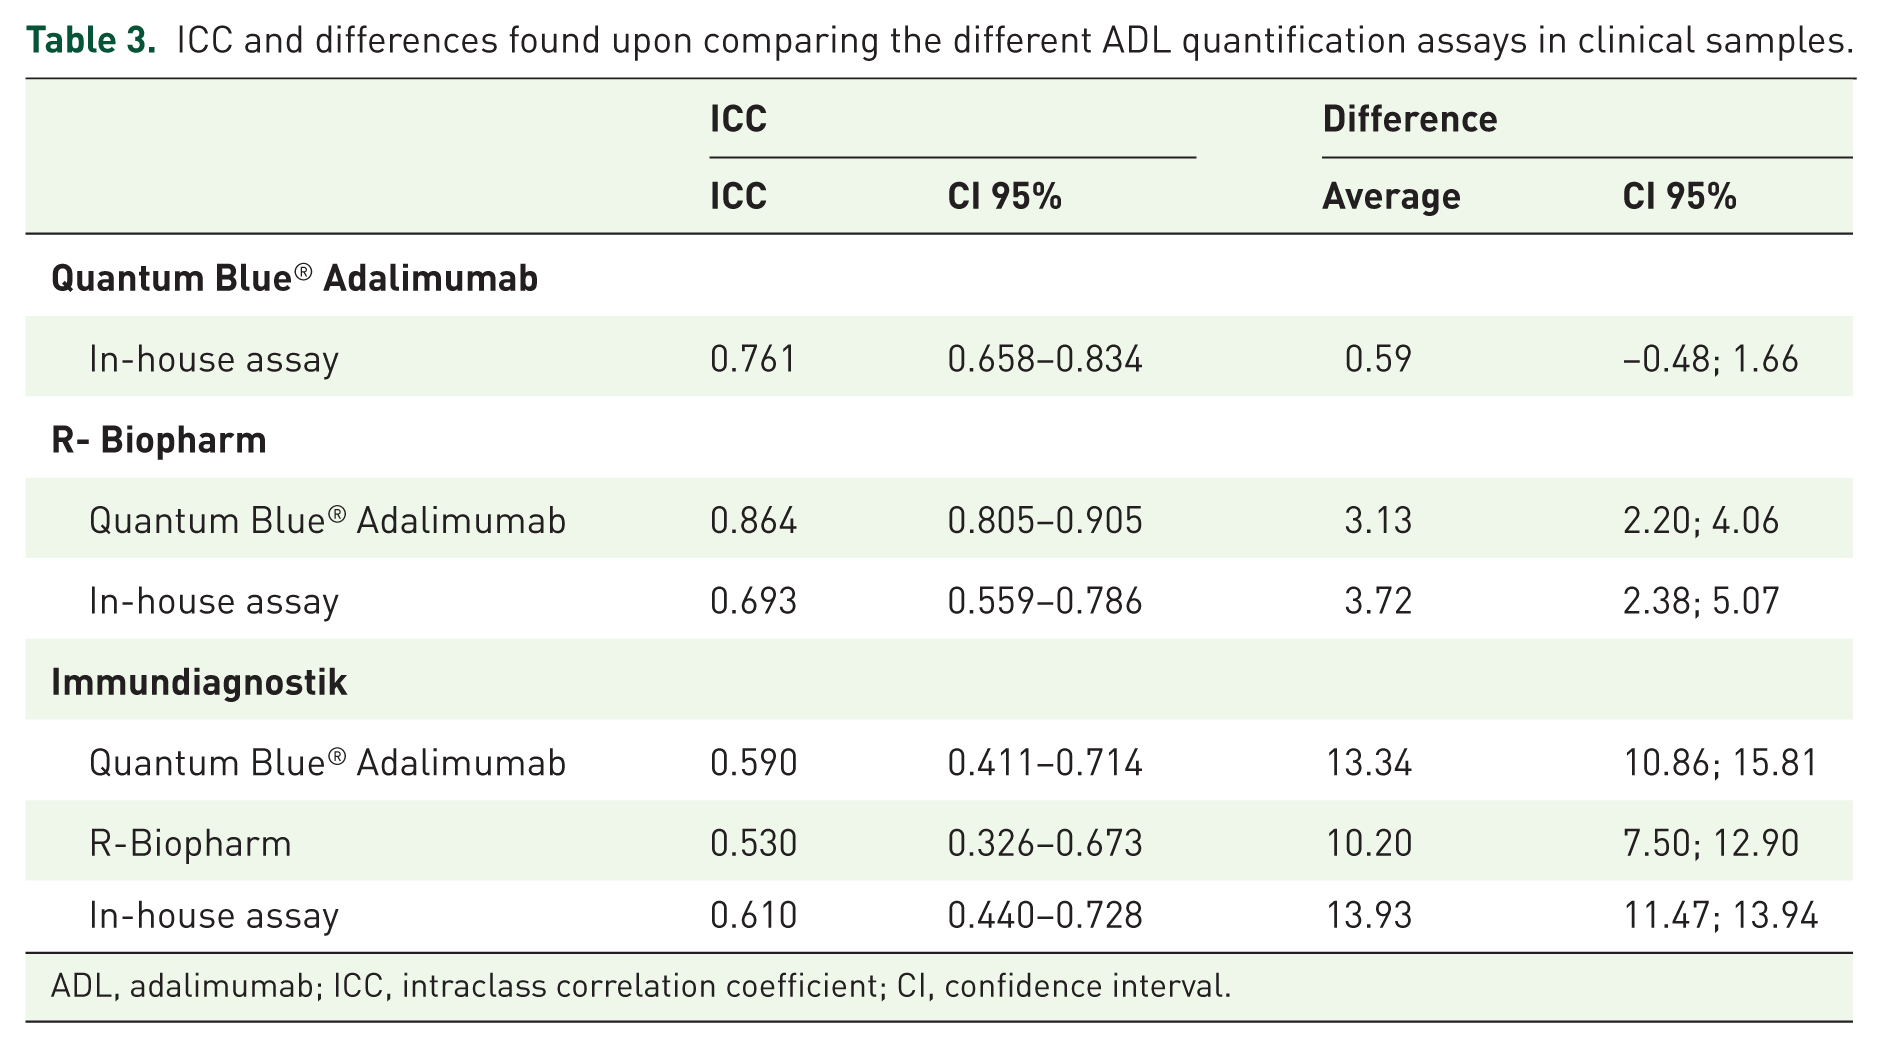
ADL, adalimumab; ICC, intraclass correlation coefficient; CI, confidence interval.
Overall, the Quantum Blue® Adalimumab correlates robustly with the R-Biopharm assay over a large concentration range, while this correlation only holds true for concentrations below 15 µg/ml when compared with the in-house and Immundiagnostik ELISA tests.
Qualitative analysis
To analyse these results from a clinical perspective, ADL levels were stratified according to five possible therapeutic windows: below 3 μg/ml, between 3 and 6.85 μg/ml, above 6.85 μg/ml; 33 below or above 4.90 μg/ml;9–11 below or above 5.85 μg/ml;12,13 below or above 7.50 μg/ml;14,15 below 5 μg/ml, between 5 and 12 μg/ml, and above 12 μg/ml.16–18 The agreement analyses for these categories are shown in Table 4.
Kappa/accuracy between the different methods using different cut-offs.
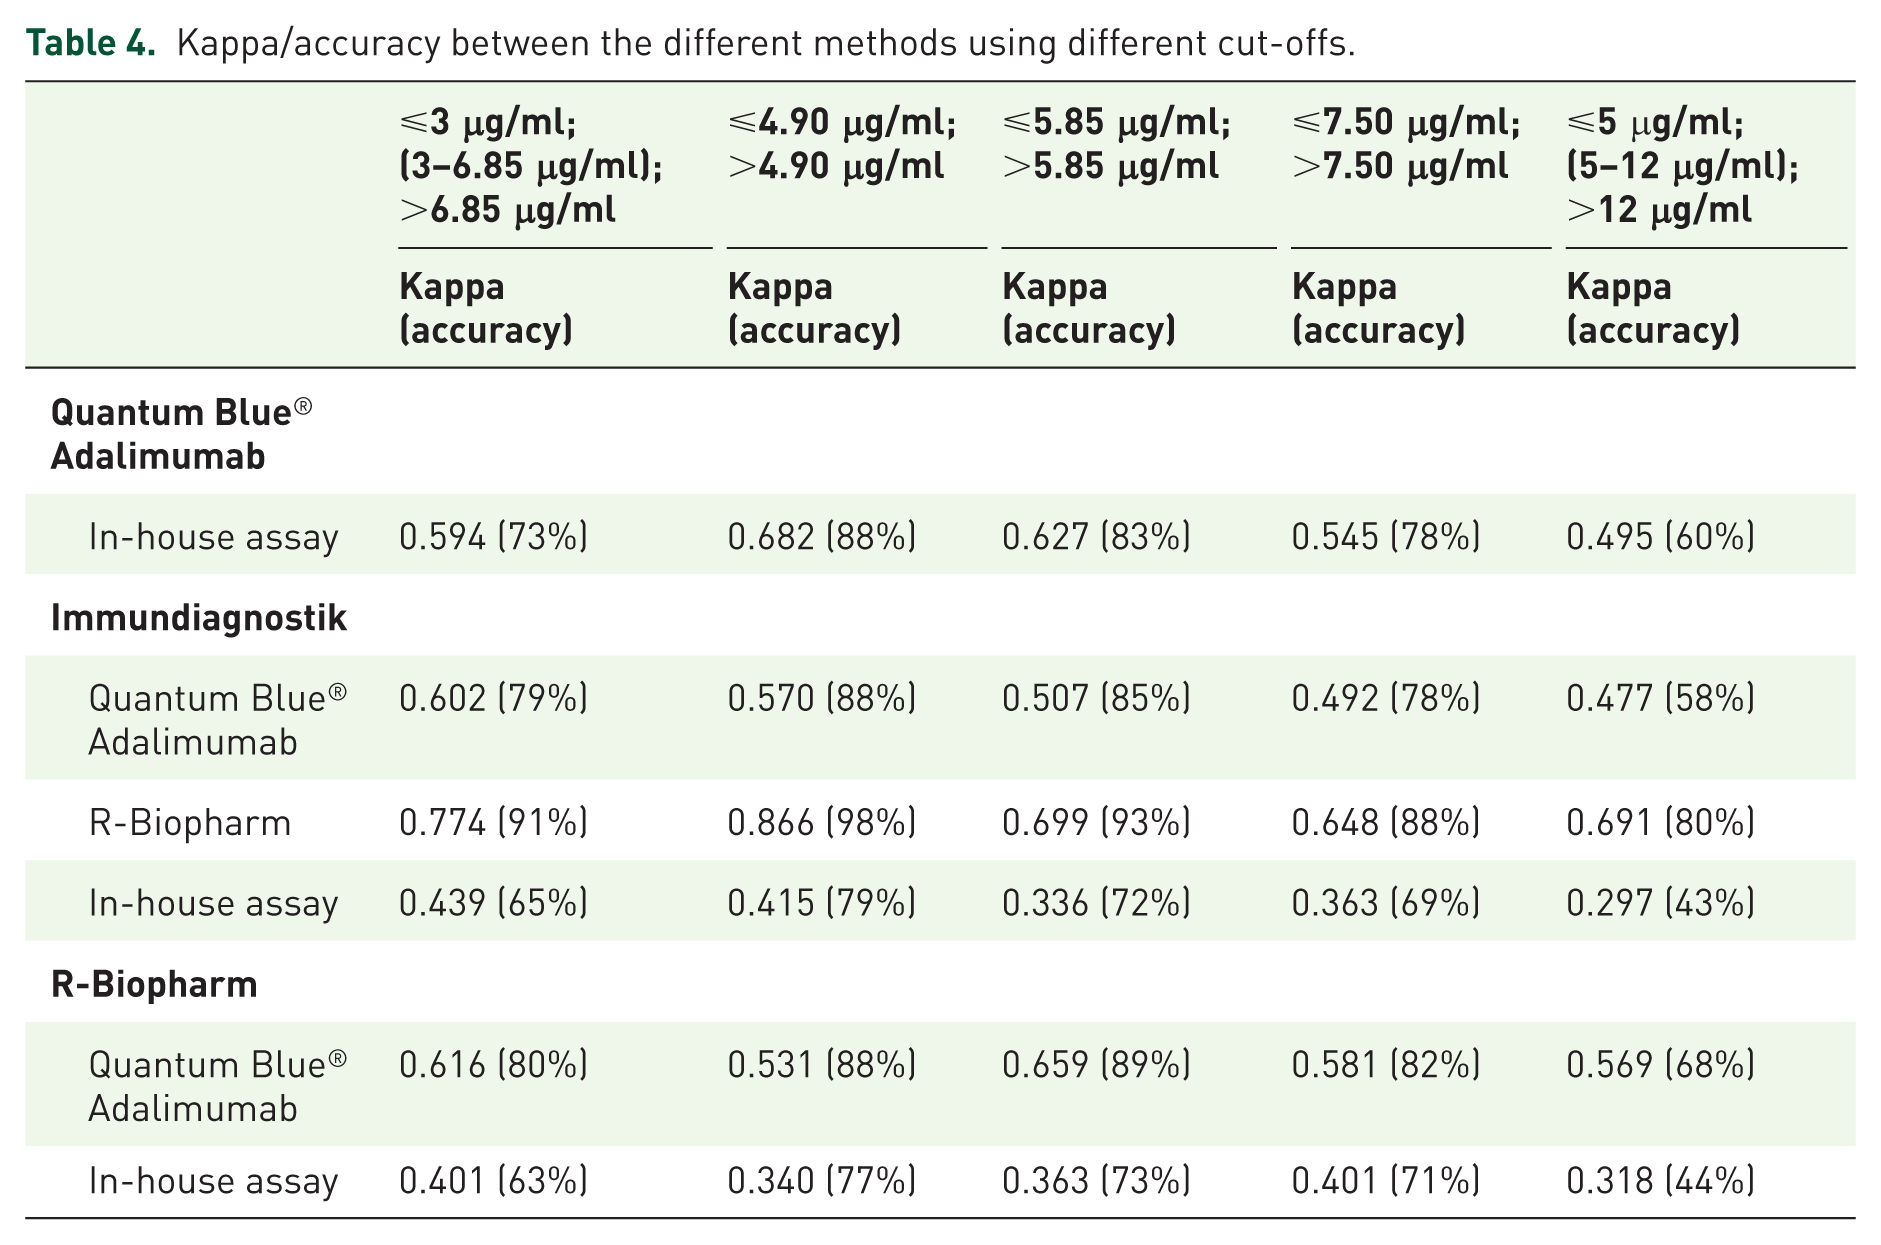
Comparisons showed that the agreement was higher for the pair Immundiagnostik and the R-Biopharm in the five therapeutic windows, with a substantial to an almost perfect strength of agreement according to the kappa interpretation of Landis and Koch. 34 In the case of the Quantum Blue® Adalimumab assay, the kappa statistic revealed that the levels of agreement with the standard assays were moderate to substantial in the five therapeutic windows.
Discussion
The use of TDM for ADL in the treatment of IBD is becoming increasingly common. In cases of nonresponse (primary or secondary), TDM can provide information about the cause of treatment failure. Therefore, TDM is a valuable tool that allows the adjustment of a drug’s therapeutic dosage according to the plasma concentrations found in each patient, hence, improving patient care and healthcare resource optimization. The recent development of a rapid ADL quantification assay (Quantum Blue® Adalimumab) holds the promise of revolutionizing the TDM-based therapeutic algorithms, by allowing an immediate adjustment of the ADL dosage. However, and to ensure accuracy, one has to evaluate whether this assay has a performance comparable with those already in use. This study arises in that context, with the aim of validating the Quantum Blue® Adalimumab by comparing its performance with that of three already-established ELISA assays, using both exogenously spiked and patients’ extracted samples.
The results show that all methods have an acceptable performance as assessed by their average recovery percentage and appear to be similar in quantification of ADL. However, and looking at the individual results, the Immundiagnostik assay has a wide variation of recovery, measuring consistently high values for concentrations above 24.3 ug/ml, whereas the Quantum Blue® Adalimumab seems to underestimate ADL concentrations. Regarding the quantitative analysis of the results obtained from the clinical samples, the comparison of the different assays has shown that the R-Biopharm was the closest to the Quantum Blue® Adalimumab, with an ICC of 0.864, but the former kit measures consistently higher values than the latter. This result is supported by the concentrations obtained from the spiked samples, in which in all but the 10 µg/ml sample, higher values were obtained when using R-Biopharm versus Quantum Blue® Adalimumab. The differences found upon comparing the different methods, as well as those between measured and nominal values, are most likely attributable to the ELISA method itself and may include differences at the detection step. Antibodies that bound to the TNFα–drug complex immobilized in the plate differ substantially between the ELISA systems. While the in-house assay uses a HRP-conjugated anti-Fc antibody for the detection step, R-Biopharm uses a HRP-conjugated MA-ADM40D8 antibody generated specifically for ADL. 35 Moreover, surface aggregation and denaturation of reagents, which are likely to mask epitopes or show new epitopes, may also interfere with the ELISA system performance. Also, the dilution step may affect results, since serum matrix effects may also interfere with drug level assessments (e.g. presence of complement components, cross-reactive immunoglobulins and rheumatoid factors). 36
Bland–Altman plots of measurements of patients’ serum locate the differences between the Quantum Blue® Adalimumab and the other assays in different concentration ranges (Supplementary Figure S1). Overall, the lateral flow Quantum Blue® Adalimumab rapid test, and the different ELISAs measure similar levels of ADL at low concentrations but diverge at concentrations above 20 µg/ml. This difference is most accentuated in comparison with the Immundiagnostik assay, which systematically measures higher values than other assays at high concentrations. The Bland–Altman plots of the in-house assay show a bimodal distribution compared with other assays, which may explain the poor kappa/accuracy values with all other assays over the various therapeutic cut-off concentration levels (Table 4).
The analysis of results from a qualitative perspective is likely more important in this context, as the placement of a patient within a certain range of ADL concentrations will be reflected in the clinical decisions made if TDM is applied. If the drug concentration is below the therapeutic range in a patient, dose increase, interval shortening, or a combination may be considered. Besides treatment intensification, TDM also includes the possibility of providing insight for reducing the exposure when needed, by re-establishing the standard dosing interval or dose de-escalation.37,38
In this regard, and in the absence of a well-defined therapeutic window for ADL, the samples were stratified according to five therapeutic windows (⩽3 μg/ml, 3–6.85 μg/ml, >6.85 μg/ml; 33 ⩽4.90 μg/ml, >4.90 μg/ml;9–11 ⩽5.85 μg/ml, >5.85 μg/ml;12,13 ⩽7.50 μg/ml, >7.50 μg/ml;14,15 and ⩽5 μg/ml, 5–12 μg/ml, >12 μg/ml16–18). Considering the range that is used, concentrations below this range are considered infratherapeutic (the patient should escalate the dosage), while concentrations above this range are considered supratherapeutic (the patient can safely de-escalate the dosage). According to our results, the results are substantial to almost perfect for the Immundiagnostik–R-Biopharm comparison, and moderate to substantial for the Quantum Blue® Adalimumab–Immundiagnostik and R-Biopharm–in-house comparisons. However, when in house is involved, results tend to be weaker. These results can be explained by the amplitudes of each method being very different: in the Immundiagnostik, the amplitude varies between 0.2 and 47 μg/ml; R-Biopharm varies between 0 and 35 μg/ml; and Quantum Blue® Adalimumab varies between 1 and 35 μg/ml, while the in-house assay varies between 0.10 and 20 μg/ml. Besides, it has been observed that in general the kappa lowers as the cut-off increases, likely as a result of greater dispersion of measurements at higher concentrations.
According to our results, the clinical decision based solely on ADL quantification varies according to the therapeutic window chosen. Thus, considering the different cut-offs: ⩽3, 3–6.8, >6.85 μg/ml; ⩽4.90, >4.90 μg/ml; ⩽5.85, >5.85 μg/ml; ⩽7.50, >7.50 μg/ml; and ⩽5, 5–12, >12 μg/ml, the clinical decision would be of a similar nature in 79%, 88%, 85%, 78% and 58% of the patients, respectively, using the Quantum Blue® Adalimumab instead of the Immundiagnostik assay; in 80%, 88%, 89%, 82% and 68% of the patients, respectively, using the Quantum Blue® Adalimumab instead of the R-Biopharm; or in 73%, 88%, 83%, 78% and 60% of the patients, respectively, using the Quantum Blue® Adalimumab instead of the in-house assay. Our results show that the specific percentages vary if a different therapeutic range is used. In this sense, it is important to emphasize that the decision making should not only be based on ADL quantification, but these decisions should be integrated into patients’ clinical context, considering the presence of symptomatology and other disease markers. More studies are needed to integrate patients’ symptomatology with the performance of the Quantum Blue® Adalimumab in the context of TDM, as well as to define specific therapeutic limits of ADL that should be applied with this method.
The Quantum Blue® Adalimumab for the ADL monitoring in IBD patients is quite advantageous, in the sense that the test response time is 15 min compared with approximately 4 h taken by routine ELISA-based kits (Immundiagnostik, R-Biopharm and in-house assays), allowing the physician to optimize treatment immediately as opposed to delaying possible therapeutic interventions to the next administration. Although the role of TDM assessment during the ADL therapy is not clearly defined, more studies from this perspective are being developed and have been demonstrating the benefits of optimizing the ADL therapy in the treatment of IBD and other inflammatory diseases. In fact, these studies have shown that adjusting ADL doses and administration intervals are a clinically powerful and cost-effective strategy.37,39–41 For these reasons, there has been increasing effort by the scientific and medical community in research for the development of novel rapid-test assays and monitoring of IBD patients.
Another important advantage of this commercial rapid test is its user friendliness; in fact, these assays can be operated by any nurse, physician, or researcher, unlike other ELISA kits that require highly trained personnel and specific laboratory facilities. Besides, as a rapid-test method, samples can be analysed upon their collection (i.e. no transportation is needed), and it is designed to be used individually (as opposed to other ELISA kits designed to work in a batch-fashion). Unfortunately, there is no commercially available ADL antibodies Quantum Blue® Adalimumab at the moment. Emerging data increasingly emphasize that the presence of ADL antibodies may lead to ineffective subtherapeutic levels of ADL and contribute to loss of response by increasing drug clearance or blocking the effect of the drug.13,41–43 So, monitoring these levels during therapy should be integrated into the management of patients receiving ADL.
For this study, spiked samples and a large number of serum samples obtained from a multicentric and heterogeneous cohort were used and are therefore a representation of reality. However, our study has a few limitations that should be taken into account: the ADL quantification was always made by the same researcher, which hampers the assessment of the interassay variability; serum matrices often contain components such as rheumatoid factors and other proteins, which could lead to bias during sample analyses, mainly in ligand-binding assays, as well as the presence of ADL antibodies that may differentially interfere with the ADL quantification in each kit (that was unaccounted for). In this study, as the focus was on assessing whether the Quantum Blue® Adalimumab treatment could replace the ELISA-based kits, the analytical performance characteristics of the Quantum Blue® Adalimumab were not considered. However, this performance has been evaluated by the manufacturer and is clearly indicated in the instruction manual accompanying the kit: Quantum Blue® Adalimumab limits of quantification are 1.3–35.5 μg/ml, which may hold a disadvantage when compared with the ELISA-based kits.
In conclusion, the Quantum Blue® Adalimumab is a reliable alternative to the commonly used ELISA-based ADL quantification kit. In fact, the rapid test allows a fast and accurate assessment of ADL levels, which in turn contributes towards proactive and cost-effective therapeutic management of IBD patients. This rapid assay for ADL quantification represents a valuable tool for the fast implementation of tailored therapeutic solutions.
Supplemental Material
Supplementary_Material – Supplemental material for Accuracy of the new rapid test for monitoring adalimumab levels
Supplemental material, Supplementary_Material for Accuracy of the new rapid test for monitoring adalimumab levels by Cátia Rocha, Joana Afonso, Paula Lago, Bruno Arroja, Ana I. Vieira, Claudia C. Dias and Fernando Magro in Therapeutic Advances in Gastroenterology
Footnotes
Acknowledgements
The authors would like to thank BÜHLMANN Laboratories AG (Schönenbuch, Switzerland) for kindly providing the Quantum Blue® Adalimumab kits used in this study, and all investigators at the hospitals who provided samples. CCD would like to acknowledge the project NanoSTIMA (NORTE-01-0145-FEDER-000016), which is financed by the North Portugal Regional Operational Programme (NORTE 2020) under the PORTUGAL 2020 Partnership Agreement and through the European Regional Development Fund (ERDF). Moreover, the authors would like to express their gratitude to Sandra Dias for her involvement as the GEDII coordinator and all the help during data collection, as well as to Catarina Santos for medical writing assistance. CR acknowledges “Fundação para a Ciência e Tecnologia (FCT)”, Portugal under grant number PDE/BDE/114583/2016.
FM: study concept and design; analysis and interpretation of data; drafting of the manuscript; study supervision; critical revision of the manuscript for important intellectual content. CR: drafting of the manuscript; quantification assays; analysis and interpretation of data. JA: drafting of the manuscript, quantification assays; analysis and interpretation of data. CCD: statistical analysis. All the other authors: recruitment of patients and collection of samples.
Funding
This work was supported by the Portuguese IBD Group (GEDII, Grupo de Estudo da Doença Inflamatória Intestinal).
Conflict of interest statement
FM served as speaker and received honoraria from Merck Sharp & Dohme, Abbvie, Vifor, Falk, Laboratorios Vitoria, Ferring, Hospira and Biogen.
Supplemental material
Supplemental material for this article is available online.
References
Supplementary Material
Please find the following supplemental material available below.
For Open Access articles published under a Creative Commons License, all supplemental material carries the same license as the article it is associated with.
For non-Open Access articles published, all supplemental material carries a non-exclusive license, and permission requests for re-use of supplemental material or any part of supplemental material shall be sent directly to the copyright owner as specified in the copyright notice associated with the article.