
Abstract
Background:
The commercialization of CT-P13, an infliximab (IFX) biosimilar, has the potential to decrease health-related costs and enhance access to biological therapies. This study aimed to address the accuracy and inter-assay agreement of the CT-P13 quantification using four different assays initially developed to assess IFX.
Methods:
The four different methods, one in-house method and three commercially available kits, were used to quantify exogenously-spiked samples and the sera from 185 inflammatory bowel disease (IBD) patients on CT-P13 therapy.
Results:
The quantification of the spiked samples unveiled a consistent and accurate behaviour of three of the tested methods, with average percentage recoveries of 90%, 102% and 109%. Results from the clinical samples demonstrated that these three assays were also highly correlated, both concerning Spearman’s rank coefficients (range 0.890–0.947) and intraclass correlation coefficients (range 0.907–0.935). There were a few systematic deviations among them, but their impact in the clinical stratification of the patients using different cut-offs was minimal, particularly when these cut-offs were in the 3–4 µg/ml range, for which the strength of agreement (as assessed by the Kappa statistics that ranged from 0.732 to 0.902) was substantial to almost perfect.
Conclusions:
Our results indicate that three of the tested IFX quantification methods can be used to accurately quantify CT-P13 without any adjustments.
Introduction
The knowledge of the pivotal role played by the cytokine tumour necrosis factor (TNF)α in chronic immune-mediated inflammatory diseases brought along new therapeutic perspectives and expectations. The development of monoclonal antibodies (mAbs) targeting TNFα (anti-TNFα) has dramatically changed the natural evolution of these diseases. Particularly in the case of inflammatory bowel diseases (IBDs), of which the two main types are Crohn’s disease (CD) and ulcerative colitis (UC), the introduction of anti-TNFα as a therapeutic strategy has led to steroid sparing, mucosal healing, decreased rates of surgery and hospitalization, and an overall improvement in health-related quality of life, both in the short and long term.1–3 However, the high costs of these biological agents carry a heavy economic burden to health care institutions and patients, and end up restraining their utilization. With the advent of patent expiration dates, the development and market release of biosimilars (i.e. products that are similar, though not identical, to an originator biological drug) have the potential to considerably reduce healthcare costs, while improving and generalizing early access to these innovative therapeutic strategies.
CT-P13, commercialized under the brand names Remsima® (Celltrion, South Korea) and Inflectra® (Hospira, USA) is a biosimilar of infliximab (IFX; Remicade®, Merck Sharp & Dohme, Ireland). CT-P13 was the world’s first biosimilar mAb to be approved by the regulatory agencies, in 2013 by the European Medicines Agency and in 2016 by the United States Food and Drug Administration, and can now be used for all adult and paediatric indications of the originator drug, including rheumatoid arthritis (RA), ankylosing spondylitis (AS), psoriatic arthritis (PsA), psoriasis, CD and UC.4,5 Being a biosimilar, CT-P13 has the same formulation and a similar physicochemical profile as its originator IFX.6,7 Moreover, CT-P13’s pharmacodynamic properties resemble those of IFX, having an equivalent effectiveness and being generally well tolerated.6,7 The biological and therapeutic equivalence of CT-P13 was originally demonstrated in two keystone studies using AS and RA patient cohorts.8,9 Although the extrapolation of these results were sufficient to grant CT-P13 indication to treat IBD, multiple postmarketing and observational trials have confirmed the validity of this extrapolation and consistently reported the absence of significant differences between IFX and CT-P13 in terms of efficacy, safety and immunogenicity when used to treat CD and UC patients.10–12
Despite IFX’s effectiveness in many IBD patients, a considerable number of them fail to respond to this drug either in the induction phase (primary nonresponse) or in the maintenance phase (secondary loss of response). Studies performed during the last decade have consistently associated this lack of effectiveness to a low concentration of IFX, usually assessed immediately before the following infusion (trough levels of IFX).2,13–22 A great effort has been made in the attempt to establish therapeutic cut-offs for IFX, (i.e. fixed concentrations below which one can predict lack of response with an appreciable certainty), and therefore adjust the IFX dosing accordingly.2,13,17–23 In this context, several algorithms and dashboards are being developed to facilitate, automatize and standardise the physician’s decision-making process, therefore optimizing IFX therapy.24–28 This tailored therapeutic management relies heavily on an accurate assessment of IFX levels in a patient’s serum, known as therapeutic drug monitoring (TDM) and several methods, usually based on enzyme-linked immunosorbent assays (ELISAs), have been developed and are currently available in the market, allowing an easy, efficient and relatively fast quantification of IFX. Overall, TDM-based algorithms have been proved to be a cost-efficient approach, maximizing benefit while reducing toxicity risks.
One can rationally expect that the relationship seen between the serum levels and the clinical, histological and endoscopic outcomes for IFX is maintained with its biosimilar CT-P13. 29 However, and to smooth and assure a safety transition, one must guarantee that the assays used to measure IFX in the patient’s serum are equally efficient and accurate to measure CT-P13. This study aims to address the efficacy, accuracy and inter-assay agreement of CT-P13 quantification using four different assays that were initially developed to assess the originator IFX from patient’s serum.
Materials and methods
Spiked samples of known CT-P13 concentrations (0.5, 1, 1.5, 3, 5, 7, 10, 15, 20, 30 and 40 μg/ml) were generated by diluting the appropriate amount of exogenous CT-P13 (Remsima®, Celltrion, South Korea) into a pool of serum from control donors. Clinical samples were prospectively and consecutively obtained from 185 IBD patients that were on CT-P13 therapy (Remsima®; Celltrion, South Korea), followed in four different university and community hospitals. All IBD patients over18 years old and on Remsima® were invited to participate in the study.
This study was approved by the ethic committee of all hospitals involved and by the Portuguese Data Protection Authority. All patients and control donors enrolled signed an informed written consent.
IFX quantification assays
A total of four different assays were used to quantify CT-P13 from the patient’s serum: one in-house assay and three commercially available kits. The in-house method is an ELISA commonly used in our laboratory and was carried out as previously described by Ben-Horin and colleagues20,30–34 Briefly, serum samples were diluted (1:100) and added to a plate pre-coated with TNFα (Peprotech, Rocky Hill, NJ, USA). After 60 min of incubation and an appropriate number of washes, a horseradish peroxidase (HRP)-labelled goat anti-human Fc fragment antibody (MP Biomedicals, Solon, OH, USA) was added and the plate was incubated for 60 min. Afterwards, tetramethylbenzidine (Millipore, MA, USA) substrate was added, and the reaction was stopped 3 min later with 2M H2SO4. Finally, the sample’s absorbance was read at 450/540 nm, and the CT-P13 was quantified by interpolating the absorbance values in a standard curve built with known concentrations of exogenous CT-P13 (Remsima®; Celltrion, South Korea). The three commercially available kits used were the following: Quantum Blue® Infliximab: Quantitative Lateral Flow Assay (Bühlmann, Schönenbuch, Switzerland), hereafter referred to as QB; Level Infliximab M2920 kit (Sanquin, Amsterdam, Netherlands), hereafter referred to as Sanquin; and RIDASCREEN® IFX Monitoring (R-Biopharm AG, Darmstadt, Germany), hereafter referred to as R-Biopharm. All these kits were used strictly following manufacturer’s instructions. The lower and upper limits of quantification are 0.4 µg/ml and 20 µg/ml for the QB assay, and 0.08 µg/ml (1:200) and 37.5 µg /ml (1:1500) for the Sanquin assay, respectively: whenever the results obtained in the clinical samples were below or above these limits of quantification, they were considered to be at those limits. The R-Biopharm kit manufacturer provides no information on the quantification limits. For the in-house procedure, the upper limit of quantification was calculated as the highest concentration of the standard curve × the sample dilution factor used.
Statistical analysis
Categorical variables were described through absolute (n) and relative (%) frequencies and continuous variables were described as mean and standard deviation, median, percentiles, and minimum/maximum values when appropriate. All the reported p-values were two-sided, and p-values <0.05 were considered to be statistically significant. The accuracy and Kappa statistics were computed based on a pre-established therapeutic window of IFX. All data were arranged, processed and analysed with SPSS® v.20.0 data (Statistical Package for Social Sciences, IBM Corp., Armonk, NY). Graphs were computed with Prism 7® (GraphPad Software, Inc., CA).
Results
Quantitative analysis
The four tested methods were used to quantify CT-P13 from 11 spiked samples varying from 0.5 to 40 μg/ml (Figure 1). As shown in the error bars on Figure 1, the intra-assay variation was roughly the same for all methods: the standard deviations varied from 0.07 to 2.66 for the in-house method, 0.05–3.56 for the QB assay, 0.02–3.03 for the Sanquin assay, and 0.11–3.67 for the R-Biopharm assay. On the other hand, the average recovery was 109% (range 63–162%) for the in-house method, 102% (range 80–119%) for the QB, 91% (range 17–172%) for the Sanquin and 90% (range 79–106%) for the R-Biopharm. Overall, the QB kit had the best average recovery, whereas the R-Biopharm had the least dispersion of percentage recoveries across all tested concentrations.

CT-P13 quantification of exogenously-spiked samples (μg/ml). The bars indicate the mean concentration obtained with each assay in the different concentrations, and the error bars refer to the standard deviation.
The four assays were also used to quantify CT-P13 levels in the serum of 185 IBD patients, with a median age of 41 and of which 62% were women. Most of these patients had CD (80%) while 20% of them had UC, and their median [interquartile range (IQR)] follow-up time was 14 years (11–16). Concerning concomitant medications, 15% of these patients were on 5-aminosalicylic acid (5-ASA), 51% were on azathioprine (AZA), 8% were on corticosteroids, and 1% was on methotrexate. As for the CT-P13 therapeutic phase, 37.5% of all patients were in the induction, whereas 62.5% were in the maintenance phase (Table 1).
Cohort characterization.

5-ASA, 5-aminosalicylic acid; CD, Crohn’s disease; IQR, interquartile range; UC, ulcerative colitis.
The median (IQR) CT-P13 concentration obtained from the clinical samples was the highest when using the R-Biopharm kit [6.00 µg/ml (0.40–12.50)], and the lowest when using the Sanquin kit [2.60 µg/ml (0.90–12.10)]. The in-house method and QB assays measured medians were, respectively, 3.40 µg/ml (0.30–10.80) and 4.20 µg/ml (0.40–11.50). These results were significantly correlated among themselves, as shown in Table 2 and Supplementary Figure 1, with the maximum Spearman’s rank correlation coefficient being obtained for the pair QB and R-Biopharm (0.947). The intraclass correlation coefficient (ICC) was also computed for each pair of assays, once again showing a good correlation between the different methods (Table 3). The highest ICC was found for the pair QB and R-Biopharm, the only pair for which no consistent systematic difference could be encountered. As for the rest of the comparisons, the in-house method results were consistently lower than those obtained with the Sanquin, QB and R-Biopharm kits (by an average of 2.05, 1.27 and 0.83 µg/ml, respectively), whereas the Sanquin results were consistently higher than those obtained with the QB and R-Biopharm assays (by an average of 0.78 and 1.22 µg/ml, respectively). Blant–Altman plots (Supplementary Figure 2) reveal that the dispersion between the values measured by each pairs of methods tends to increase as the CT-P13 concentration raises. This dispersion is particularly narrow for the pairs in-house-QB, in-house-R-Biopharm and QB-R-Biopharm, but broadens up whenever Sanquin is included in the comparison.
Spearman’s rank correlations.
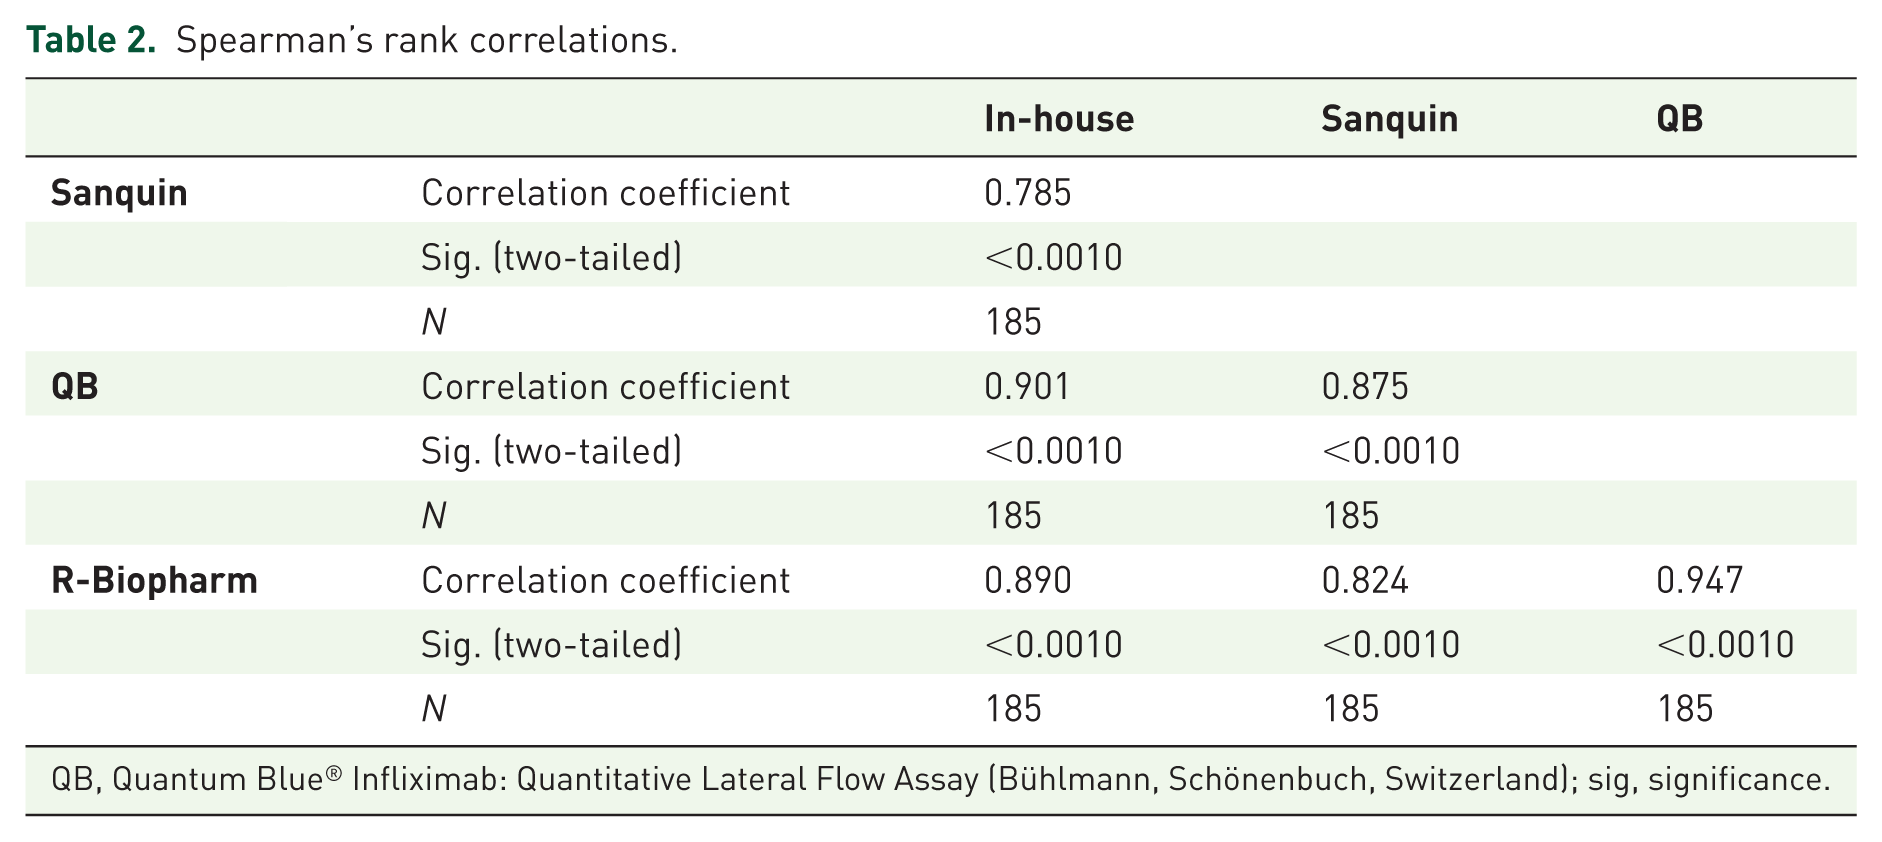
QB, Quantum Blue® Infliximab: Quantitative Lateral Flow Assay (Bühlmann, Schönenbuch, Switzerland); sig, significance.
Intraclass correlation coefficient (ICC).
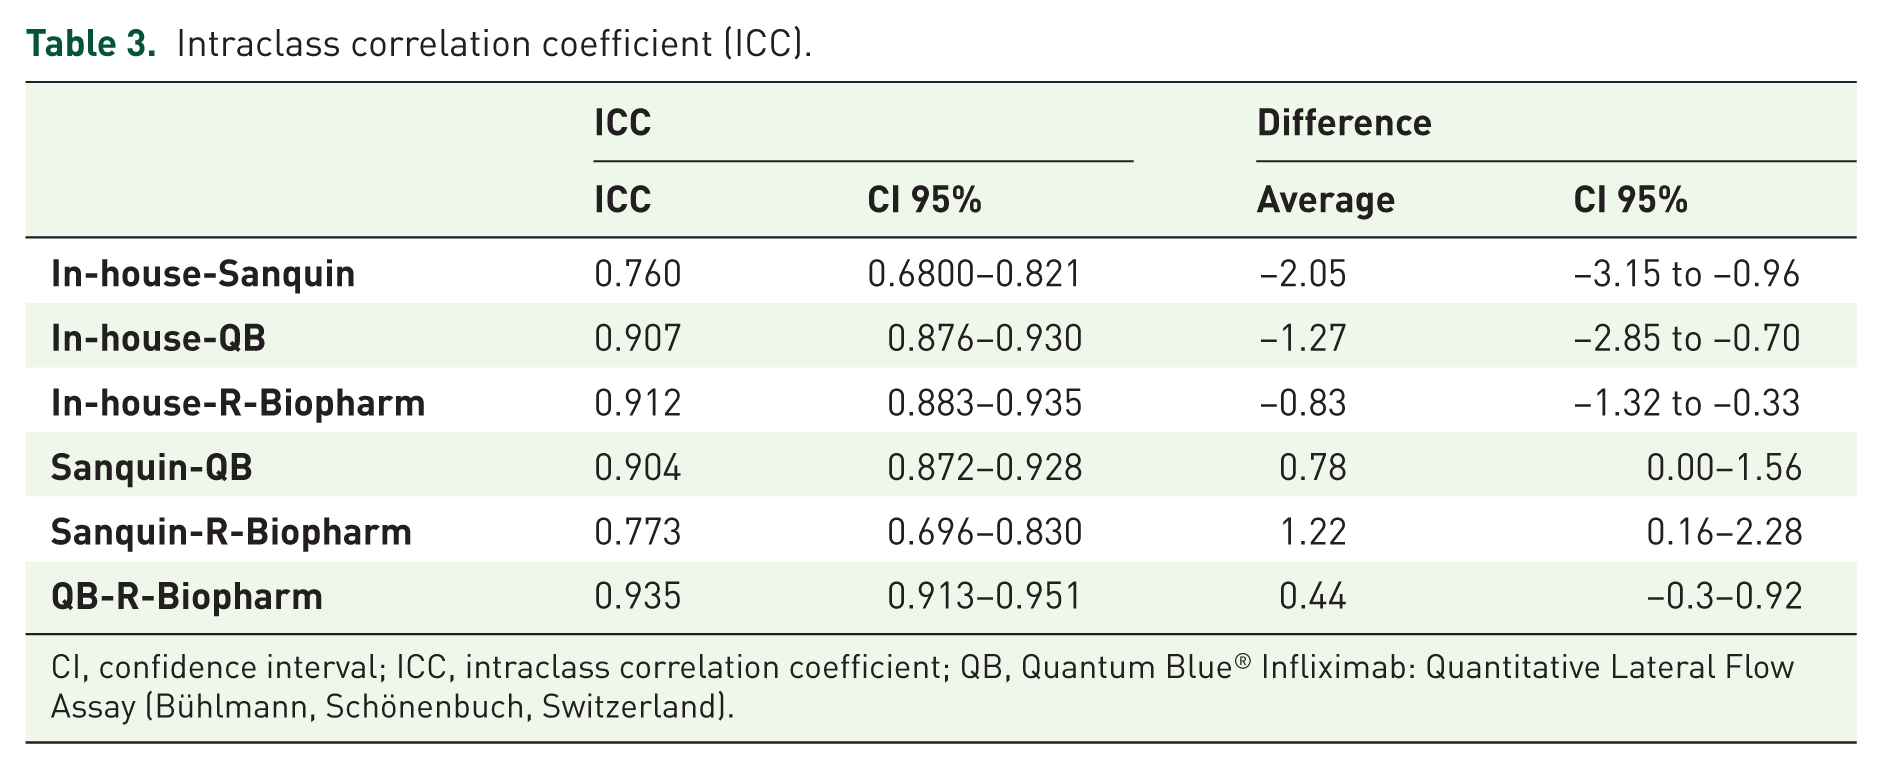
CI, confidence interval; ICC, intraclass correlation coefficient; QB, Quantum Blue® Infliximab: Quantitative Lateral Flow Assay (Bühlmann, Schönenbuch, Switzerland).
To test whether the ICC between the different methods was dependent on the therapeutic phase (and, therefore, on the range of IFX values being assessed), samples were stratified according to the patient’s therapeutic phase (induction versus maintenance) and ICCs were independently calculated for each of these groups (Supplementary Table 1). The results show that the induction ICCs were quite similar to the maintenance ICCs for each pair of methods, most of the times, the 95% confidence intervals (CIs) were at least partially overlapping. On the other hand, the average differences seem to be larger in the induction phase.
Qualitative analysis
To analyse these results from a clinical perspective, CT-P13 levels were stratified according to a predefined and commonly accepted IFX therapeutic window: lower than 3 µg/ml (subtherapeutic levels), between 3 and 7 µg/ml (therapeutic levels) and >7 µg/ml (supra-therapeutic levels). The patients’ distribution by these categories after quantification by each assay is depicted in Table 4. The accuracy was higher for the pair QB and R-Biopharm (88%), with an almost perfect strength of agreement according to the Kappa interpretation of Landis and Koch 35 (Kappa = 0.874). All the other pairs had a substantial agreement, with the exception of the Sanquin-in-house comparison, that displayed only a moderate agreement (Kappa = 0.597).
Qualitative comparison between the CT-P13 quantification assays using the therapeutic interval 3–7 µg/ml.

QB, Quantum Blue® Infliximab: Quantitative Lateral Flow Assay (Bühlmann, Schönenbuch, Switzerland).
This qualitative analysis using the 3–7 µg/ml therapeutic interval was further stratified into samples taken from patients in the induction or in the maintenance phase (Supplementary Table 2). The results show that the concordance between each pair of methods is similar using samples from different phases, as the Kappa 95% CI were, most of the times, at least partially overlapping.
The agreement analysis was further extended to admit other cut-offs and to identify the cut-off with the highest agreement (Table 5). The highest Kappa values (0.901 and 0.902) were obtained for the QB-R-Biopharm comparison at cut-offs of 3 and 4, respectively. Interestingly, whereas agreement tends to decrease with the increase in the cut-off value, such tendency appears to be absent or inverted when the comparisons involve Sanquin.
Kappa (SE) between the different methods using different cut-offs.

QB, Quantum Blue® Infliximab: Quantitative Lateral Flow Assay (Bühlmann, Schönenbuch, Switzerland); SE, standard error.
Discussion
The expiration of biological patents and commercialization of biosimilar drugs holds the potential of lowering health-related costs and generalizing access to these therapies. However, and particularly in the case of IFX, a long path has been made towards a target-concentration adjusted dosing, which has been proved to be both clinically- and cost-effective. With the arrival of CT-P13, the usefulness and applicability of the relationships previously explored between drug levels and clinical outcomes is limited by the lack of knowledge on whether the assays optimized to quantify the originator IFX are equally efficient and accurate for the quantification of CT-P13. In fact, and despite having the same amino-acid sequence, originator IFX and CT-P13 may have post-translational differences as a consequence of their complex manufacturing processes. In this study, we have explored and compared the performance of four IFX quantification assays, an in-house method and three commercially available kits, Sanquin, QB and R-Biopharm, in the quantification of CT-P13. The three assays: in-house, Sanquin and R-Biopharm, are traditional ELISA-based methods, and therefore have a turnaround time of approximately 8 h. The QB assay has the added advantage of being a rapid assay with a turnaround time of 15 min, allowing an immediate adjustment of the drug dosage, as opposed to delaying this adjustment to the following infusion, which commonly happens with all ELISA-based assays.
The results show that, upon measuring CT-P13 levels from exogenously-spiked samples, all methods have an acceptable performance as assessed by their average recovery percentage. However, and looking more closely at the individual results, one can see that the Sanquin assay has a wide variation of recovery, measuring consistently low values for concentrations below 5 µg/ml. In fact, the percentage recovery for this kit concerning samples with 0.5, 1, 1.5 and 3 µg/ml is 44%, 35%, 28% and 17%, respectively. Notwithstanding, and for concentrations between 5–20 µg/ml, the Sanquin kit tends to overestimate CT-P13 levels, reaching recovery percentages as high as 160 and 172% for 5 and 7 µg/ml, respectively. Its average recovery for this drug shows a general underestimation (91%), whereas when used with IFX Sanquin has been shown to overestimate the true amount of product in the samples.30,36
The unstable behaviour of Sanquin is once again noticeable upon measuring clinical samples: whereas it measures the lowest median concentration (2.60 µg/ml), it also measures consistently higher values than the other methods, by an average difference of 2.05, 0.78 and 1.22 units to the results obtained with the in-house, QB and R-Biopharm assays, respectively. Not surprisingly, it also has the lowest correlation coefficients when compared with the other methods.
The results from the quantification of clinical samples obtained from all the other tested methods (in-house, QB and R-Biopharm assays) show a strong correlation punctuated by minor systematic differences. This pattern of inter-assay relationships has been commonly observed in other methodological comparisons between two or more IFX quantification assays, ELISA or not ELISA-based: whereas a comparable and stable accuracy usually results in moderate to high correlation values, systematic differences occur, likely due to the utilization of different antibodies with varying IFX affinities.36–42 The highest correlation in this study was observed for the QB-R-Biopharm pair. Moreover, the correlations were fairly similar between samples taken from patients in the induction and in the maintenance phase of the CT-P13 therapy. The larger average differences generally seen in the induction phase are likely the reflection of the higher CT-P13 levels present in these samples: in accordance to the Bland–Altman plots, the dispersion between kits is larger in higher CT-P13 levels.
Perhaps more importantly than the quantitative comparison of the results obtained, one must look at the consequences in terms of clinical decisions. The utilization of algorithms and dashboards to interpret the results obtained from TDM and optimize anti-TNFα therapy is becoming popular.24–28 Therefore, one must verify how much does the systematic deviations observed in these assays impact the subsequent clinical decisions. To do so, we have stratified the results according to a popular and commonly accepted therapeutic window, which includes levels from 3 to 7 µg/ml: concentrations below this interval are considered to be infra-therapeutic, whereas concentrations above this interval are considered to be supra-therapeutic. By comparing the stratification obtained using the results from the different assays, one can see that the agreement is usually substantial, being lower for the Sanquin-in-house comparison and almost perfect for the R-Biopharm-QB pair. Moreover, the agreement seemed to be fairly similar when samples were stratified according to each patient’s therapeutic phase.
As the 3–7 µg/ml therapeutic window is a generalized one, and cut-offs must always be outcome, assay and disease-specific, we have also measured the agreement between the assays using different cut-offs (from 3–10 µg/ml). The results are substantial to almost perfect in most of the cases, being once again higher for the R-Biopharm-QB comparison. However, when Sanquin is involved, results tend to be weaker. Besides, whereas the Kappa usually lowers as the cut-off increases, likely the result of a higher dispersion of measurements in higher concentrations, the opposite tends to happen when Sanquin is compared with QB and R-Biopharm. This likely reflects the poor recovery and overall poor behaviour of the Sanquin kit when measuring low concentrations.
The rationale for the need to validate these assays with CT-P13 and the reason for the differences encountered, particularly conspicuous in the case of Sanquin, relies on the complex nature of biological drugs and consequently of their biosimilar molecules. Although sharing the same amino-acid sequence, the originator IFX and CT-P13 may have a number of differences in post-translational features (e.g. glycosylation, sulfurylation, phosphorylation and side-chain additions or subtractions) due to disparities in the cell line used, growth conditions and purification processes, as well as in storage and transport.5,7,11 The pharmacokinetics, pharmacodynamics, immunogenicity and safety studies performed so far show no influence of those differences in these features. However, they may influence capture antibody affinity, particularly through epitope disposition and exposure, impacting the results of the quantification assays. Our results are in line with those previously obtained by Schulze and colleagues, Malíckova and colleagues and Gils and colleagues, showing that antibodies and assays initially developed to quantify IFX can be accurately used to measure CT-P13,43–45 although previous validation is absolutely required to identify less favourable cases.
This study has a few strengths that ought to be underlined: the spiked concentrations include a wide range of values, allowing one to observe the assay behaviour both at low and high CT-P13 concentrations; and a high number of patient’s sera was assessed, assuring a representative real-world sampling. However, there are a couple of limitations that should also be acknowledged: the presence of antibodies to CT-P13 (or other inhibitory molecules) in the clinical samples was unknown; and the coefficient of variation within the same assay used in different moments or by different researchers was unaccounted for.
This study addresses the validity of using four different IFX-optimized assays to quantify the IFX biosimilar CT-P13. Overall, the results are very promising and show that three out of four methods can be accurately used to measure CT-P13: an in-house method previously described by Ben-Horin and colleagues 32 and the R-Biopharm and QB kits that are commercially available. The QB kit has the added advantage of being a bedside point-of-care solution, releasing results within 15 min of sampling, and therefore allowing an immediate adjustment of CT-P13 dosing.
Footnotes
Acknowledgements
The authors thank the Bühlmann company for kindly providing the QB and Sanquin kits used in this study, all investigators at the hospitals who provided samples and data, GEDII for all the support, Sandra Dias for all the assistance during the data collection and Catarina L. Santos for medical writing assistance.
Specific author contributions were as follows: FM: Study concept and design; acquisition of data; analysis and interpretation of data; drafting of the manuscript; study supervision; critical revision of the manuscript for important intellectual content. JA: drafting of the manuscript; CT-P13 assays; analysis and interpretation of data. CCD: statistical analysis. All the other authors: recruitment of patients and collection of samples. All the authors read and approved the final version of the manuscript.
Funding
This work was supported by the Portuguese IBD Group (GEDII, Grupo de Estudo da Doença Inflamatória Intestinal).
Conflict of interest statement
FM served as speaker and received honoraria from Merck Sharp & Dohme, Abbvie, Vifor, Falk, Laboratorios Vitoria, Ferring, Hospira and Biogen.
References
Supplementary Material
Please find the following supplemental material available below.
For Open Access articles published under a Creative Commons License, all supplemental material carries the same license as the article it is associated with.
For non-Open Access articles published, all supplemental material carries a non-exclusive license, and permission requests for re-use of supplemental material or any part of supplemental material shall be sent directly to the copyright owner as specified in the copyright notice associated with the article.