
Abstract
Background:
Therapeutic drug monitoring of adalimumab (ADA) is still controversial.
Objectives:
To study the association between ADA trough levels in the early stages of treatment with biological remission (BR) and drug survival in Crohn’s disease (CD).
Design:
Retrospective cohort study.
Methods:
Patients treated with ADA with available trough levels at weeks 2 and 6 (after the first induction and maintenance dose, respectively) were included. Fecal calprotectin (Fcal) and C-reactive protein (CRP) were registered at baseline, week 24, and week 52. BR was defined as Fcal <200 µg/g and CRP <5 mg/dl. Treatment survival and the need for dose escalation were assessed at week 52. Receiver operating characteristic (ROC) curves were constructed to assess the diagnostic accuracy of ADA cutoff levels for BR. Quartile-specific comparisons were performed to evaluate differences in the proportion of patients achieving BR at weeks 24 and 52, drug survival, and dose escalation.
Results:
In all, 112 patients were included. ADA trough levels at week 6 were higher in patients achieving BR at week 24 (12.32 μg/ml vs 10.3 μg/ml, p = 0.0008), week 52 (12.3 μg/ml vs 10.8 μg/ml, p = 0.035), and in patients with 1-year treatment persistence (12.17 μg/ml vs 9.7 μg/ml, p = 0.03), but lower in patients requiring maintenance intensification (9.7 μg/ml vs 12.2 µg/ml, p < 0.0001). ADA week 6 trough levels >12.27 μg/ml predicted BR at week 24 with 79.7% specificity and 79.5% positive predictive value. Patients in the third quartile (Q3) and fourth quartile (Q4) of ADA levels at week 6 exhibited higher rates of BR at week 24, BR at week 52, 1-year drug survival, and less need for dose escalation (all p-values <0.05). In logistic regression, Q3 and Q4 of week 6 levels were significantly associated with BR at week 24 (p = 0.02 and p = 0.001); and week 6 Q4 with BR at week 52 (p = 0.02), treatment persistence (p = 0.03), and lower dose escalation (p = 0.004). ADA trough levels at week 2 did not show similar associations.
Conclusion:
ADA trough levels at week 6 are associated with BR at weeks 24 and 52, drug survival, and need for dose escalation in CD. However, ADA concentrations at week 2 failed to yield similar results.
Plain language summary
This study investigated whether early monitoring of adalimumab (ADA) levels in patients with Crohn’s disease (CD) could predict remission and improve treatment success. We aimed to identify the best timepoint and threshold for ADA monitoring, hypothesizing that early induction (week 2) and early maintenance levels (week 6) would correlate with long-term remission. CD is a chronic condition causing significant health issues, including inflammation and complications requiring surgery. Biological remission, measured through biomarkers like fecal calprotectin and C-reactive protein, is a key treatment goal. Understanding how ADA levels predict remission could improve treatment strategies and benefit a wide range of patients. We analyzed data from 112 CD patients treated with ADA. ADA levels were measured at weeks 2 and 6, and remission was assessed at weeks 24 and 52. We examined the association between ADA levels and treatment outcomes, such as dose adjustments and treatment persistence. We found that ADA levels at week 6 were significantly associated with achieving remission at weeks 24 and 52. Patients with ADA levels above 12.27 μg/ml at week 6 were more likely to remain in remission, avoid dose escalation, and continue treatment successfully. However, ADA levels at week 2 did not predict these outcomes. This research highlights the importance of early ADA monitoring during maintenance rather than induction. By identifying an optimal time and threshold for monitoring, this study offers a potential strategy to personalize treatments, reduce complications, and improve long-term outcomes for CD patients. These findings emphasize the need for further research to refine therapeutic monitoring guidelines.
Introduction
Inflammatory bowel diseases (IBD), namely Crohn’s disease (CD) and ulcerative colitis (UC), are “remitting-relapsing” diseases of multifactorial etiology mainly comprising the gastrointestinal tract. CD involves all layers of the bowel wall, generates long-term disabling consequences (e.g., stenosis or fistulizing disease), 1 and poses a significant risk of surgery. 2
Adalimumab (ADA) is a tumor necrosis factor inhibitor (TNFi) licensed for the treatment of CD in Europe since 2006, with proven efficacy in both the induction and maintenance of remission.3,4 Previous trials have shown that ADA-based treatment strategies aiming at the normalization of biochemical parameters (such as fecal calprotectin (Fcal) and C-reactive protein (CRP)) can avoid CD-derived complications. 5 In fact, biological remission (BR) is nowadays considered a main therapeutic target for IBD patients, according to the International Organization for Inflammatory Bowel Disease (IOIBD) guidelines. 6
Evidence regarding therapeutic drug monitoring (TDM) of TNFi trough levels in the context of IBD remains contradictory, with published trials both in favor and against TNFi TDM.7,8 Moreover, recent trials suggest no benefit of a higher induction ADA dose over the standard induction dosing in IBD.9,10 Still, official guidelines and expert reviews recommend performing TDM during the induction and maintenance phase, to guide decision-making.11–13
Therefore, we aimed to study the relationship between ADA trough levels during the early stages of treatment (after the first induction dose, at week 2, and after the first maintenance dose, at week 6) with BR and drug survival outcomes in CD patients treated with this drug.
Materials and methods
We conducted a retrospective, unicentric cohort study at the IBD unit of a tertiary referral hospital in Madrid, Spain. We included patients aged over 18 with a diagnosis of CD according to ECCO guidelines, 14 who received treatment with ADA from 2016 to 2022. Other inclusion criteria that had to be met were available ADA trough levels at weeks 2 and 6, as well as Fcal and CRP determination at week 24 to assess for BR. We only considered patients receiving ADA for the induction of remission or treatment of postoperative recurrence (POR), for at least 6 months. Exclusion criteria were patients treated with ADA for POR prevention or perianal disease as the main indication, patients with unavailable ADA trough levels or laboratory parameters to evaluate the primary endpoint, or ADA treatment for less than 6 months.
Demographic and clinical data retrieved from digital hospital records were as follows: age, sex, smoking status, body mass index (BMI), duration of disease (months from diagnosis), location and behavior of CD according to Montreal classification, presence of perianal disease, co-treatment with an immunomodulator (IMM: azathioprine (AZA) or methotrexate (MTX)), co-treatment with glucocorticoids during induction (prednisone or budesonide), number of prior biologic therapies, previous CD-related surgery, need for dose escalation during the first year of treatment, and treatment survival during the same period. Incomplete values in baseline numeric continuous variables such as BMI (11 missing values) and baseline albumin (18 missing values) were imputed with the mean or median, depending on the distribution of each variable.
BR was defined as a combination of Fcal <200 µg/g and CRP <5 mg/dl at any given timepoint (week 24 or week 52). The Fcal cutoff level was set at 200 µg/g since it has previously been associated with the absence of endoscopic ulcerations in CD regardless of disease location. 15
The primary outcome of the study was the association between ADA trough levels at weeks 2 and 6 with BR at week 24. Secondary outcomes were the association between ADA levels at weeks 2 and 6 with BR at week 52, and the association between ADA at weeks 2 and 6 with the need for dose escalation in maintenance and treatment persistence during the first year of therapy. Patients were stratified into quartiles based on their ADA trough levels at weeks 2 and 6 (first quartile (Q1), second quartile (Q2), third quartile (Q3), and fourth quartile (Q4)), and quartile-specific comparisons were performed to evaluate differences in the proportion of patients achieving the primary and secondary endpoints.
Dose escalation in maintenance was defined as patients switching from ADA 40 mg every other week (eow) to 40 mg weekly or 80 mg eow. Treatment persistence was defined as patients still undergoing treatment with ADA at week 52 evaluation.
ADA trough levels were measured using Enzyme-Linked ImmunoSorbent Assay (Promonitor®; Grifols Diagnostic Solutions Inc., Emeryville, USA).
Quantitative continuous variables with normal distribution are described as means with standard deviation (SD), while those with non-normal distribution are presented as medians with interquartile range. Categorical variables are summarized as frequencies with percentages (%). The normality of continuous variables was assessed using the Shapiro–Wilk test. For the comparison of continuous variables, Student’s t-test was applied for normally distributed data, and the Wilcoxon rank-sum test (Mann–Whitney U) was used for non-normally distributed data. Categorical variables were compared using the Chi-squared test when expected frequencies were ⩾5 in all cells; otherwise, Fisher’s exact test was applied.
To assess the accuracy of early ADA trough levels with respect to BR, receiver operating characteristic (ROC) curves were constructed for both ADA concentrations at weeks 2 and 6; the area under the ROC curve (AUC) was computed as a measure of the overall discriminative ability of the test. In addition, the Youden Index was calculated for each threshold value to determine the optimal cutoff point for BR. Finally, logistic regression was fitted for variables showing significant differences in univariate analysis, and for baseline variables considered clinically significant based on current evidence16,17 (sex, CD location according to Montreal, CD behavior according to Montreal, perianal involvement, duration of disease, smoking status, BMI, baseline Fcal levels, baseline CRP levels, baseline albumin levels, and IMM usage). Dependent variables analyzed were BR at week 24, BR at week 52, 1-year treatment persistence, and the need for dose escalation. Odds ratios (ORs) with 95% confidence intervals (CIs) and p-values were calculated using univariate logistic regression. Variables with p < 0.1 in the univariate regression, if any, were considered for inclusion in a multivariable model.
Statistical analyses and graphs were obtained using RStudio (version 2023.09.1+494 for macOS; RStudio Team, Boston, MA, USA) and significance was set at p < 0.05.
The reporting of this study conforms to the Strengthening the Reporting of Observational Studies in Epidemiology (STROBE) statement (Supplemental Material). 18
Results
A total of 112 patients were selectively included: 89 patients (79.46%) were treated with ADA for the induction of remission and 23 patients (20.54%) received ADA for the treatment of POR. 64 of these patients (57.1%) were in BR at week 24. Self-reported sex was male in 62 patients (55%); the mean age of the cohort was 50 (SD 17) years old, and predominant location and behavior according to Montreal classification were ileal (L1, n = 59, 53%) and inflammatory (B1, n = 49, 44%). Most of the study population (n = 81, 72%) had no prior biologic failure, while 28 patients (25%) had previously failed 1 biologic drug, 2 patients (1.8%) received ADA after 2 previous biologics, and only 1 patient (0.9%) was treated with ADA after 3 previous advanced therapies. Non-achievers of BR at week 24 had significantly higher baseline levels of activity biomarkers, both Fcal (530 (193–1320) µg/g vs 241 (117.8–473.2) µg/g, p = 0.029) and CRP (10.4 (3.4–20.9) mg/dl vs 5.33 (1–14.57) mg/dl, p = 0.007], as well as lower baseline albumin (4.14 (SD 0.4) g/dl vs 4.3 (SD 0.4) g/dl, p = 0.047). Forty patients (36%) received IMM co-treatment; median trough levels of ADA at weeks 2 and 6 in this subgroup did not differ significantly with respect to patients not receiving IMM (12.55 (9.8–15.91) µg/ml vs 11.93 (9.5–14) µg/ml, p = 0.35 for ADA week 2, and 11.9 (9.48–15.79) µg/ml vs 11.6 (8.89–14.97) µg/ml, p = 0.57 for ADA week 6). Only 5 patients (4.5%) (4 (8.3%) non-responders and 1 (1.6%) responder) developed antibodies to adalimumab (ATAs) during maintenance. No significant differences were observed regarding the rest of the baseline characteristics, which are reflected in Table 1.
Baseline characteristics of the study population.
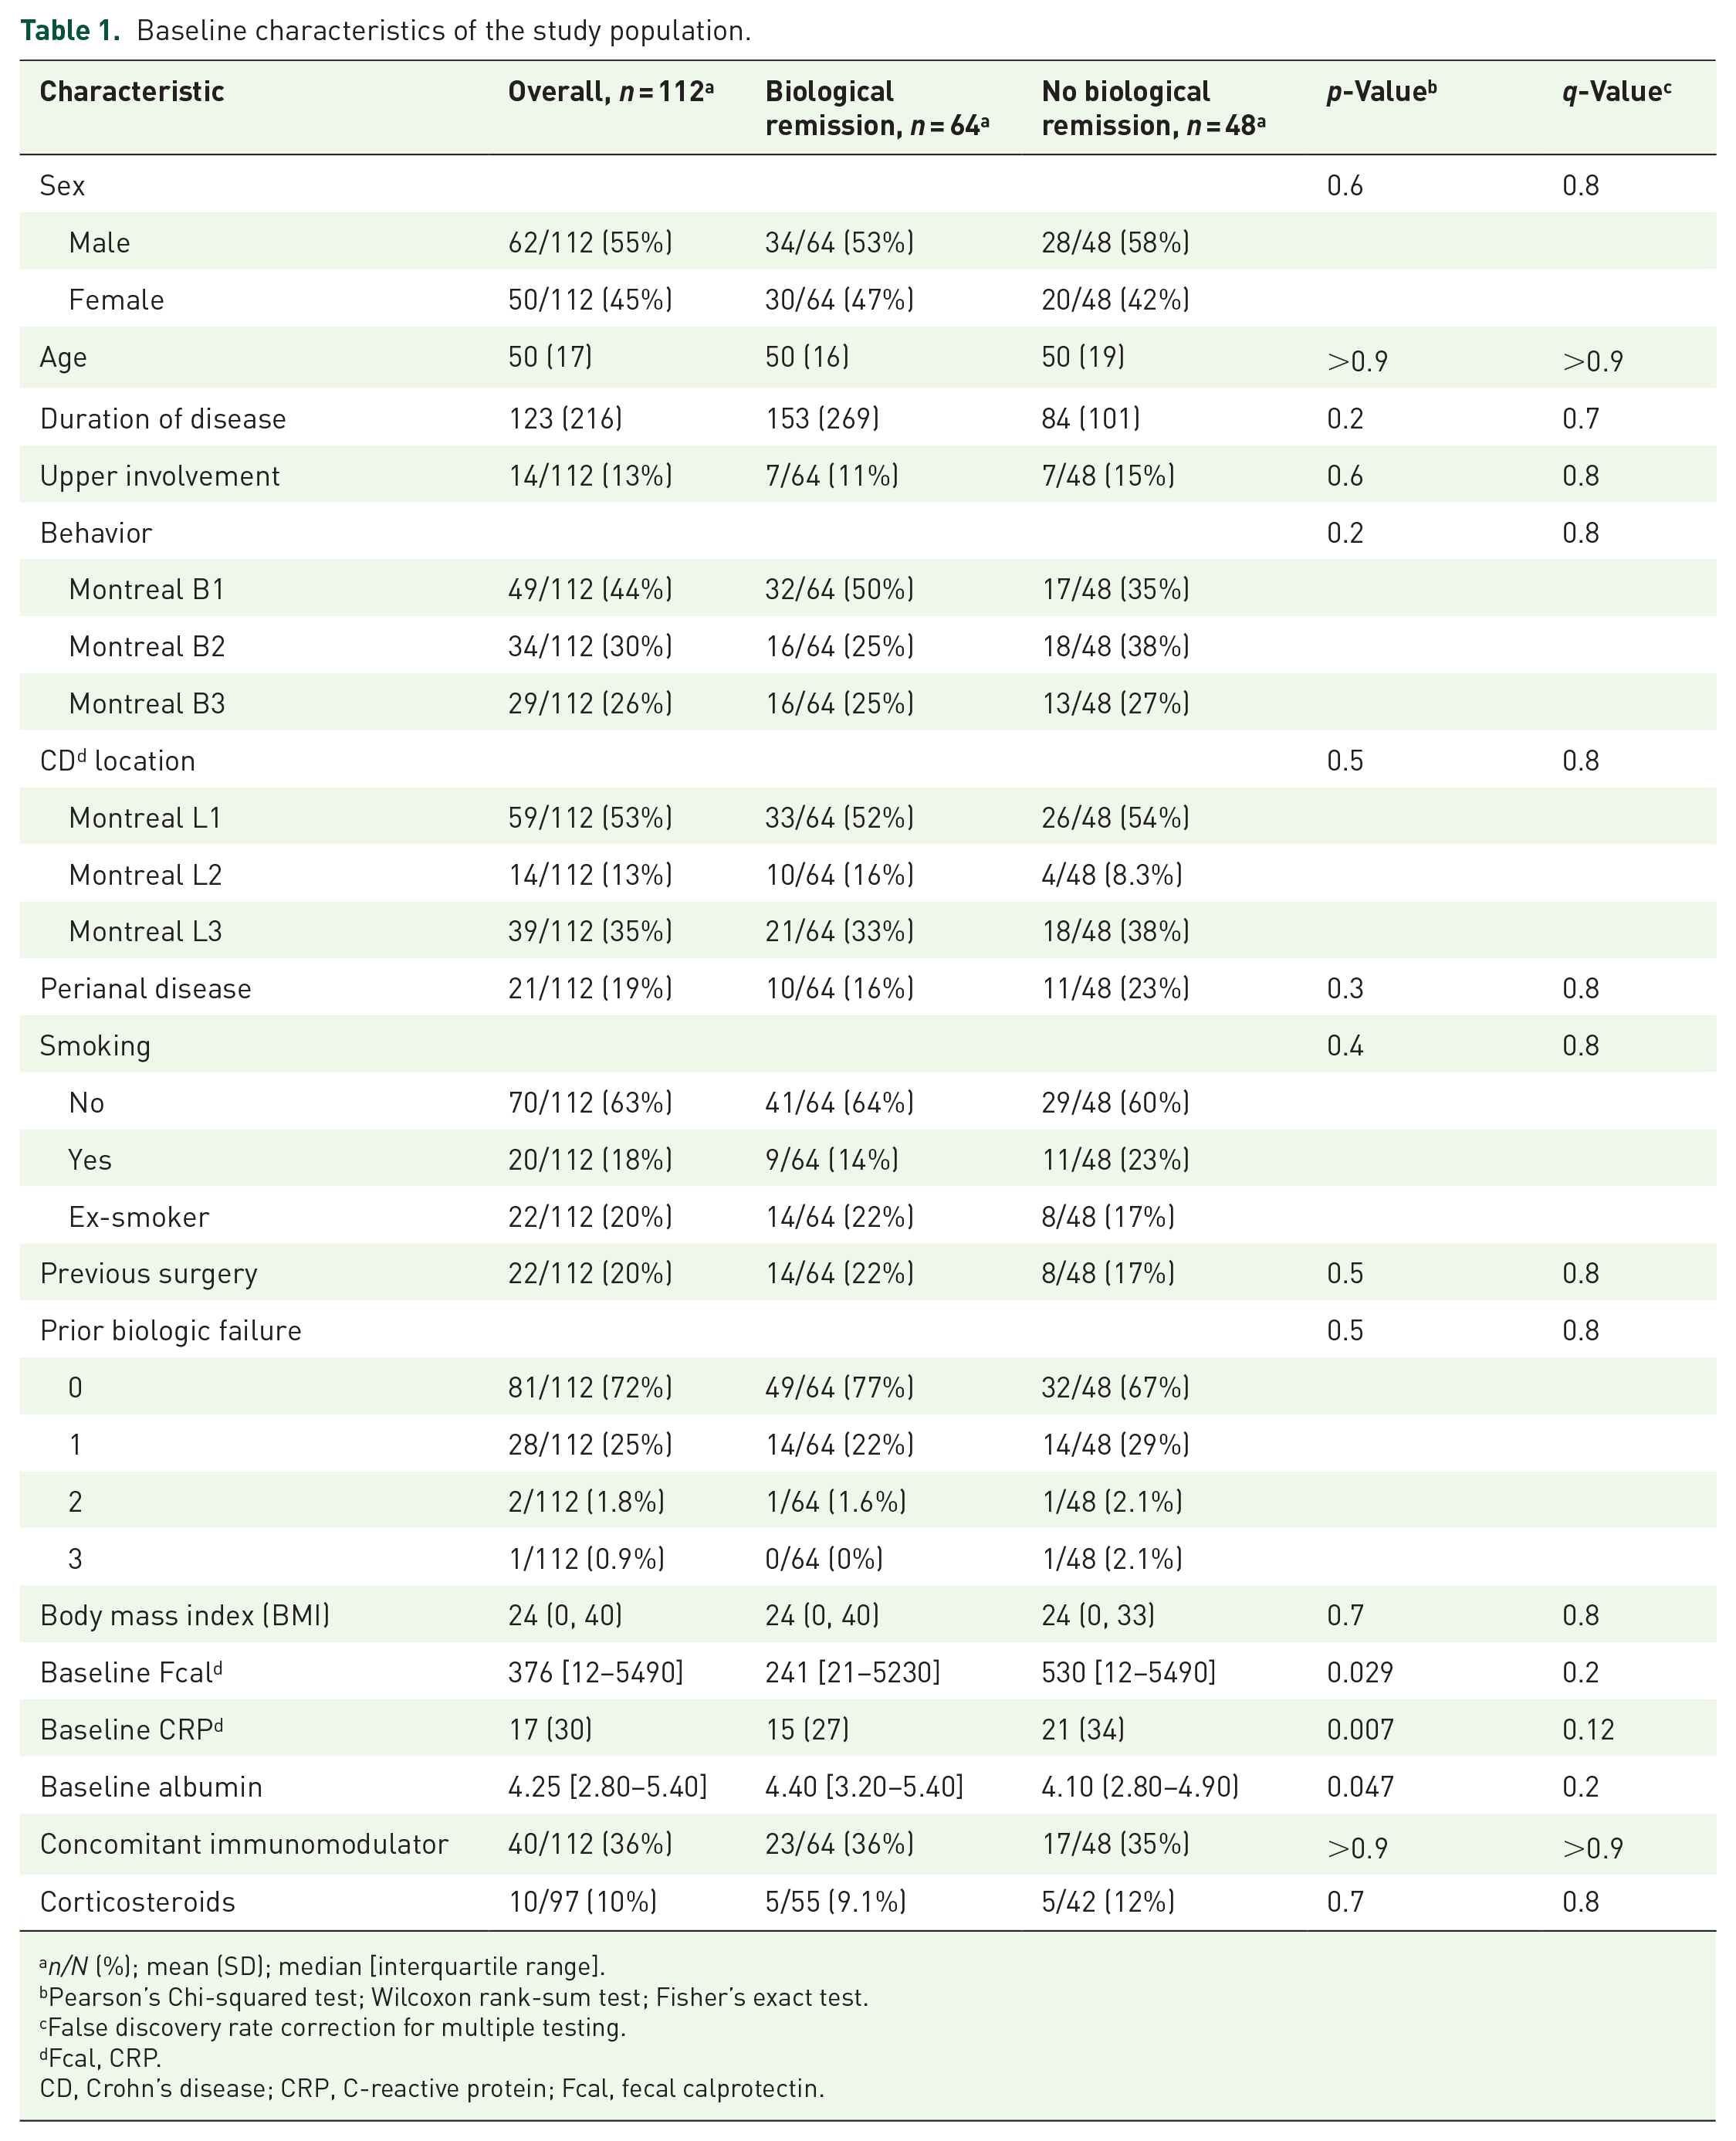
n/N (%); mean (SD); median [interquartile range].
Pearson’s Chi-squared test; Wilcoxon rank-sum test; Fisher’s exact test.
False discovery rate correction for multiple testing.
Fcal, CRP.
CD, Crohn’s disease; CRP, C-reactive protein; Fcal, fecal calprotectin.
Weeks 2 and 6 ADA trough levels and BR at week 24
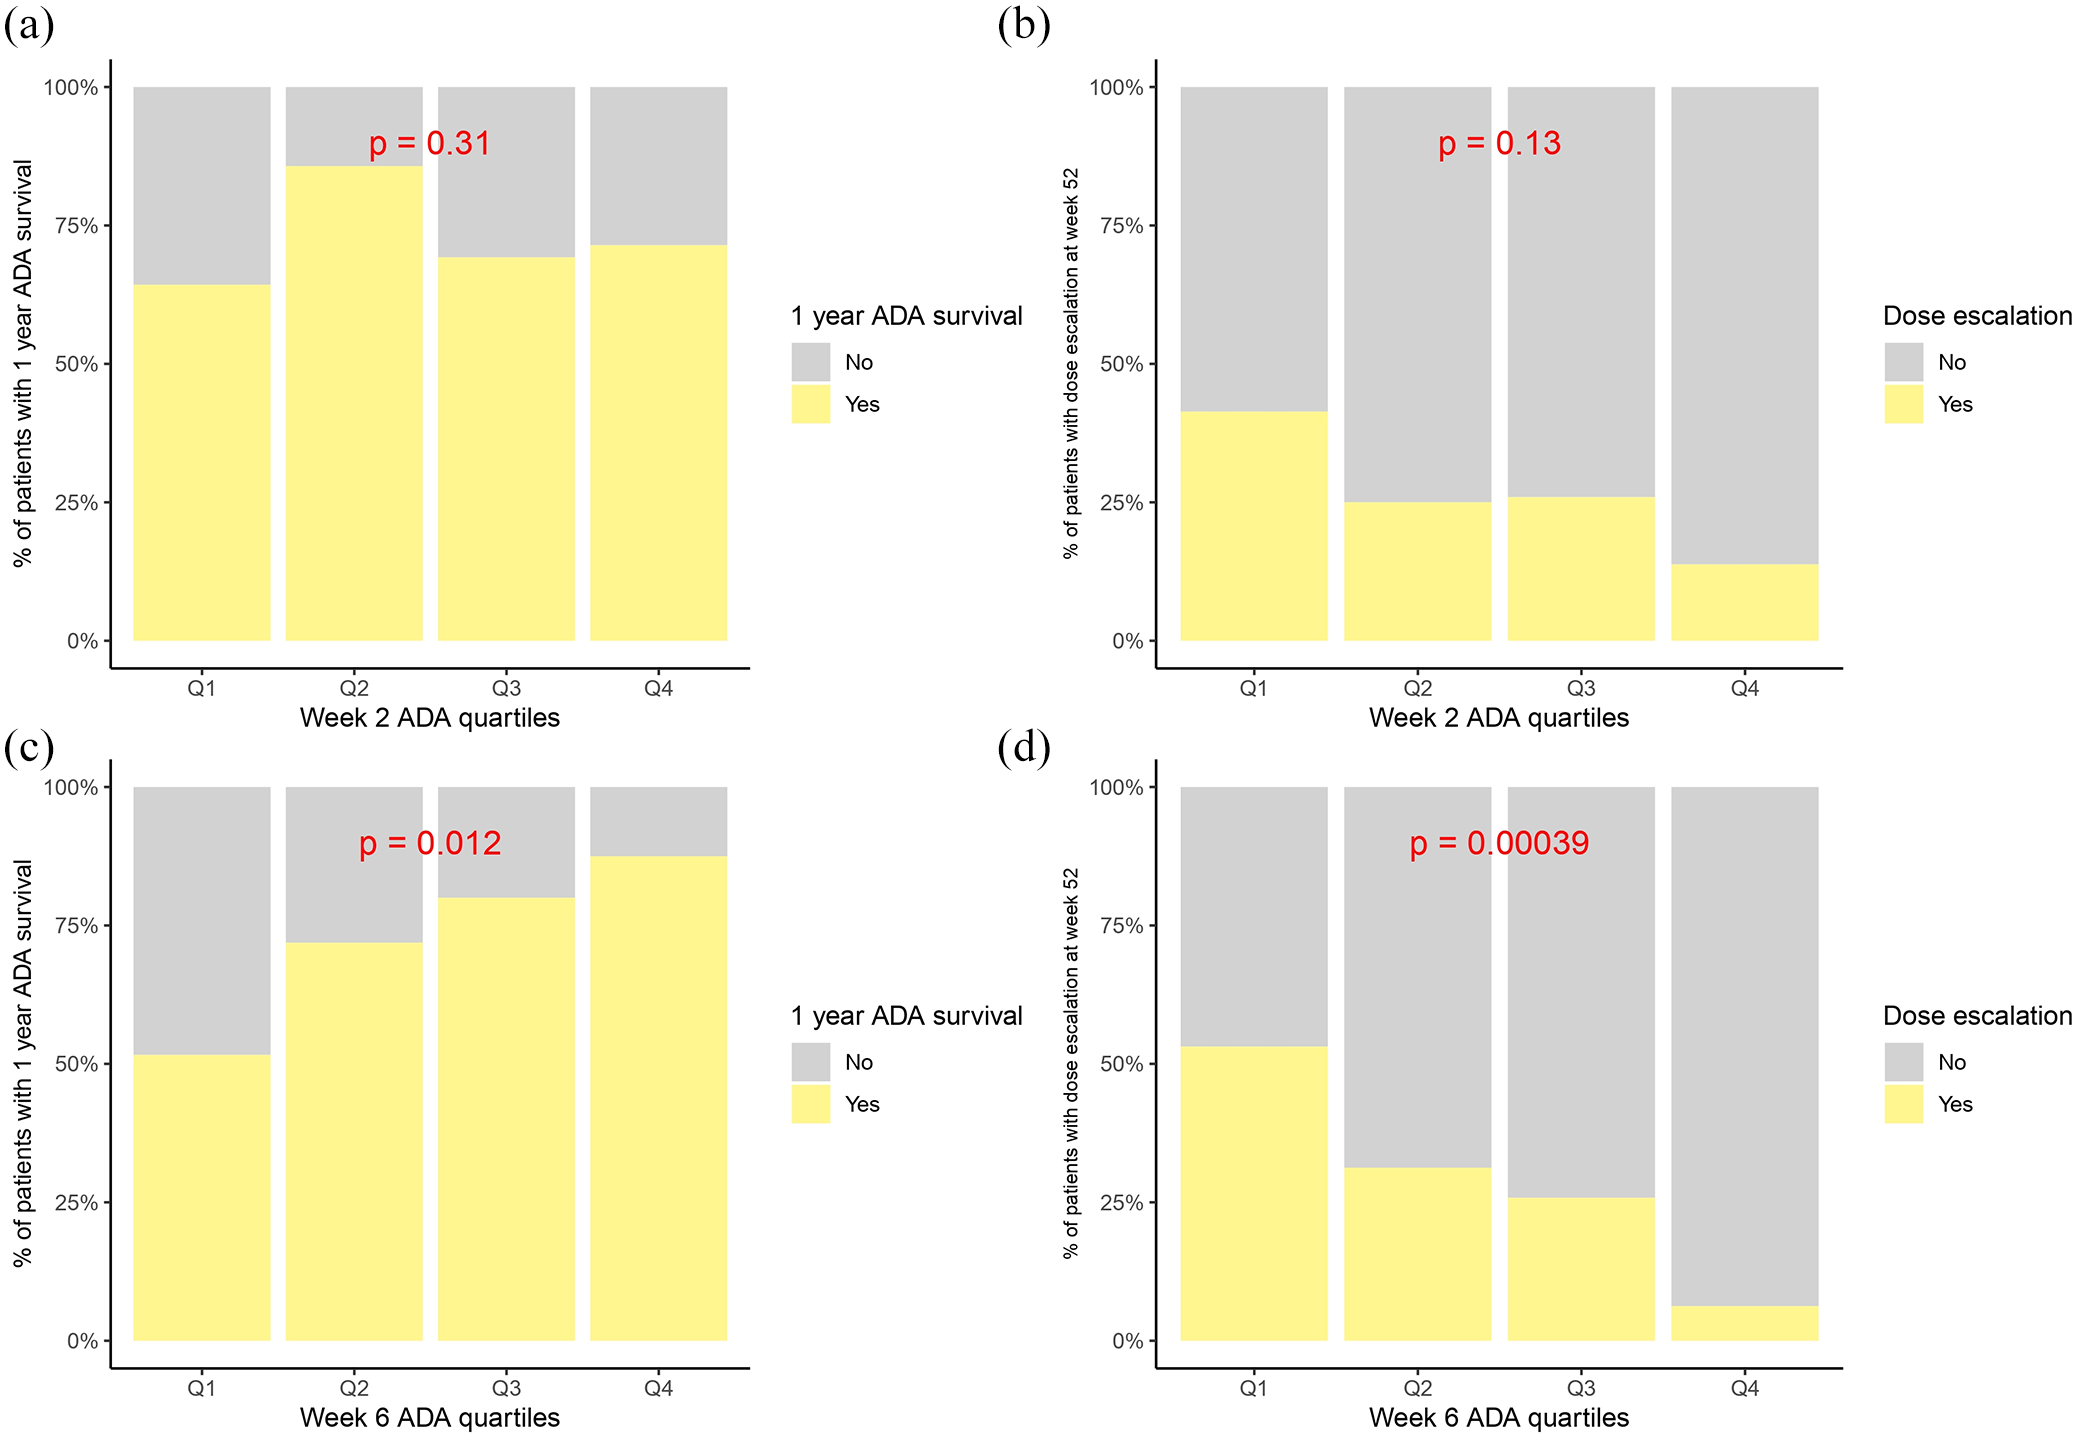
ADA trough levels at week 2 showed no significant differences between patients who were in BR at week 24 and those who were not (11.9 (10.07–15.46) µg/ml vs 11.48 (9.5–14) µg/ml, p = 0.81). However, ADA trough levels at week 6 were significantly higher in patients achieving BR at week 24 than in those who did not: 12.32 (10.11–16.84) μg/ml vs 10.3 (7.4–12.17) μg/ml (p = 0.0008) (Figure 1). No statistically significant differences were found in the proportion of patients achieving BR between quartiles of ADA week 2 (50% in Q1, 58.06% in Q2, 57.69% in Q3, and 66.67% in Q4, p = 0.76). With regards to week 6, rates of BR at week 24 were 73.1% for patients in Q3 and 83.3% for patients in Q4, while only 38.7% of patients in Q1 and 51.6% of patients in Q2 achieved this endpoint (p = 0.005) (Figure 3).

Association between ADA through levels at weeks 2 and 6 versus different assessment timepoints for biological remission.
Weeks 2 and 6 ADA trough levels and BR at week 52, 1-year treatment persistence and need for dose escalation
In all, 105 patients (93.75%) had available data to assess BR, treatment survival, and need for dose escalation at week 52, while 7 patients (6.25%) had incomplete hospital records regarding these endpoints and were therefore excluded from the analysis.
Out of these, 54 (51.42%) patients fulfilled the criteria for BR at week 52. ADA week 6 trough levels were significantly higher in this subgroup (12.3 (10.17–13.93) μg/ml vs 10.86 (7.85–13.74) μg/ml, p = 0.035). ADA levels at week 6 were also higher in those who continued treatment at week 52 (n = 81, 77.14%) compared to those who did not (n = 24, 22.8%): 12.17 (10.08–15.89) μg/ml vs 9.7 (7.16–11.6) μg/ml, p = 0.03. Median ADA trough levels at week 6 were lower in patients needing dose escalation during maintenance (n = 31, 29.5%) with respect to patients keeping the standard dosing (n = 74, 70.5%): 9.7 (7.21–12.2) μg/ml vs 12.2 (10.5–17.27), p < 0.0001.
Increasing quartiles of week 6 ADA levels were significantly associated with BR at week 52 (p = 0.03 for Q4 vs Q1), 1-year treatment persistence (p = 0.01), and lower need for intensification (p = 0.0003), while ADA trough levels at week 2 were not associated with any of these endpoints (Figures 1–4).

Association between ADA through levels at week 2, week 6, treatment persistence at w52, and need for dose escalation in maintenance.

Barplots with p-values for quartile-specific comparison between ADA levels and biologic remission at weeks 24 and 52. (a) Week 2 ADA quartiles and BR at week 24. (b) Week 2 ADA quartiles and BR at week 52. (c) Week 6 ADA quartiles and BR at week 24. (d) Week 6 ADA quartiles and BR at week 52.
Barplots with p-values for quartile-specific comparison between ADA levels, treatment survival, and need for dose escalation. (a) Week 2 ADA quartiles and drug survival. (b) Week 2 ADA quartiles and dose escalation. (c) Week 6 ADA quartiles and drug survival. (d) Week 6 ADA quartiles and dose escalation.
Diagnostic performance of ADA cutoff levels at weeks 2 and 6 for BR at weeks 24 and 52
ROC curve analysis for ADA at week 6 and BR at week 24 yielded an AUC of 0.70 (95% CI: 0.5982–0.799, DeLong method). The Youden Index rendered an optimal ADA week 6 cutoff level of 12.27 μg/ml, with 55.6% sensitivity, 79.7% specificity, 79.5% positive predictive value (PPV), 55.5% negative predictive value, and 65.4% accuracy for BR at week 24. For ADA at week 6 and BR at week 52, the AUC was 0.63 (95% CI: 0.5188–0.7346, DeLong method), and the Youden Index identified 11.25 μg/ml as the optimal cutoff level. Complete results are presented in Figure 5 and Table 2.

ROC curves for ADA concentrations at week 6 and biological remission at weeks 24 and 52.
Diagnostic test accuracy values for ADA cutoff points at week 6 and biological remission at weeks 24 and 52 were estimated using the Youden Index.

ACC, accuracy; ADA, adalimumab; E, specificity; NPV, negative predictive value; PPV, positive predictive value; S, sensitivity.
Univariate and multivariate logistic regression for BR at weeks 24 and 52, 1-year treatment persistence, and need for dose escalation
In univariate logistic regression, variables significantly associated with BR at week 24 included Q3 and Q4 of ADA trough levels at week 6 (OR 3.68, 95% CI (1.23–11.8), p = 0.02; and OR 7.77, 95% CI (2.25–32.5), p = 0.001, respectively). Q4 of ADA trough levels at week 6 was also significantly associated with BR at week 52 (OR 3.61, 95% CI (1.18–11.9), p = 0.02), 1-year treatment persistence (OR 3.33, 95% CI (1.17–12.01), p = 0.03), and a decreased need for dose escalation (OR 0.11, 95% CI (0.01–0.41), p = 0.004). In addition, duration of disease (OR 1.004, 95% CI (1.0007–1.009), p = 0.04) and baseline albumin (OR 6.26, 95% CI (2.05–21.64), p = 0.002) were significantly associated with 1-year treatment persistence.
Among the dependent variables analyzed, 1-year persistence was the only outcome with more than one significant association in univariate regression. After fitting the multivariable model, only albumin remained significantly associated with 1-year persistence (OR 4.60, 95% CI (1.40–17.4), p = 0.01). The complete results of logistic regression are shown in Tables 3–5.
Logistic regression results for biologic remission at weeks 24 and 52.

ADA, adalimumab.
Bold values represent statistically significant results.
Univariate logistic regression results for dose escalation and 1-year treatment survival.

Bold values represent statistically significant results.
Multivariable logistic regression results regarding 1-year treatment persistence.

Bold values represent statistically significant results.
Discussion
This analysis of ADA-treated CD patients reveals a consistent association between ADA concentrations at week 6 and biological outcomes (such as normalization of Fcal and CRP), drug survival (1-year treatment persistence), and the need for dose adjustment in CD. This underscores the possibility of an earlier time frame for ADA assessment in the post-induction phase, facilitating a prompt evaluation of drug response. In addition, we propose estimated cutoff drug levels to guide dose adjustments in this scenario. However, ADA trough levels at week 2 failed to yield similar results.
Biologic remission has emerged as a cornerstone therapeutic target for IBD. 19 The landmark CALM study already proved the superiority of a biomarker-based treatment strategy, instead of aiming for clinical remission alone 20 ; and recently, long-term extension data from the same trial revealed that deep remission was a protective factor against major adverse outcomes that indicate CD progression (i.e., phenotype progression, development of perianal fistulae, CD-derived hospitalizations, and surgery; HR 0.19; 95% CI (0.07–0.31)). 5 Also, venipuncture and stool collection are among the highest accepted diagnostic assessment tools from IBD patients’ perspective. 21 Therefore, it is reasonable to prioritize biologic remission as a therapeutic goal, given its long-term benefits and the willingness of patients to undergo necessary diagnostic procedures.
Although there is no defined timeframe, it is recommended that the evaluation period for the primary response to anti-TNFs be extended up to week 14 after the initiation of treatment.22,23 In fact, the prospective PANTS (Personalised anti-TNF therapy in Crohn’s disease study) cohort demonstrated that low TNFi (both ADA and infliximab) concentrations at this timepoint were the only variable associated with primary non-response (PNR) (OR 0.13 (0.06–0.28), p < 0.0001) 24 ; and Plevris et al. found that ADA trough levels at week 12 were significantly lower in patients not achieving BR at that timepoint (8.0 µg/ml vs 12 µg/ml; p < 0.0001). 25 Therefore, earlier ADA concentrations could pose an opportunity for dose adjustment to reduce PNR rates. In our experience, higher week 6 ADA levels are associated with BR, lower rates of dose escalation during maintenance, and higher treatment persistence; thus, they could serve as an additional assessment point for timely treatment adjustment.
ADA trough levels after the first induction dose, at week 2, have also been suggested as a potential timepoint for ADA dose optimization. Buffone et al. 26 observed higher rates of short-term clinical remission (at week 12) in both CD and UC patients with ADA levels at week 2 >11.9 µg/ml (OR 3.34, 95% CI (1.01–12.11), p = 0.04). We did not identify an association between ADA levels at week 2 and BR, the need for treatment intensification, or drug survival. However, differences in study populations and primary endpoints (clinical vs biological) hinder the comparison between studies. On the other hand, a prospective randomized, double-blind, placebo-controlled trial investigating an upfront higher induction ADA dose in CD did not find any benefit in terms of short-term biologic remission (Fcal <250 µg/g and CRP <5 mg/dl at week 4: 32.5% vs 27.7%, p = 0.293). 9 In addition, recent evidence suggests that pharmacokinetic measures, such as ADA clearance, and personalized dosing models tailored to individual patient characteristics may outperform drug concentrations alone in predicting therapeutic outcomes.27,28 Focusing on these more contemporary approaches could provide greater insights into the role of ADA TDM during the induction phase of treatment.
This study has several limitations. First, its retrospective design renders it susceptible to all biases inherent to this type of study, especially selection and confounding biases. Clinical remission data were not included due to the subjective components of the Harvey Bradshaw Index (HBI), making retrospective assessment of the HBI difficult in our cohort 26 ; and endoscopic response or remission could not be evaluated also due to variability in timing, as endoscopic assessments were not consistently performed at specific timepoints. Nevertheless, previous research has associated Fcal values >200 µg/g with endoscopic ulcerations in CD 29 ; thus, lower values are presently considered surrogate biomarkers for endoscopic remission. 15 Specific timeframes for dose escalation during maintenance were not accounted for, potentially distorting rates of BR at week 24 if patients switched regimes before BR assessment. However, most of the patients switching to an intensified ADA dose were still non-achievers of BR at week 24. Although an association between ADA levels at week 6 and BR at weeks 24 and 52 was found, the diagnostic accuracy for the estimated cutoff levels was modest. This highlights the limited ability of drug concentrations alone to predict therapeutic outcomes. Also, as previously stated, pharmacokinetic models and clearance outcomes are more useful than drug concentrations alone, but such approaches are not available at most institutions. Finally, low rates of immunogenicity in our study hinder the investigation of the association of ATAs with BR, and co-treatment with IMM or ADA concentrations. This is because our site employs a drug-sensitive assay, which only detects ATAs when drug levels are absent. 30
On the other hand, our work has strengths to mention. Unlike the traditional focus on later ADA levels as predictors of subsequent response (e.g., week 14), our institution uses week 6 TDM, as it is the first trough concentration reflecting maintenance serum levels. In the study, we demonstrated that week 6 levels have predictive value for biological remission, need for intensification, and drug survival, as supported by logistic regression. These results highlight the potential to adjust treatment strategies earlier, potentially reducing the risk of primary or secondary loss of response, and may be used as guidance in the design of future prospective studies addressing timepoints of ADA optimization.
Conclusion
ADA trough levels at week 6 in our study show an association with BR at weeks 24 and 52, as well as with favorable drug survival outcomes, such as the need for dose escalation and treatment persistence. Week 6 ADA levels >12.27 µg/ml predict BR at week 24 with acceptable specificity and PPV. However, ADA concentrations during induction (week 2) fail to yield similar results. These findings suggest the potential utility of early ADA monitoring in maintenance, but not during induction, to optimize mid- and long-term treatment outcomes. However, prospective trials and studies using approaches such as pharmacokinetic models and drug clearance are still needed to determine optimal ADA performance.
Supplemental Material
sj-docx-1-tag-10.1177_17562848251324226 – Supplemental material for Association of early therapeutic drug monitoring of adalimumab with biologic remission and drug survival in Crohn’s Disease
Supplemental material, sj-docx-1-tag-10.1177_17562848251324226 for Association of early therapeutic drug monitoring of adalimumab with biologic remission and drug survival in Crohn’s Disease by José Luis Rueda García, Cristina Suárez-Ferrer, Clara Amiama Roig, Laura García Ramírez, Cristina García Rojas, Eduardo Martín-Arranz, Joaquín Poza Cordón, María Sánchez Azofra, Jesús Noci, Cristina Cubillo García and María Dolores Martín-Arranzz in Therapeutic Advances in Gastroenterology
Footnotes
Acknowledgements
The authors would like to express their gratitude to Macarena Villagrán García for her valuable assistance in graphing boxplots and performing statistical analyses.
Declarations
Supplemental material
Supplemental material for this article is available online.
References
Supplementary Material
Please find the following supplemental material available below.
For Open Access articles published under a Creative Commons License, all supplemental material carries the same license as the article it is associated with.
For non-Open Access articles published, all supplemental material carries a non-exclusive license, and permission requests for re-use of supplemental material or any part of supplemental material shall be sent directly to the copyright owner as specified in the copyright notice associated with the article.