
Abstract
Magnetic resonance enterography (MRE) is a leading radiological modality in Crohn’s disease (CD) and is used together with laboratory findings and endoscopic examinations for the evaluation of patients during initial diagnosis and follow up. Over the years, there has been great progress in the understanding of CD and there is a continuous strive to achieve better monitoring of patients and to develop new modalities which will predict disease course and thus help in clinical decisions making. An objective evaluation of CD using a quantification score is not a new concept and there are different clinical, endoscopies, radiological and combined indices which are used in clinical practice. Such scores are a necessity in clinical trials on CD for evaluation of disease response, however, there is no consensus of the preferred MRE score and they are not routinely used. This review presents MRE-based indices in use in the last decade: the Magnetic Resonance Index of Activity (MaRIA), the Clermont score, the Crohn’s Disease Magnetic Resonance Imaging (MRI) Index (CDMI), the Magnetic Resonance Enterography Global Score (MEGS) and the Lemann index. We compare the different indices and evaluate the clinical research that utilized them. The aim of this review is to provide a reference guide for researchers and clinicians who incorporate MRE indices in their work. When devising future indices, accumulated data of the existing indices must be taken into account, as each of the current indices has its own strengths and weakness.
Keywords
Introduction
Crohn’s disease (CD) is a chronic inflammatory disease of the bowel wall and can affect any part of the gastrointestinal (GI) tract. The disease is characterized by recurrent relapses and cause great impairment to a patient’s life. During the course of the disease significant complications such as strictures, abscess or fistula can occur. 1
Management of the disease was once solely based on patients’ symptoms. In recent years, there was a change in concept and new therapeutic goals have emerged.2,3 Considerable efforts are being taken to achieve mucosal healing which is considered one of the best therapeutic endpoints in CD, as it is associated with sustained clinical remission, reduced rates of hospitalization and decreased risk of surgery.4–6 Thus, monitoring of patients requires closer follow up and frequent evaluations.
Because CD is known as a transmural disease and assessing the mucosal lining may not reflect the true extent of the disease, the importance of transmural healing is being evaluated these days. 7 Radiological assessment is important when assessing transmural involvement, as endoscopy is limited to the assessment of the mucosa.
To date, ileocolonoscopy remains the reference standard for evaluation of disease activity in CD. However, it’s an invasive procedure with low tolerability by the patient and allows visualization of the mucosal surface only without assessing extraluminal complications. Furthermore, many of CD patients have disease restricted to the small bowel which is not visualized well by conventional endoscopy.
Magnetic resonance enterography (MRE) has become one of the prime modalities for the assessment of CD. 8 Many studies have focused on developing indices for quantification of active disease which will help in guidance of patients’ therapy. MRE indices serve as a disease quantification tool and thus may help standardize measured outcomes in clinical trials of treatment interventions for CD. In addition, these indices may be used in academic research and when validated may provide a quantified clinical decision tool for estimating mucosal healing.
The aim of our study is to introduce the major and most recent MRE-based scores for quantification of active CD patients.
Search strategy and study selections
This is a review article and therefore ethics approval and informed consent were not required for this review.
An extensive literature search of the PubMed database encompassing a period of the preceding 10 years (January 2008–September 2017) was performed.
In order to find all relevant citations, the following combination of Mesh terms or keywords was applied: (‘score’ OR ‘scores’ OR ‘indices’ OR ‘index’) AND (‘magnetic resonance enterography’ OR ‘MR enterography’ OR ‘MRE’ OR ‘magnetic resonance imaging’ OR ‘MR imaging’ OR ‘MRI’) AND (‘crohn’s disease’ OR ‘crohn disease’). The search was restricted to articles in the English language.
Studies were selected using a few-steps process: we first scanned all headlines and abstracts and excluded articles that did not meet the following inclusion criteria:
1) MRE or magnetic resonance enteroclysis were the performed radiologic modalities
2) Only CD patients were included
In our review we chose to describe only MRE indices which are currently at the center of research. Therefore, for an index to be included it must have been investigated by more than one research group except for the original developing group. Other indices were excluded9–25 (Figure 1). Finally, five indices were included in this review; the Magnetic Resonance Index of Activity (MaRIA), the Clermont score, the Crohn’s Disease Magnetic Resonance Imaging (MRI) Index (CDMI), the Magnetic Resonance Enterography Global Score (MEGS) and the Lemann index. The methodology of their designing studies is specified in Table 1 and the MRE parameters included in each of the indices is detailed in Table 2.

Flowchart of study selection.
Methodology of the designing studies.
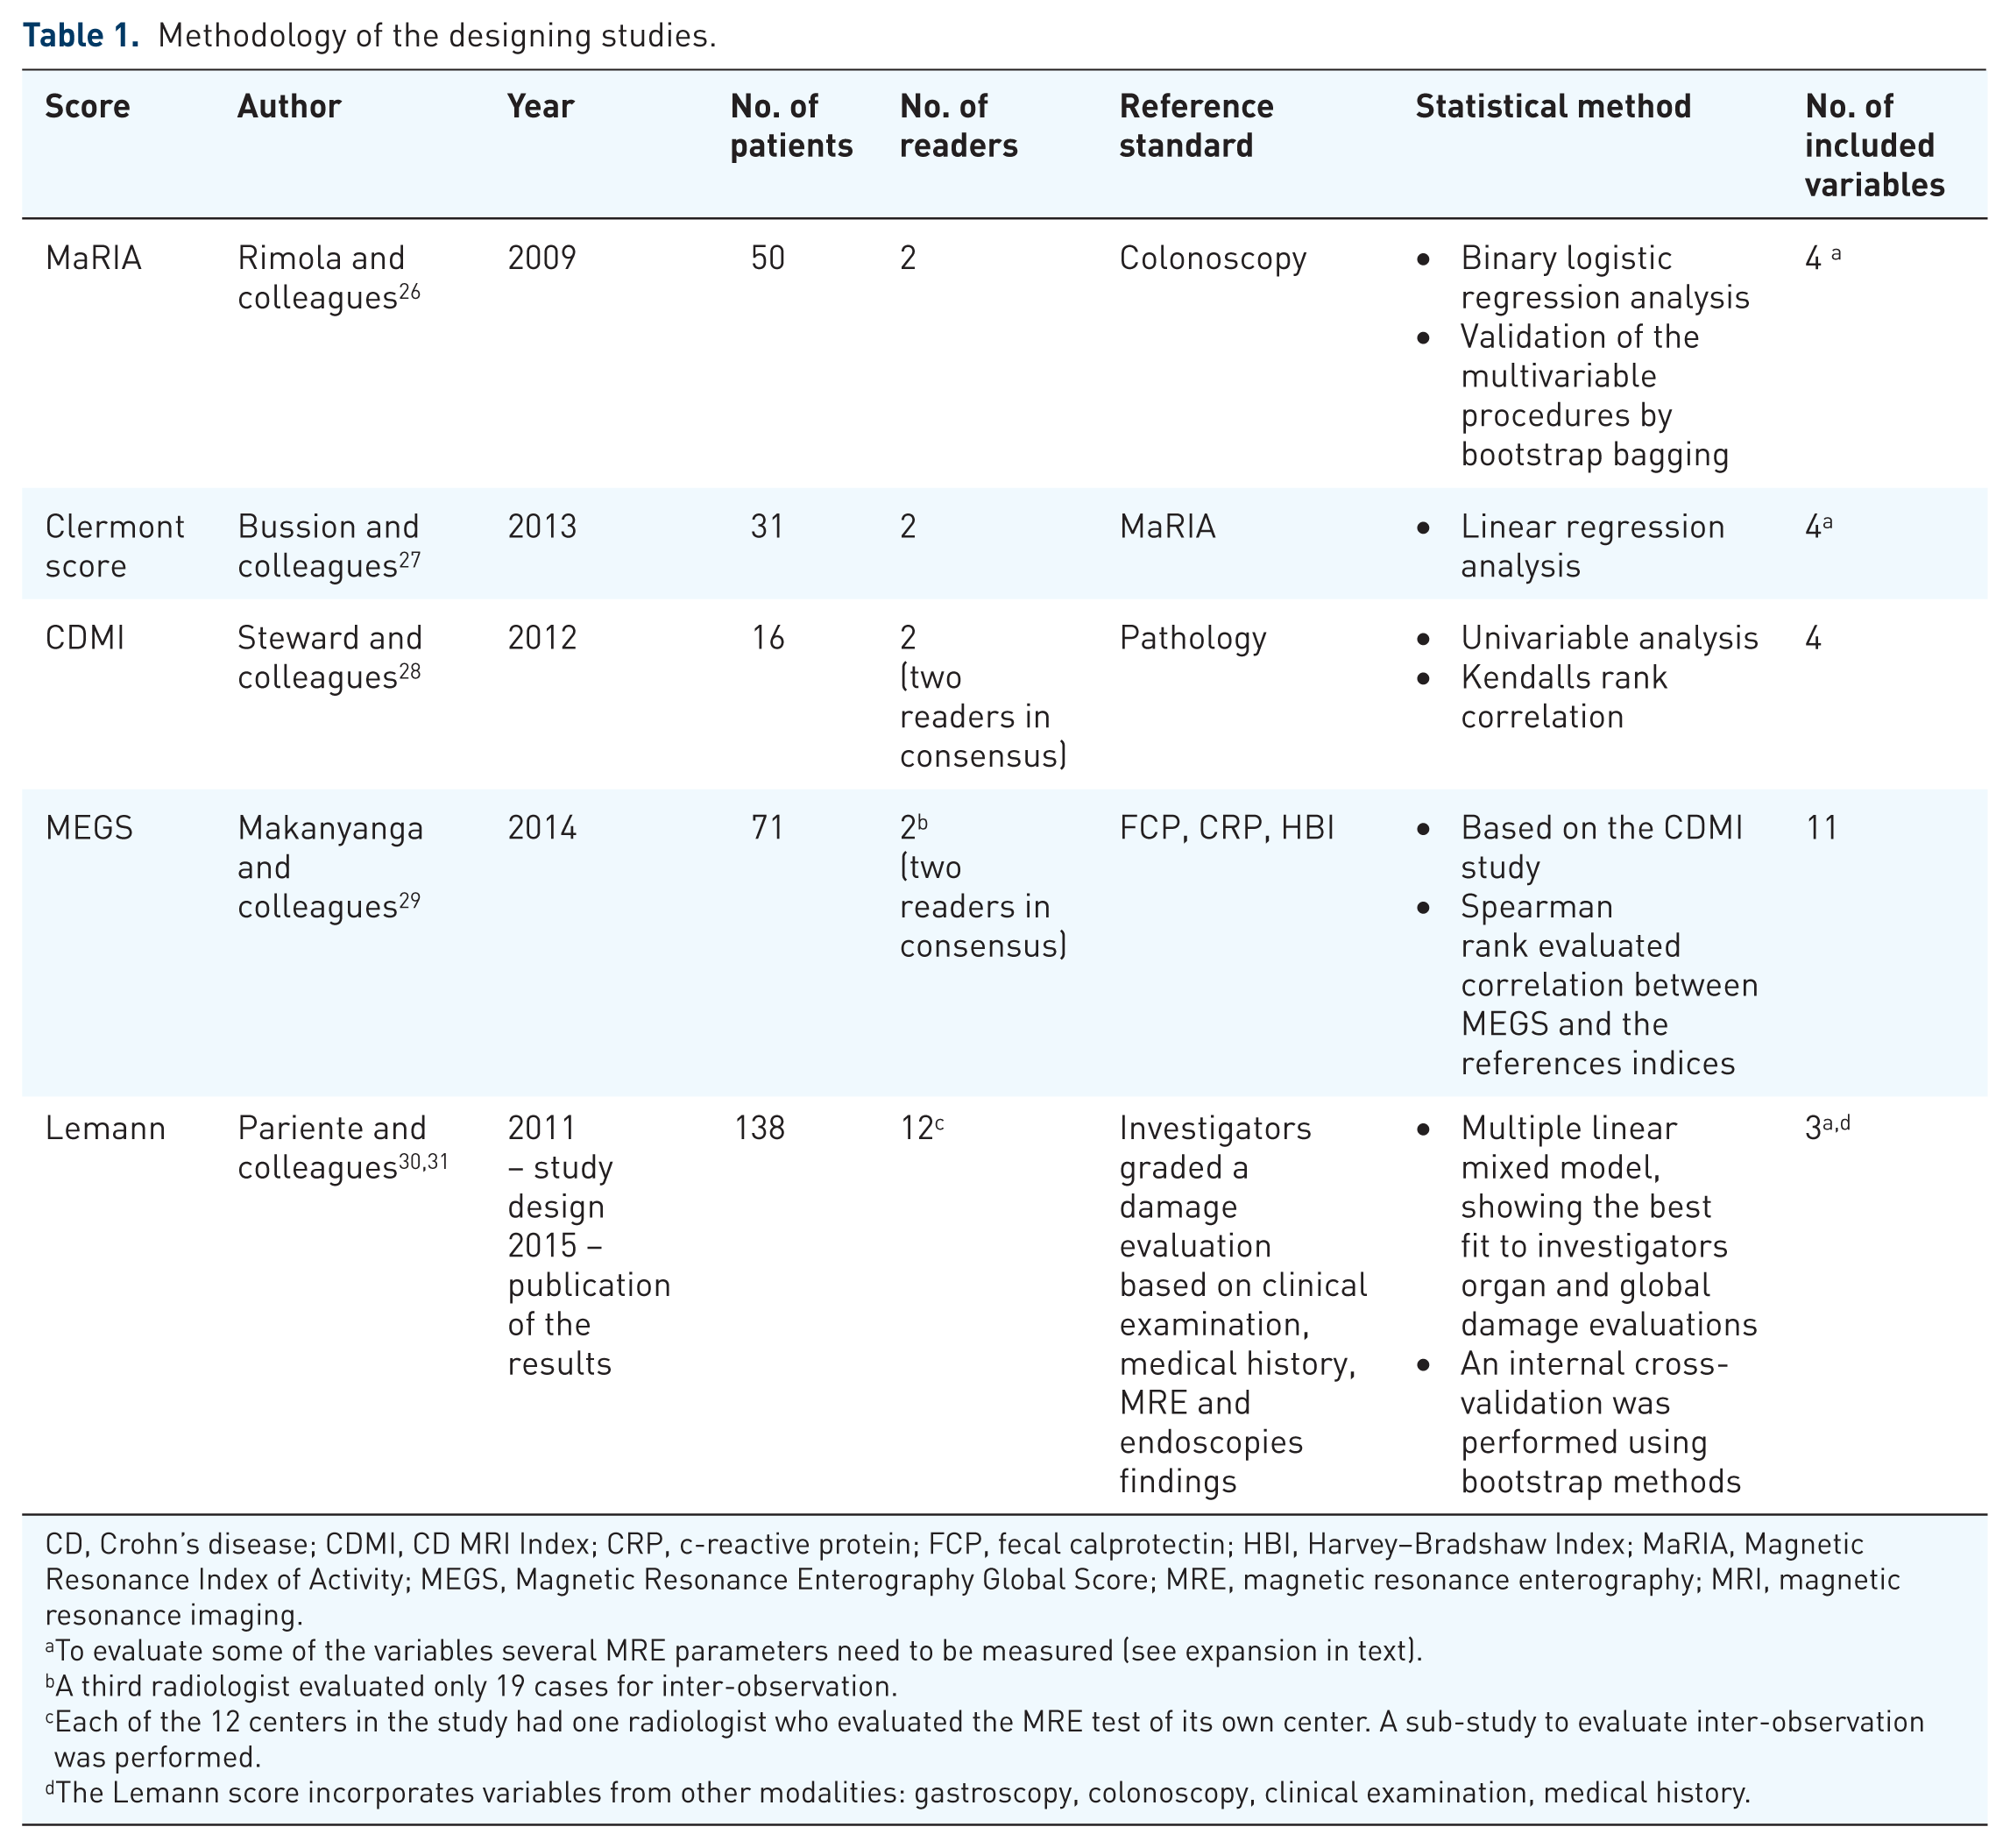
CD, Crohn’s disease; CDMI, CD MRI Index; CRP, c-reactive protein; FCP, fecal calprotectin; HBI, Harvey–Bradshaw Index; MaRIA, Magnetic Resonance Index of Activity; MEGS, Magnetic Resonance Enterography Global Score; MRE, magnetic resonance enterography; MRI, magnetic resonance imaging.
To evaluate some of the variables several MRE parameters need to be measured (see expansion in text).
A third radiologist evaluated only 19 cases for inter-observation.
Each of the 12 centers in the study had one radiologist who evaluated the MRE test of its own center. A sub-study to evaluate inter-observation was performed.
The Lemann score incorporates variables from other modalities: gastroscopy, colonoscopy, clinical examination, medical history.
Description of the MRE parameters included in the indices.
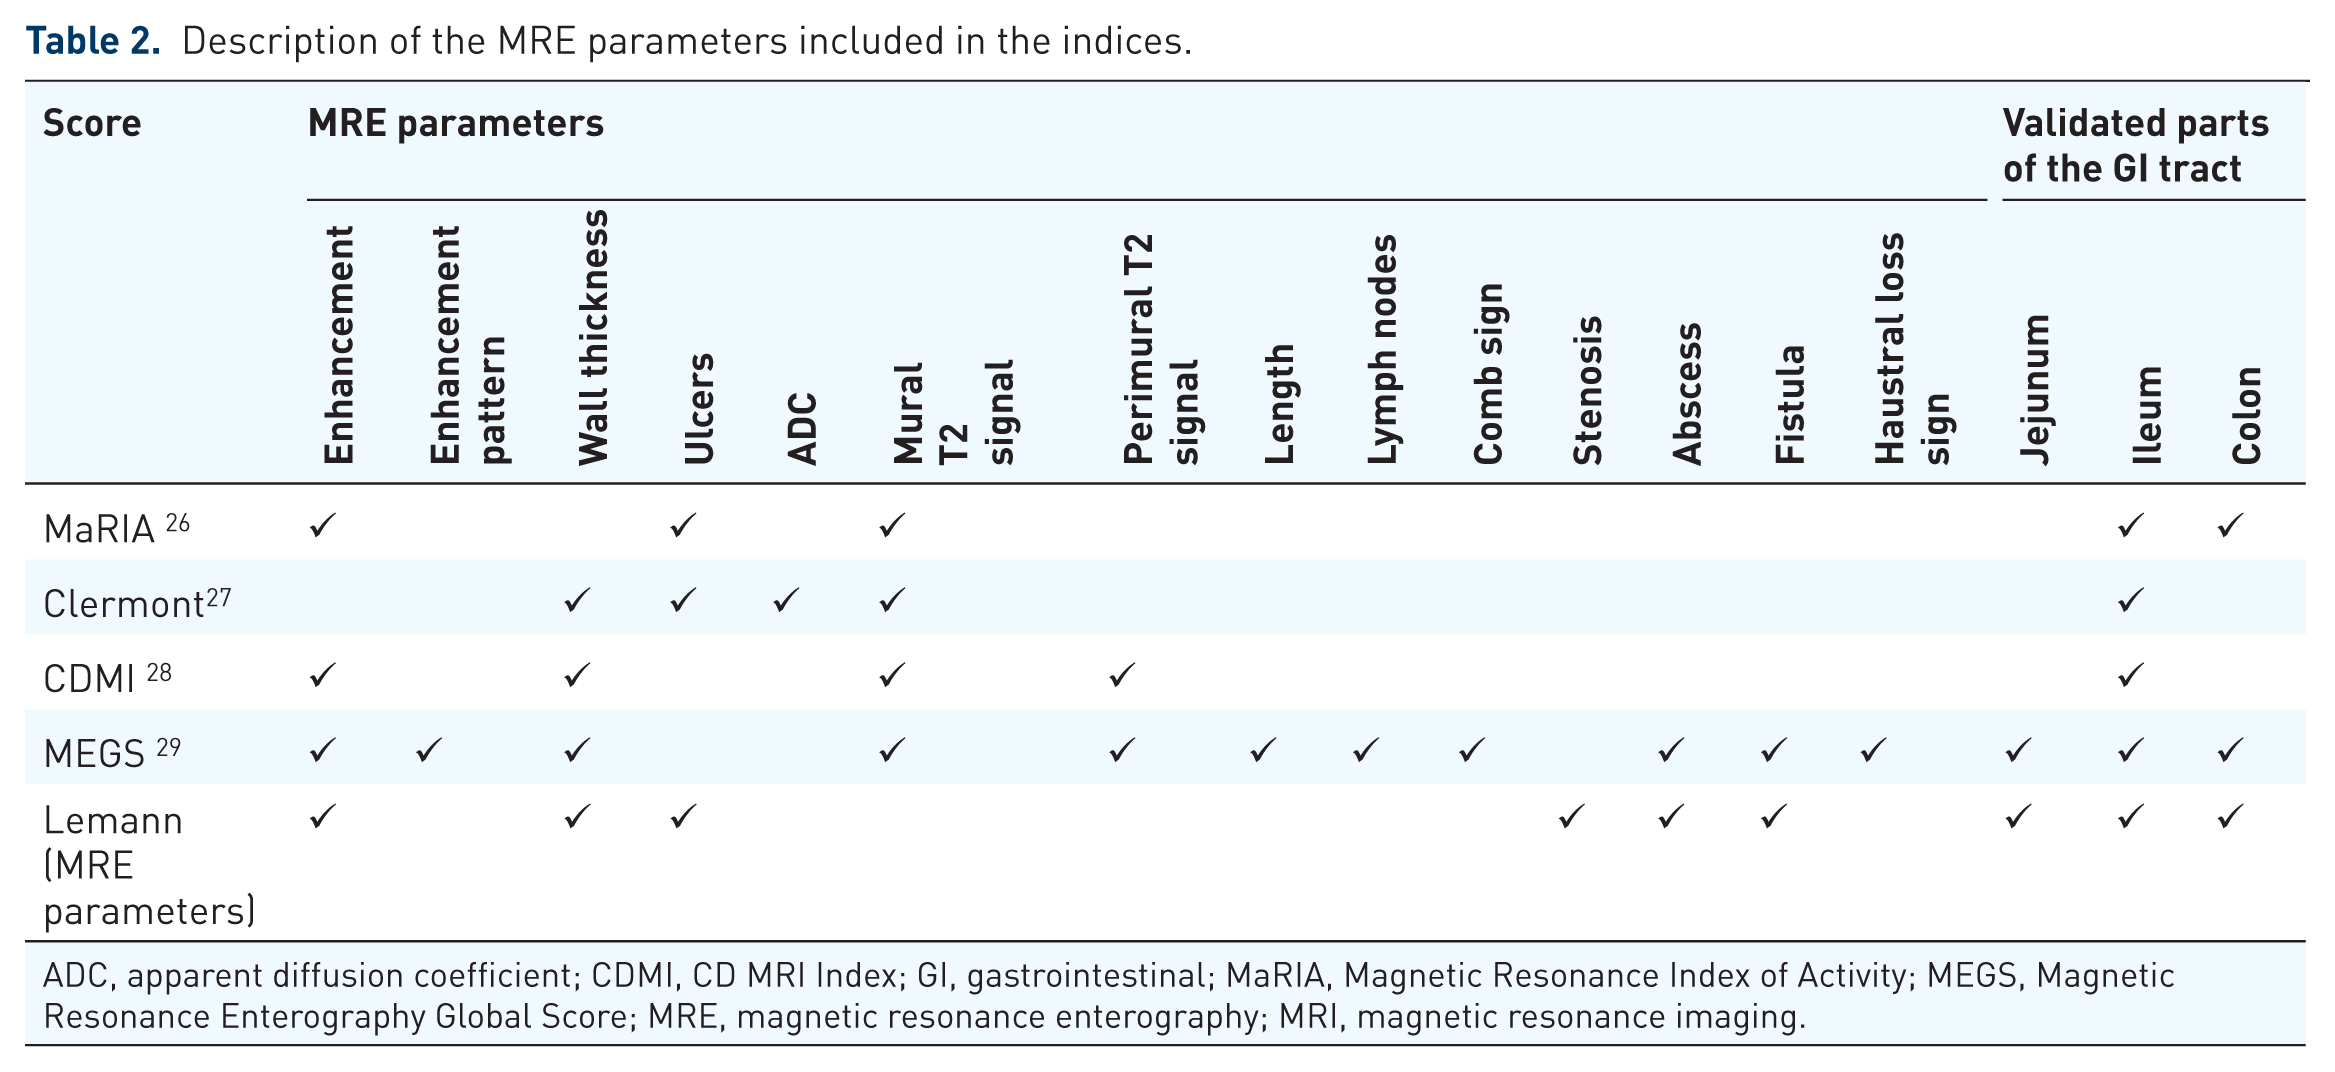
ADC, apparent diffusion coefficient; CDMI, CD MRI Index; GI, gastrointestinal; MaRIA, Magnetic Resonance Index of Activity; MEGS, Magnetic Resonance Enterography Global Score; MRE, magnetic resonance enterography; MRI, magnetic resonance imaging.
An Institutional Review Board approval was granted for presentation of the MRE images included in this review.
Magnetic resonance index of activity (MaRIA)
Rimola and colleagues 26 were the first to develop an MRE-based index for quantification of disease activity. Their reference standard was ileocolonoscopy and its derived CD endoscopic index of severity (CDEIS). They evaluated six bowel segments; the distal ileum, ascending, transverse, descending, sigmoid colon and rectum. Several MRE features were studied for each segment while the final score was based only on the features which were found to be independent predictors for endoscopic active disease; Bowel wall thickness (mm), ulcers, edema (defined as hyperintensity of the bowel wall relative to the signal of the psoas muscle on T2-wedged sequence), measurements of wall signal intensity (WSI) before and after intravenous (IV) contrast administration and relative contrast enhancement (RCE) of the intestinal wall. WSI is calculated by the average of three wall enhancement measurements. RCE is calculated by the following formula: RCE = [(WSI postgadolinium−WSI pregadolinium)/(WSI pregadolinium)] × 100 × [standard deviation (SD) noise pregadolinium/SD noise postgadolinium], where SD noise pre and postgadolinium is calculated by the average of three SDs of the signal intensity measured outside of the body before and after gadolinium injection, respectively. Figures 2–4 presents MRE features used in the MaRIA score.

MRE coronal T2-weighted image showing extensive wall thickening of the terminal ileum (black arrow). Wall thickness is a variable in all the five scores presented in this review. Mural T2 signal is an important part of CDMI and MEGS.

MRE axial T2-weighted image showing a terminal ileum (white arrow) with hyper signal relative to the psoas muscle (arrow heads). Wall edema is a variable in the MaRIA and Clermont scores.

Axial T1-weighted postgadolinium showing marked enhancement of a diseased terminal ileum (arrow). The MaRIA, CDMI and MEGS indices incorporate enhancement in their evaluation.
The simplified (= segmental) MaRIA score is represented by the following formula:

The simplified MaRIA score had a high (r = 0.81) and significant (p < 0.001) correlation with the CDEIS of the correspondent segment.
A global MaRIA score is calculated by adding the values of all six bowel segments. It showed significant correlation with CDEIS (r = 0.78, p < 0.001), Harvey–Bradshaw index (r = 0.56, p < 0.001) and c-reactive protein (CRP) (r = 0.53, p < 0.001).
In an external validation of their previous study, Rimola and colleagues 32 established cutoff points for disease severities (Table 3). Active disease was defined as endoscopic lesions of any severity and severe disease was defined as deep or superficial ulcerations at endoscopy. 32
Cutoff values of different MRE scores.

CDMI, CD MRI Index; MaRIA, Magnetic Resonance Index of Activity; MEGS, Magnetic Resonance Enterography Global Score; MRE, magnetic resonance enterography; MRI, magnetic resonance imaging.
Diffusion-weighted imaging (DWI) is an imaging technique which derives its signal contrast from the Brownian motion of water molecules. In the extracellular space, water molecules move relatively free while in the intracellular compartment their movement is restricted. Pathological processes change the proportion of the intra and extracellular water molecules and thus effect the tissue’s diffusion properties. The intensity of DWI allows qualitative assessment whereas generation of apparent diffusion coefficient (ADC) map from DWI acquisition allows quantitative measurements. 33 DWI was first used in neurology where patients with stroke demonstrated hyperintensity and low ADC values.34,35
Oto and colleagues 36 were the first to evaluate the role of DWI and ADC in detection of bowel inflammation and demonstrated that inflamed segments have an increased signal and lower ADC values. This observation was confirmed by other studies 37 and the use of DWI in CD continues to develop.38,39
With the increasing use of DWI in radiological evaluation of disease activity Kim and colleagues 40 proposed recently a modifying MRE index which replaces ulcers with DWI grading. They were able to demonstrate a similar correlation to CDEIS (r = 0.737 and 0.742, p = 0.387, respectively) and did not differ in the ability to diagnose active (0.909 and 0.903, p = 0.571) or severe (0.907 and 0.892, p = 0.443) inflammation. However, the intraclass correlation was significantly higher for the modified MaRIA than MaRIA (0.845 and 0.701, respectively, p < 0.001).
Clermont score
This is given as:

Buisson and colleagues 27 developed the first index which combines DWI and ADC measurements (Figure 5). The ileum was the only segment to be evaluated. By using the MaRIA score as a reference standard they developed the Clermont score, a DWI-based index for quantification of disease activity, which combined conventional MRE parameters derived by the MaRIA index.

ADC image showing restricted diffusion in the diseased terminal ileum (arrow). The Clermont is the only index which incorporates ADC measurements.
Calculation is performed by the following formula:
An external validation by the same group was later performed. 41 The Clermont score was found to be highly correlated with the MaRIA score (rho = 0.99) in ileal CD but not in colonic CD (rho < 0.8). A Clermont score >8.4 was found to be predictive of active ileal disease which was defined as MaRIA ⩾ 7 (receiver operating characteristic curve (ROC) of 0.99, p = 0.0001) and a score ⩾12.5 was found to be predictive of severe ileal disease (MaRIA ⩾ 11) (Table 3).
Crohn’s disease MRI index (CDMI) and MEGS
The MEGS is based on a previously proposed CDMI score 28 and was developed in order to better evaluate full disease burden. CDMI used pathology as a reference standard. Few specimens were taken from a surgically removed terminal ileum and were assigned an endoscopic biopsy acute inflammation score (AIS). Using a postoperative MRE of the resected segment, the specimen locations were allocated on an MRE performed prior to surgery. The MRE was evaluated according to the following parameters: mural thickness, mural T2 signal, perimural T2 signal, mural enhancement pattern, degree of enhancement, lymph nodes and lymph nodes enhancement. Only mural thickness and mural T2 signal showed correlation in a univariable, multivariable and backward selection and therefore were the only parameters included in the final formula:

The two additional parameters, contrast enhancement and perimural T2 signal, demonstrated only a univariable correlation to AIS. The simple sum of all four parameters slightly improved the correlation to endoscopic score in comparison with the proposed model and is the preferred method between the two.
Makanyanga and colleagues 29 used the same variables previously described in the basic index and in an attempt to better reflect the true extent of the disease suggested few modifications. The final MEGS score, divides the GI tract to nine segments and its full description and calculation is depicted in Table 4. The correlations between MEGS and the reference standards were: with fecal calprotectin (FCP): r = 0.46, p < 0.001; with CRP: r = 0.388, p = 0.002 and with the Harvey–Bradshaw index: r = 0.102, p = 0.4.
MEGS calculation.

MEGS, Magnetic Resonance Enterography Global Score; MRE, magnetic resonance enterography; MRI, magnetic resonance imaging.
Lemann index
The Lemann index differs from other indices by assessing structural damage rather than the extent of disease activity and mucosal inflammation.30,31 The Leman score is a bowel damage score not a bowel activity score. The GI tract is divided into four parts which are further divided into segments: upper tract (esophagus, stomach, duodenum), small bowel (each segment is 20 cm), colon (cecum, ascending/transverse/descending and sigmoid colon, rectum) and anus. Each of the segments is evaluated according to three parameters: surgical intervention, stricturing lesions and penetrating lesions which are being evaluated by either endoscopy, colonoscopy, computed tomography or MRI and are graded between 0–3 (Figure 6). All of the data are entered into a Microsoft Excel-based calculator provided by the LI score study group. Table 5 describes the Lemann index.

MRE coronal T1-weighted post gadolinium image. Extensive disease is shown in the distal and terminal ileum, with a bowel conglomerate, numerous fistulas and phlegmon, with the appearance of the ‘star sign’ (arrows). Also showing is the mesenteric lymphadenopathy (arrow head). Both the MEGS and the Lemann indices incorporate extra-intestinal features.
Lemann index a .

Data are entered into a Microsoft Excel-based calculator provided by the LI score study group.
CT, computed tomography; MRI, magnetic resonance imaging.
The Lemann index significantly increased with disease durations of <2 years, ⩾2 years and <10 years and ⩾10 years corresponding to Lemann index values of 6.3, 14.3 and 19.0, respectively (p < 0.001). The Lemann index was not influenced by the Crohn’s disease Activity Index (CDAI) when taking into account disease duration which emphasizes its significant as indicator of long term damage which is not affected by acute flares.
Validation of the indices
Revalidation of the indices was performed by the studies presented in Table 6. The validating studies have shown variable results for the ability of the indices to detect active disease. However, there is a great inconsistency between the validating studies methods, gold standards and evaluated bowel segment which makes it difficult to draw any conclusion regarding the capacity of these indices to reflect disease activity.
Validation of MRE indices.
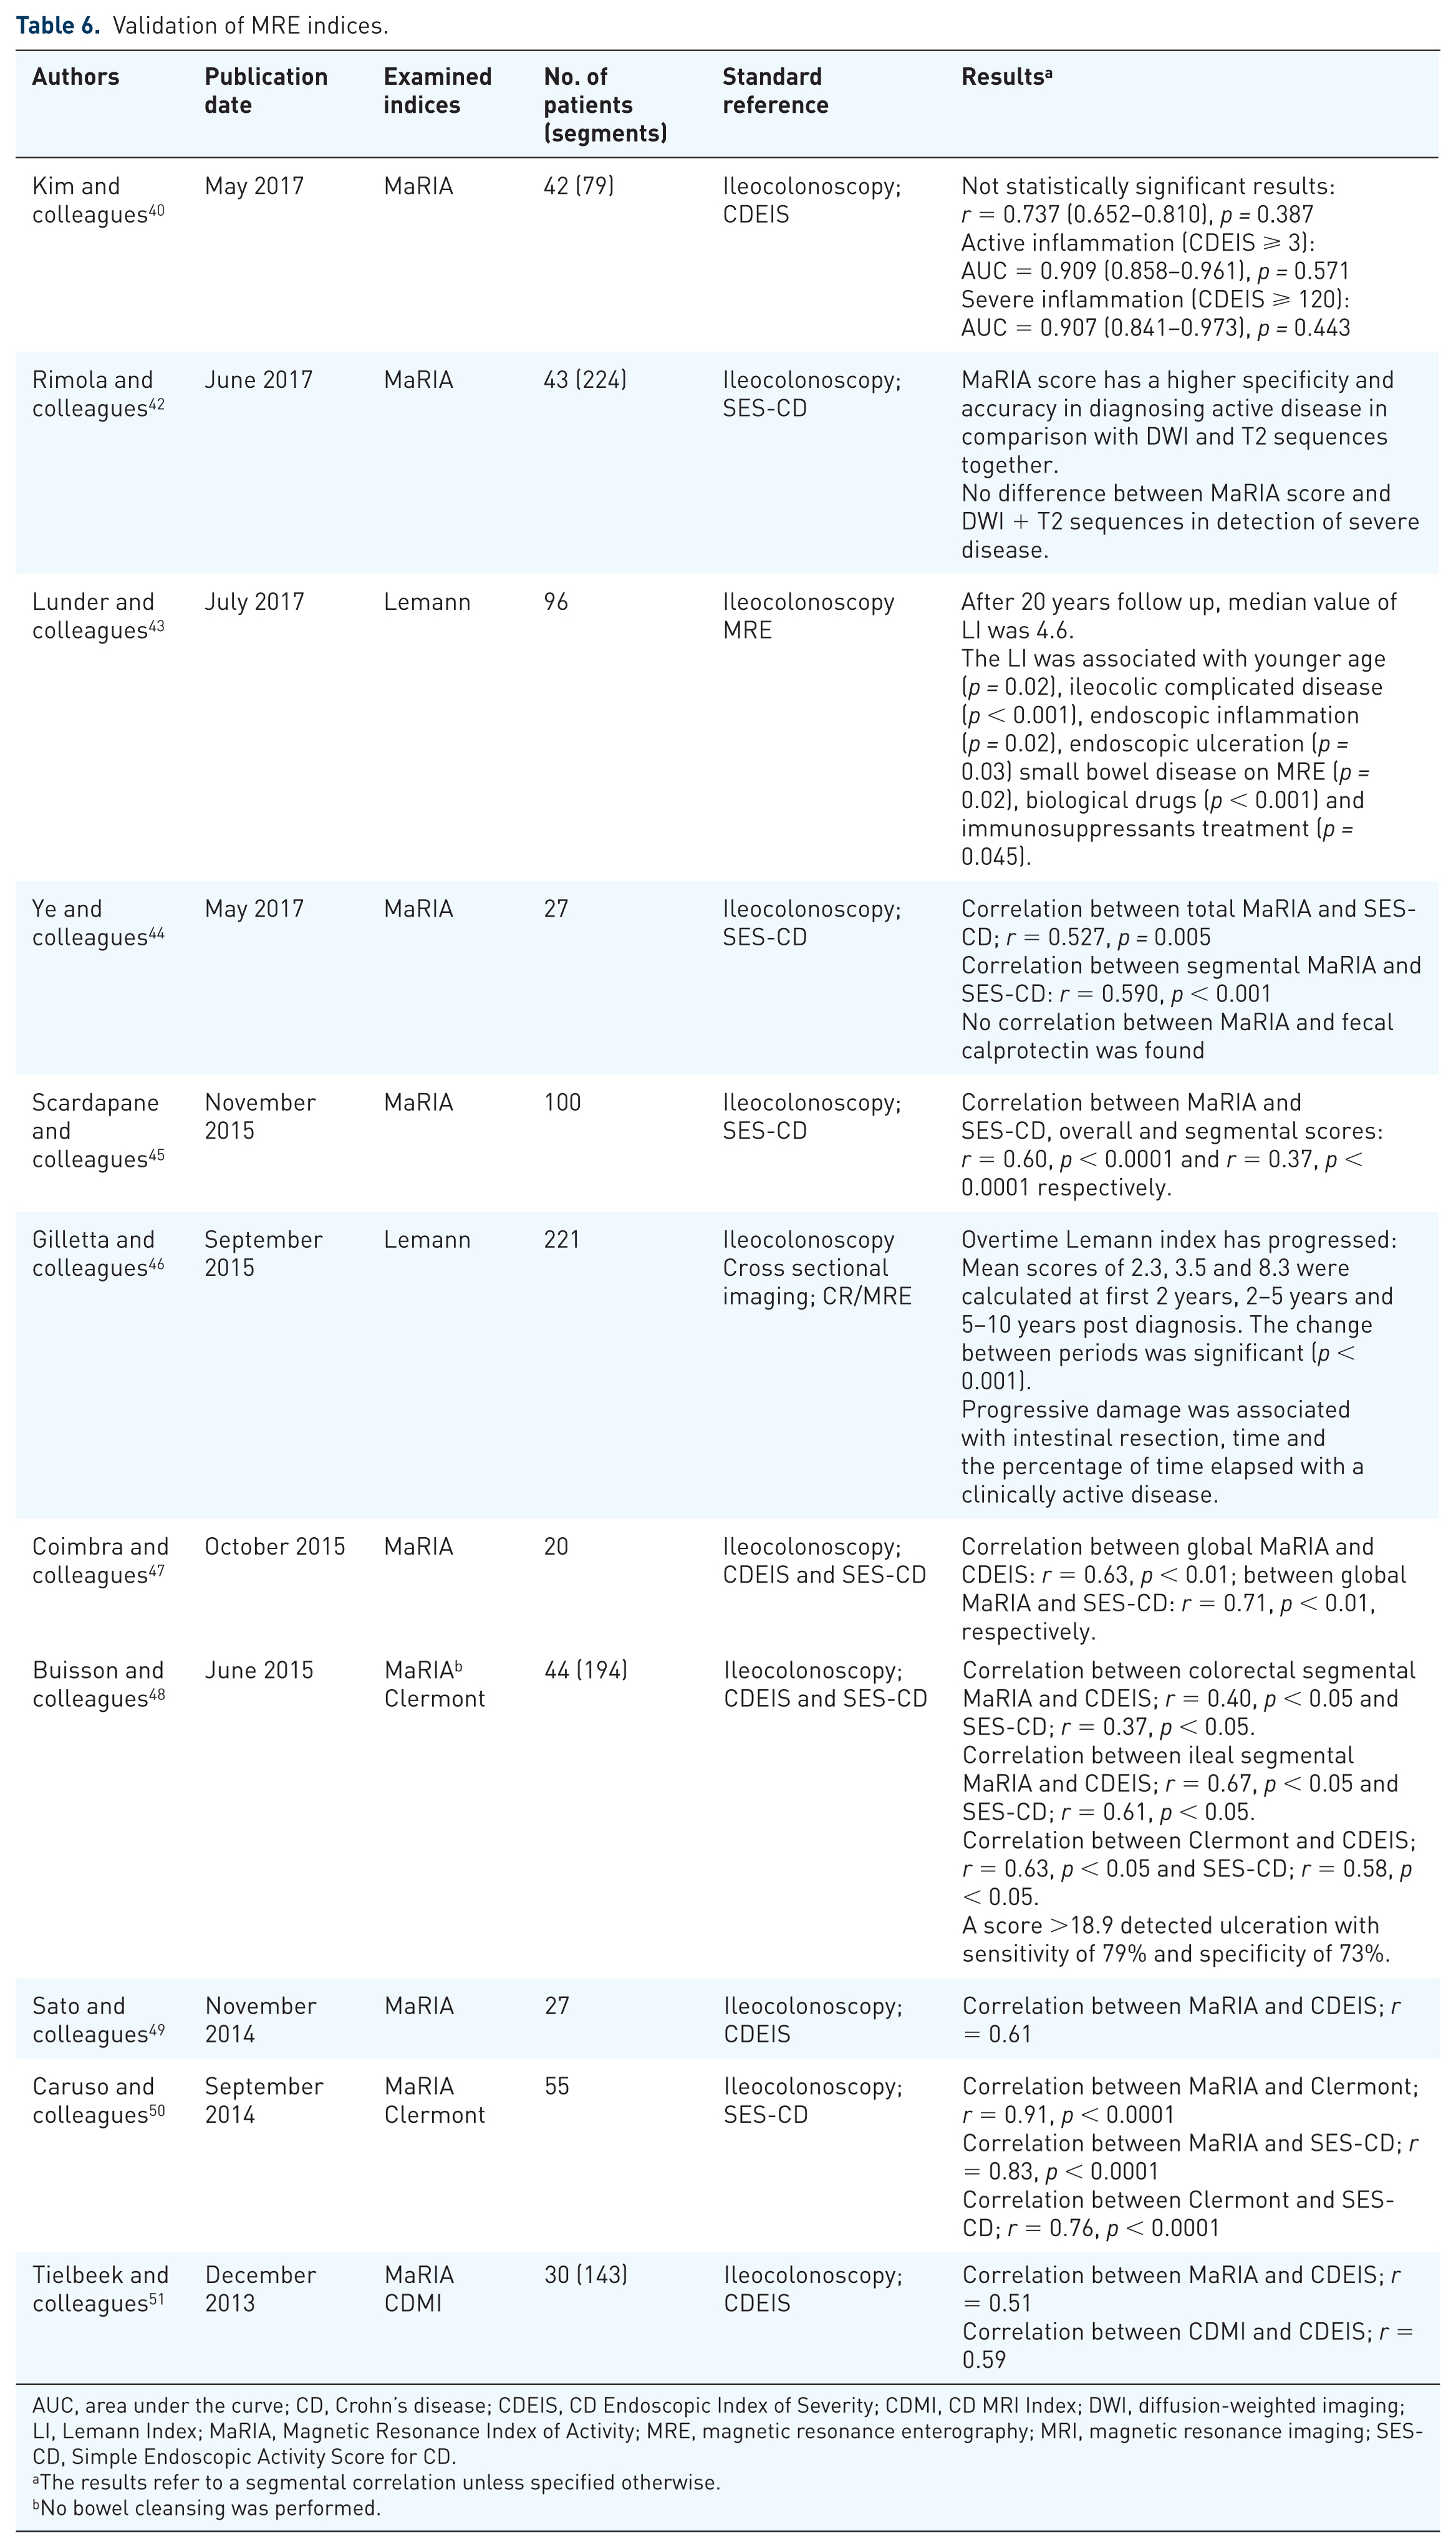
AUC, area under the curve; CD, Crohn’s disease; CDEIS, CD Endoscopic Index of Severity; CDMI, CD MRI Index; DWI, diffusion-weighted imaging; LI, Lemann Index; MaRIA, Magnetic Resonance Index of Activity; MRE, magnetic resonance enterography; MRI, magnetic resonance imaging; SES-CD, Simple Endoscopic Activity Score for CD.
The results refer to a segmental correlation unless specified otherwise.
No bowel cleansing was performed.
Interobserver studies
Evaluating the score’s precision is crucial prior to its implantation in clinical practice. The results of the score must be repeatable in order to be used as a reliable clinical tool. Tielbeek and colleagues 51 were the first to address this issue as they examined the reproducibility of the MaRIA and CDMI scores. Their evaluation included four readers with different clinical experience and demonstrated a good interobserver variability of both indices (intraclass correlations (ICC) = 0.74 and ICC = 0.78, respectively). Rimola and colleagues 52 found a substantial interobserver variability of both MaRIA and Clermont (ICC = 0.7 and ICC = 0.65, respectively). Similar results for the MaRIA score were obtained by Kim and colleagues. 40
Studies that compared indices
Tielbeek and colleagues 51 examined MaRIA and CDMI for their interobserver variability and correlation to ileocolonoscopy (CDEIS). Similar results were obtained between the indices; from the results of four experienced radiologists, a good interobserver agreement was attained (0.74 for MaRIA and 0.7 for CDMI) and both indices showed moderate correlation to CDEIS (r = 0.51 for MaRIA and r = 0.59 for CDMI, respectively). It is worth noting that although MaRIA was initially validated against CDEIS and CDMI against the histopathology score they still performed equally in this study.
Caruso and colleagues 50 compared the diagnostic accuracies of MaRIA and Clermont for detecting active ileal disease and found similar correlation of the two indices to endoscopy.
A similar comparison was later made by Rimola and colleagues 52 who obtained similar results. Both indices demonstrated high sensitivities for active disease were similar while the specificity of MaRIA was superior to Clermont (97% and 78.2%, respectively).
Studies performed in children do not rely on endoscopy as a reference standard due to its invasiveness. Instead, the pediatric CD activity index (PCDAI), which includes the patient’s history, findings in physical examination and laboratory values is used. Pomerri and colleagues 53 were the first to investigate the accuracy of these indices in the young population of patients. The global MaRIA and MEGS revealed a weak-to-moderate correlation to the PCDAI (r = 0.42, p = 0.016 and r = 0.46, p = 0.007, respectively).
Clinical implications of MRE indices
Response to therapy and mucosal healing
Response to therapy is an important element of patient monitoring and decision making. The primary goal is to achieve mucosal healing; however, it is a demanding task considering the repeated endoscopies it requires. MRE plays a significant role in CD management but its ability to monitor treatment responsiveness is yet to be determined. Table 7 demonstrates the studies which tried to elucidate this point.
MRE as a tool for assessment of treatment responsiveness.

AUC, area under the curve; CD, Crohn’s disease; CDEIS, CD Endoscopic Index of Severity; MaRIA, Magnetic Resonance Index of Activity; MEGS, Magnetic Resonance Enterography Global Score; MH, mucosal healing; MRE, magnetic resonance enterography; SES-CD, Simple Endoscopic Score for Crohn’s disease.
Ordas and colleagues 57 examined the ability of MaRIA to identify ulcer healing following treatment and the accuracy of MaRIA to assess mucosal healing (CDEIS < 3.5). The diagnostic accuracy of MaRIA to predict ulcer healing (MaRIA < 11) was 90% and to predict mucosal healing (MaRIA < 7) was 83%. The MaRIA score demonstrated high responsiveness for therapy-induced changes and proves to be a reliable tool to assess response to therapy. Similarly, Stoppino and colleagues 55 also evaluated the responsiveness of MaRIA to treatment with anti-tumor necrosis factor (TNF) and its correlation to endoscopic appearance. They found a significant change in the MaRIA value before and after treatment and a significant correlation with the simple endoscopic activity score for CD (SES-CD).
Prezzi and colleagues 56 characterized the response of MEGS to anti-TNFα therapy, however, they used clinical disease activity as a reference standard which does not truly reflect disease activity. MEGS significantly changed in clinically responders to therapy but not in nonresponders and a moderate correlation was observed with clinical activity.
Another aspect of response to therapy was investigated by Tielbeek and colleagues 58 who assessed the ability of MRE to reflect changes of anti-TNF on transmural inflammation and stenotic lesions. It their study, CDMI was able to reflect responsiveness on both aspects, since a significant improvement in score was observed in the responding segments but not in the nonresponding segments (transmural inflammation: 5.19 to 3.12, p < 0.0001 versus 5.55 to 5.92, p = 0.49; stenotic segments: 6.33 to 4.58, p = 0.01 versus 6.61 to 6.72, p = 0.79).
Moy and colleagues 59 reassured previous results, however, their study differ in design and goals and did not assess MRE response to therapy but rather the ability to detect mucosal healing. Ye and colleagues 44 determined a cutoff value of 6.8 for detection of mucosal healing [area under the curve (AUC) 0.881, sensitivity 100%, specificity 79.2%] however they used a different value of SES-CD for mucosal healing as a standard reference.
Buisson and colleagues 60 have recently compared the ability of MaRIA and Clermont to detect mucosal ulceration and predict mucosal healing using endoscopy as a reference standard. Both indices were equally effective in detecting endoscopic ulceration with specificity (82.1% and 81.3%, respectively) and substantially negative predicting value (82.1% and 82.4%, respectively) while the sensitivity and positive predicting value were moderate
An emerging clinical concept these days is transmural healing, which refers to normalization of both radiologic scans and endoscopy examinations.7,61 Its rate, effect on disease course and methods for evaluation are being assessed and the role of MRE-based indices is still unknown.
MRE indices as prognostic tools
Biological therapy with anti-TNF antibodies is widely used for inducing and maintaining remission. Some patients develop resistance to therapy after initial response and clinical remission and it is necessary to evaluate the extent of disease for planning treatment strategy. Naganuma and colleagues 62 studied a cohort of 50 patients who have finished therapy with anti-TNF drugs and during a period of up to 3 years observed for clinical flares. They aimed to discover whether MRE can predict prognosis of patients with an initial clinical remission.
Total and segmental MaRIA score were significantly higher in the group who experienced disease flares than in the group who maintained remission (47.6 ± 14.3 versus 33.2 ± 8.7, p = 0.003; 19.8 ± 8.9 versus 12.1 ± 6.9, p = 0.02, respectively). A value of 36.3 of total MaRIA score was set to predict recurrence among patients with clinical remission (sensitivity 75%, specificity of 70%, AUC 0.79%, p = 0.009). Patients with an initial score <36.3 had a significantly longer period of remission in comparison with patients with score ⩾36.3 [29.8 months, 95% confidence interval (CI) 23.7–35.9 versus 13.9 months, 95% CI 7.7–20.1, Log-rank test p = 0.01, Breslow test p = 0.009].
The MaRIA score was not found to be correlated with an increased risk to abdominal resection surgery in a study conducted by Amezaga and colleagues. 63 Both groups of patients, the group who did not need surgery and the one who did, demonstrated similar scores (65 and 62, respectively, p = 0.6). The significant of this observation is that the severity of a particular flare, measured by a validated MRI index, is not a predictor of the need for abdominal surgical resection.
Evaluation of bowel damage in CD
Fiorino and colleagues 64 investigated the effect of anti-TNF therapy on bowel damage and the sensitivity of the Lemann index to assess such changes. A cutoff value of 4.8 was proposed as discriminating for bowel damage (AUC 0.81, sensitivity 76%, specificity 0.89%) and a change of +0.3 was indicative for bowel damage progression (AUC 0.98, sensitivity100% and specificity 96%). During 12 months of follow up, the majority of patients (83%) had bowel damage regression and anti-TNF therapy significantly reduced LI (p = 0.007). Progression of bowel damage was unrelated to either clinical or endoscopic activity. Patient with bowel progression were more likely to undergo a major surgery within the next 12 months [hazard ratio (HR) 0.19, p = 0.005].
A different study by the same group 65 evaluated the prognostic values of the Lemann index and MaRIA score in newly diagnosed patients. The Leman index was found to be a prognostic factor for intestinal surgery (HR: 1.11, p < 0.0001) and of CD-related hospitalization (HR: 1.08, p < 0.001) while the MaRIA score did not predict the course of the disease.
When examining a subgroup of quiescent and stable CD patients Amitai and colleagues 66 demonstrated no significant change in bowel damage over time. They found neither endoscopic activity nor inflammatory biomarkers (CRP or fecal protection) to be correlated with damage progression. In contrast to their results Bhattacharya and colleagues 67 found CRP to correlate to damage progression in quiescent CD.
Bodini and colleagues 68 studied the efficacy of several treatment modalities in preventing bowel damage progression as assessed by Lemann index. They found anti-TNF to be superior to that of azathioprine and mesalazine as it was able to maintain a stable LI.
Capsule endoscopy
Capsule endoscopy overcomes few of the major disadvantages of standard ileocolonoscopy and allows visualization of the small bowel in a noninvasive method. It is now considered a standard tool in the evaluation of CD patients69–71 and its correlation with MRE parameters indicating active inflammation was previously demonstrated.39,72–74
Kopylov and colleagues 75 examined the relationship between the Lewis score, a capsule endoscopy-based index, MaRIA and Clermont in the distal small bowel. Both MaRIA and Clermont were significantly correlated with Lewis score (r = 0.50, p = 0.001 and r = 0.53, p = 0.001, respectively), and the AUC of both scores was moderate for prediction of mucosal inflammation in general (Lewis score > 135) and excellent for prediction of moderate-to-severe inflammation (Lewis score > 790; 0.71 and 0.74 versus 0.93 and 0.91 for MaRIA and Clermont, respectively). In another study by the same group the MEGS score was validated against the Lewis score (r = 0.61). 76
DWI and ADC performance
Both Pendse and colleagues 77 and Huh and colleagues 78 examined the use of DWI qualitative assessment and ADC quantification measurements as part of patient follow up.
The Pendse and colleagues study 77 demonstrated conflicting results; ADC demonstrated moderate correlation with MEGS but was not different between groups with active and inactive disease (defined by MEGS > 10 and another time by histology). However, MEGS score and FCP were different between groups with and without DWI restriction and abnormal DWI showed high sensitivity and specificity for detecting biochemically active disease (calprotectin > 120 µg/l). They offered the use of DWI for first and overall estimation of the disease and did not recommend the use of ADC. When DWI was different results were obtained by Huh and colleagues 78 who demonstrated that DWI and ADC can help in assessment of response to therapy.
Implementation of MRE-based indices as reference standards
FCP is a noninvasive marker of intestinal inflammation and its correlation with endoscopy and ability to response to therapy has been proven.79,80 Cerrillo and colleagues 81 studied FCP association with radiological activity as reflected by the MaRIA score and found a moderate correlation (r = 0.56, p < 0.001). He suggested FCP value of 166.50 as cutoff for predicting active disease (MaRIA > 7; AUC = 0.914, sensitivity 90.48%, specificity 74.29%). This finding could help when deciding which patient deserves further evaluation.
Takenaka and colleagues 82 have sought to determine the applicability of MaRIA score and SES-CD, which were both initially developed and validated for the terminal ileum and colon only, in the deep small intestine. A low correlation was demonstrated between MaRIA, CDAI and CRP (r = 0.221, p = 0.015; r = 0.371, p < 0.001, respectively). Interestingly, the MaRIA score highly correlated with SES-CD in segmental and total calculations (r = 725, p < 0.001; r = 8.808, p < 0.001, respectively).
Strengths and weaknesses of the reviewed indices
Figures 1–5 present MRE features which are incorporated in the indices reviewed in this article.
Each of the models reviewed in this article entails some advantages over the others and at the same time carries some drawbacks which make it less favorable. Validating studies have shown inconsistences regarding the accuracies of each models, and there is much room for further research expanding current data. Getting familiar with the pros and cons of the current models is important for proper use in clinical practice and for devising new indices.
Table 8 elaborates the strengths and weakness for each index.
Strength and weaknesses of the indices.

CDMI, Crohn’s disease MRI Index; CT, computed tomography; GI, gastrointestinal; MaRIA, Magnetic Resonance Index of Activity; MEGS, Magnetic Resonance Enterography Global Score; MRE, magnetic resonance enterography.
The MaRIA is the most studied index and offers an extensive data of its performance against different investigating modalities (clinical scores, pathology, conventional endoscopy, video capsule endoscopy, inflammatory biomarkers). Therefore, it may be considered for use as a reference index these days.
The Clermont score incorporates the DWI technique which has been well integrated into many radiological fields and showed a very strong correlation to MaRIA (r = 0.99). A limitation of the Clermont score is that it is the only one of the five scores without truly independent validation with another modality. It contains many similar items to the MaRIA score so it is not surprising the two scores correlate well. It can be used when there is a decision not to inject contrast material and we believe it will gain more popularity with the increasing use of DWI in CD imaging. The CDMI is an index that has not been studied much but offers a relatively simple method of calculation, with few investigated variables, and should therefore be considered when saving time is of interest.
The MEGS lacks pathological validation but on the other hand is correlated with clinical score of disease activity, stool and blood markers. It has the advantages of evaluating the entire small bowel and incorporating extra-intestinal findings and should be used as a tool for evaluating the extent of the disease. Of note is that the MEGS score is complicated to obtain, due to its large number of variables (see Table 3).
The Lemann index is specifically targeted for measuring cumulative damage of the intestine and requires the use of a number of modalities other than MRE, which can limit its application.
Distinguishing inflammatory from fibrotic lesions is important in patients’ management as it has an impact on treatment choice. 83 None of the current indices was evaluated in this aspect and further studies are required to examine if they are able to make this separation or whether new indices are required.
Table 1 presents the study methodology of the five scores that are discussed in this review. In the era of quantitative medicine, future scores may benefit from a larger cohort of patients that will reflect the variability of CD and strength the statistical significance of the multivariate regression analysis.
Conclusion
The observation that patients with endoscopically severe inflammation may still be asymptomatic led to shift in the treatment goal of CD from achieving clinical remission to achieving mucosal healing. 84 This change of treatment paradigm requires a more comprehensive evaluation and higher frequency of testing and thus new tools were introduced into clinical practice in order to better manage CD patients. 85
MRE gained great popularity over the years and is considered one of the gold standards for the diagnosis and follow up of CD. 86 In this review we present and analyze the leading MRE indices from the last 10 years, compare the different indices and evaluate clinical research that utilized them. The aim of this review is to provide a reference guide for researchers and clinicians who incorporate MRE indices in their work. When devising future indices, accumulated data from the existing indices must be taken into account, as each of the current indices has its own strengths and weakness.