
Abstract
The understanding of association football head collision mechanics is of interest in the context of increased neurodegenerative disease risk in ex-professional players. This study sought to measure and characterise micromechanical pressure wave propagation from football head collisions; a distinct energy transfer mechanism from, and occurring before the start of, macromechanical gross head kinematics. A surrogate head setup, instrumented with a hydrophone pressure sensor, was exposed to footballs travelling at match realistic velocities. Pressure waves emanating from the region of first contact were measured within the cranial cavity. Their mean peak-to-peak magnitudes were up to 31.0 kPa. Across a range of 20 footballs of different materials, constructions and assembly methods, all of which satisfied the Laws of the Game, a 9.1-fold difference in peak-to-peak pressure and 54.7-fold difference in energy transfer, was observed. A 5-fold increase in peak-to-peak pressure was observed for a 77% increase in ball inbound velocity. Hydrophilic leather ball types demonstrated up to 4.2-fold greater peak-to-peak pressures when tested in wet, compared to dry conditions. These data highlight that pressure wave energy transfer may be influenced by the materials and construction of the ball, with scope to affect this without requiring alteration to the game or its Laws. The influence of these pressure waves on acute and long-term brain health requires further exploration.
Introduction
Association football is the most popular sport globally, played by over 260 million players 1 and followed by an estimated 3.5 billion fans. 2 Whilst playing football offers significant cognitive and physiological health benefits, recent epidemiological studies have highlighted an elevated risk of neurodegenerative disease development and mortality in later life among former professional footballers.3–8 Repetitive ball-to-head collisions are widely assumed to contribute to this elevated risk.
The mechanics of head impacts have been extensively studied, enabling the characterisation of collision phenomena which associate with acute symptomatic brain injuries such as skull fracture and concussion. However, the mechanisms that link football heading to long-term neurodegenerative outcomes remain poorly understood, largely due to the absence of immediate or observable symptoms. Studies involving human participants,9–19 laboratory impact recreations,11,20–28 and computational models29–33 have been conducted to quantify or predict head kinematics and impact forces associated with football heading. These investigations have largely focussed on macromechanical responses, treating the head and ball as discrete bodies and analysing their relative motions, deformations and strain distributions under impact. While informative, such approaches do not generally capture the micromechanical dynamics, including local stress oscillations, wave propagation and higher-order tissue responses that occur on a spatial scale relative to brain microstructures such as those within the neurovascular unit. These phenomena may be critical for understanding subtle or subclinical brain injury mechanisms.
Collisions between solids induce rapid localised mechanical disturbances at the point of contact.34,35 These disturbances generate pressure waves that propagate through the surrounding media, transferring energy and exerting mechanical stresses on structures within the impacted field.34,36–38 Pressure waves are an established cause of acute and long-term degenerative brain injury in blast-exposed military personnel, in severe and repetitive low-level contexts, respectively.39–48 Through computational modelling, Perkins et al. 32 suggested that pressure waves could arise from football head collisions, but these have not been further explored or studied experimentally. 32 Detailed analysis of force and contact area through a football head collision revealed peak contact pressure within the first 10% of contact time. 49 Moreover, impact neurotrauma studies indicate that potentially damaging strain magnitudes in the brain develop prior to the onset of gross head kinematics.32,50,51 Football head collisions have been associated with acute non-concussive changes to the brain, including altered cerebrovascular reactivity and cortical control processes.52,53 This study sought to experimentally test the hypothesis that football head collisions generate measurable intracranial pressure waves and to characterise their properties.
Pressure waves are commonly studied using laboratory re-enactments with human surrogate skulls filled with homogenous gel, which mimics the acoustic transmission characteristics of cerebrospinal fluid and brain tissue. Because the timescales over which pressure waves propagate within the dimensions of the head are orders of magnitude shorter than those associated with gross head kinematics, any acoustic signal is independent of, and fully captured prior to, any head displacement. Consequently, biomechanical fidelity is primarily required for the geometry and material properties of the surrogate skull, rather than for head or neck motion. Surrogates designed for this purpose are not required to mimic the inertial response of the head and are therefore typically rigidly mounted and may be sectioned (e.g. half-skull setups) for ease of sensor placement. Hydrophones or similar piezoelectric pressure sensors are positioned within the propagation field to measure the energy transmitted from the impact stimuli.32,50,51,54–58
Considerable work has focussed on developing biofidelic skull surrogates for sport and related applications. Studies by Stone et al.,
59
England and Falland-Chueng et al.60,61 have validated the mechanical properties of additively manufactured thermoplastic polymers, most commonly acrylonitrile butadiene styrene (ABS), as representative of cranial bone.
62
These validations encompass flexural and tensile moduli, flexural and tensile strengths and density, making it an appropriate mechanical analogue. The longitudinal speed of sound in cranial bone (2200–2600 m/s63,64) is comparable to that of additively manufactured ABS (2121–2770 m/s
65
). As the brain and cerebrospinal fluid are predominantly water-based (acoustic impedance ≈ 1.5 ×
The magnitude and characteristics of pressure waves generated during impact are determined by the mass, velocity and material properties of the colliding bodies.37,66–69 In football, the Laws of the Game issued by the International Football Association Board (IFAB) specify the ball’s allowable mass at the start of play but do not define its materials or mechanical properties. 70 Historically, footballs were constructed from uncoated, hand-stitched leather panels, whereas modern designs utilise synthetic stitchless laminate constructions.71–75 Ball velocity at the moment of head impact varies widely depending on the scenario, ranging from 5 m/s for throw-ins and close interplay up to ~30 m/s for shots and clearances.23,74,76 Ball mass can change during play as a result of water exposure with different ball types exhibiting distinct mechanisms and magnitudes of water uptake. 71
This study aimed to experimentally examine pressure wave propagation from football head collisions. It did not seek to determine the effect of pressure waves on the brain, nor draw any conclusions regarding brain health. Given the range of ball designs used through the history of the game it was necessary to include a variety of ball types within the experimental programme. The specific research questions were as follows.
Methods
This study projected footballs, at game realistic velocities, against an instrumented human head surrogate to measure and characterise resultant pressure wave propagation within the cranial cavity.
Experimental apparatus and method
A bespoke pneumatic actuator (Red Streak Series STIWS) projected the ball 2.10 m in a horizontal plane to impact the surrogate skull. Inbound velocity was controlled by actuator pressure and measured prior to the collision using a pair of light gates (separation distance = 0.10 m). A single Photron Fastcam Sa1.1 (Photron, San Diego, USA) monochrome high-speed video camera (resolution = 512 × 352 pixels; frame rate=30,000 fps; shutter speed = 1/30,000 s), fitted with a Sigma MM4646-6 zoom lens (Sigma Corporation, Kanagawa, Japan), was positioned perpendicular to the ball direction of travel, at the front edge of the skull, to verify first contact between the skull and ball occurred within 3 mm of the intended position on the frontal bone of the forehead. The scene was illuminated using a single PIXAPRO LED panel light (PIXAPRO, Brierley Hill, UK) and a single Arri Arrisun 12+ light (Arri, Munich, Germany). A full schematic of the experimental setup is shown in Figure 1(a). Both hydrophone and video recordings were initiated by the light gate signal, allowing temporal alignment of hydrophone and video data for detection of the point of first contact (depicted in Figure 1(c)).
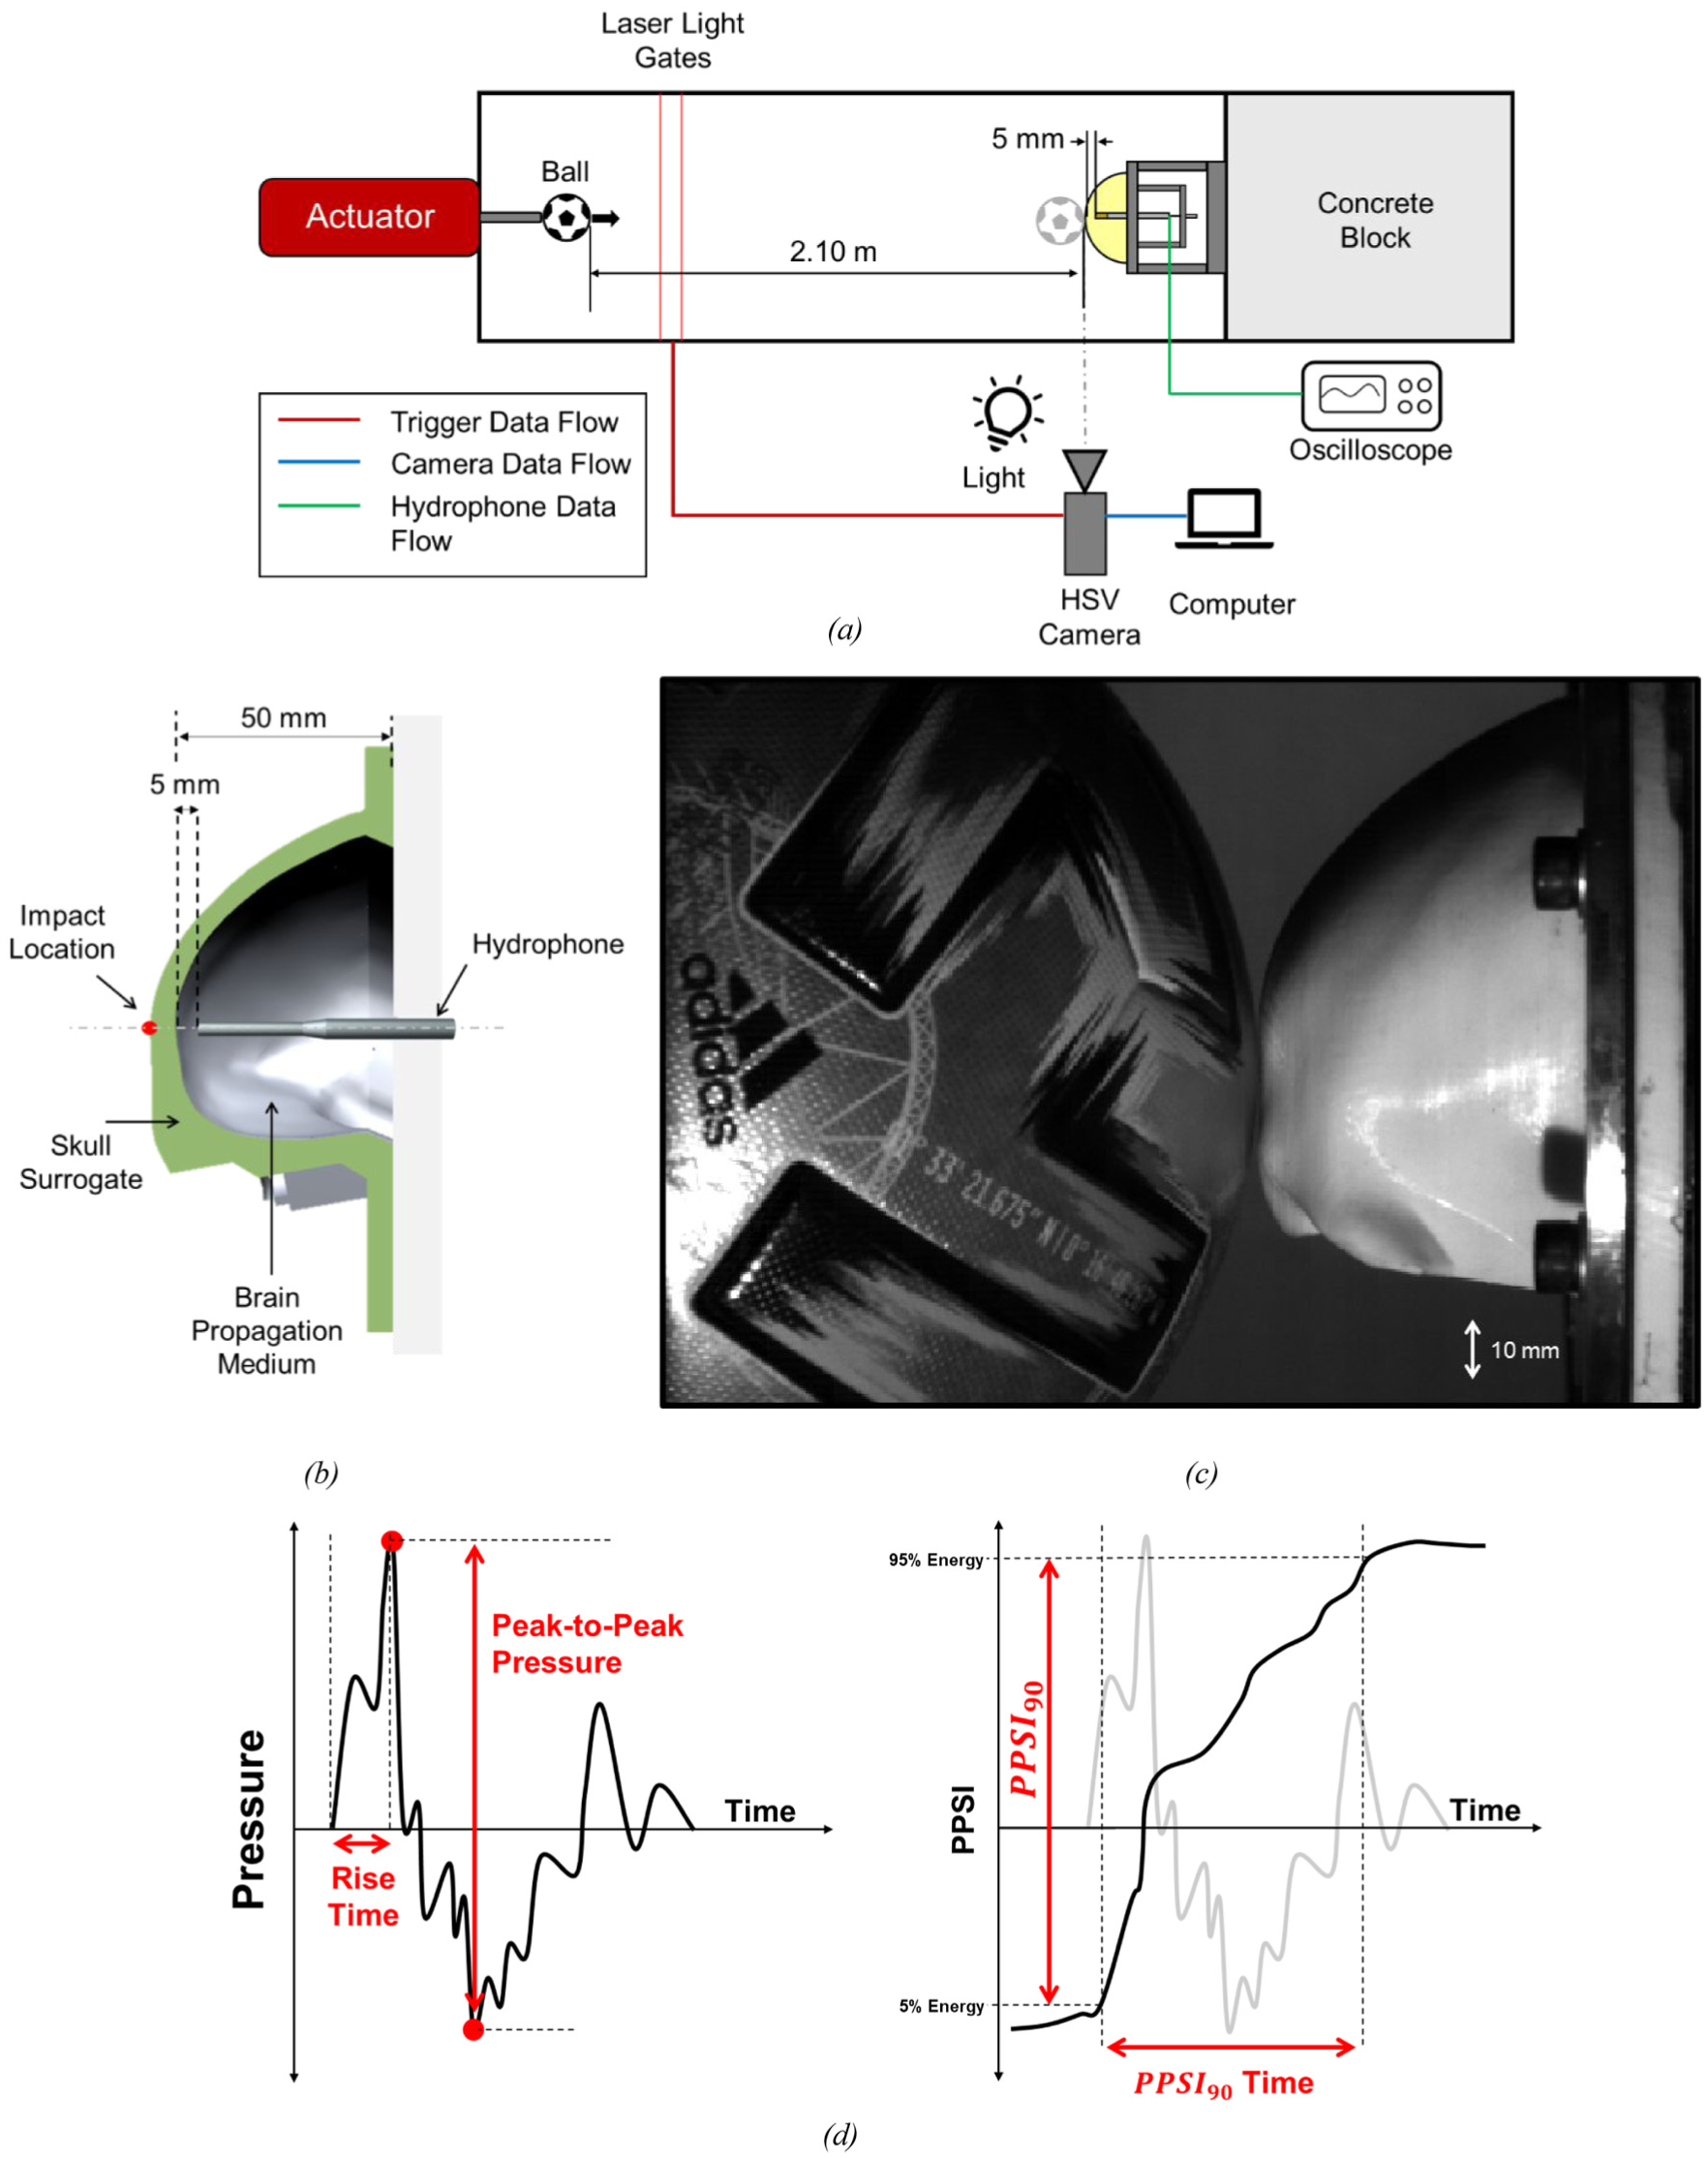
(a) Plan view schematic diagram of experimental setup and apparatus for pressure wave impact testing, (b) illustration of skull surrogate showing cross section of half-skull setup with propagation medium within skull cavity and positioning of hydrophone relative to impact location, (c) video footage showing point of first contact between ball and head model and (d) representations of pressure-time and PPSI-time traces with key extraction metrics annotated.
Representative human skull geometry (25-year-old Japanese male; height = 173 cm; weight 65 kg), was obtained from an MRI scan from Tokyo Institute of Technology, in accordance with relevant guidelines and regulations, with appropriate ethical approval and informed consent.
77
Following the method of Stone and England,62,78 this geometry was used to produce a skull surrogate. A sectioned half-skull configuration was developed, representing the forehead region, with a 50 mm deep cranial cavity. The skull was additively manufactured from ABS filament, using a Bambu Lab X1-Carbon (Bambu Lab, Shenzhen, China) 3D printer (filament material = 1.75 mm white ABS; nozzle diameter = 0.4 mm; layer height = 0.08 mm; infill density = 100%). This cavity was filled with degassed Aquasonic 100 ultrasound gel
79
(density = 1080 kg/m3; speed of sound = 1490 m/s; acoustic impedance=1.6
The skull was rigidly mounted to a square steel plate (200 mm × 200 mm × 15 mm), secured to an aluminium box frame (440 mm × 330 mm × 260 mm), bonded to a 2 tonne concrete block. Two equidistant steel rods extended from the rear of the plate (length = 140 mm; diameter = 20 mm), onto which a flat measurement plate was attached (150 mm × 30 mm × 10 mm). This plate housed a depth micrometre (RS Components, Corby, UK; resolution = ±0.001 mm; barrel length = 25 mm).
Pressure signals were measured using a 4 mm diameter needle hydrophone (Precision Acoustics model NH4000, Dorchester, UK) connected to a pre-amplifier and DC coupler via a 10 m cable. The hydrophone was submerged in the acoustic gel within the skull cavity and positioned 5 mm from the interior skull surface; a distance greater than the subarachnoid space approximating a frontal brain location, 83 to capture the direct pressure wave path before reflections. The barrel of the hydrophone was fitted into an aluminium tube, which aligned its position to the impact position and velocity vector of the inbound ball. The hydrophone was immersed within the medium for at least 10 min prior to data acquisition to allow thermal and pressure acclimatisation. Signals were acquired using a Tektronix MDO4000C Series Mixed Domain Oscilloscope (Tektronix, Beaverton, USA) at a sampling rate of 10 MHz.
Unfiltered voltage-time signals from the hydrophone, calibrated to international ISO standards,
84
were converted to pressure-time traces using a linear calibration factor (12,590 mV/MPa), and analysed using custom MATLAB algorithms (version R2021b, MathWorks, Natick, USA). Metric-based signal characterisation enabled comparisons between balls, velocities and conditions. Both pressure-time and energy-time metrics were reported. Signal magnitude was characterised by the peak-to-peak pressure, determined by the difference between the peak overpressure and peak underpressure. The rise time was defined as the time from the initial disturbance of the noise floor, characterised and verified for stability using moving mean and moving standard deviation, to peak overpressure. In the energy-time domain, pulse pressure squared integral (PPSI) curves were derived from pressure-time data, calculated across the recorded signal from 1 ms before, to 1.5 ms after, the noise floor disturbance.
85
The 90% PPSI level (
Experimental design
Ball types
Twenty footballs were tested, all conforming to IFAB Law II. 70 They spanned seven ball types, representative of those used throughout the history of the game, encompassing a sample space of materials, constructions and assembly methods, representative of different “eras of play.” Each ball type was assigned an identification letter (A-G) and each ball model within this assigned a number (for example A1, A2). Both elite and recreational samples were included. The study was conducted independently of any ball manufacturer. Leather footballs degrade over time, such that original historical samples would not accurately reflect the properties of their respective era. Therefore, modern handmade replicas were used, carefully selected to reflect authentic shell construction, including hand-stitching, laces (where appropriate) and full-grain vegetable-tanned leather of suitable thickness, without anachronistic shell materials.
All 20 balls were pre-conditioned at room temperature for 24 h prior to testing (24°C, 30% humidity) and subsequently tested under standard conditions: dry, at room temperature, with an inflation pressure of 1.00 bar (the only inflation pressure always present through history when specified in IFAB Law II 70 ) and an inbound velocity of ~18 m/s. This velocity is typical of a corner kick, 87 a common preceding event to a header. 88 Ten sequential trials were conducted for each ball. Details of each ball are provided in the Supplemental Materials (Table 1).
Details of seven balls used to represent each ball type.
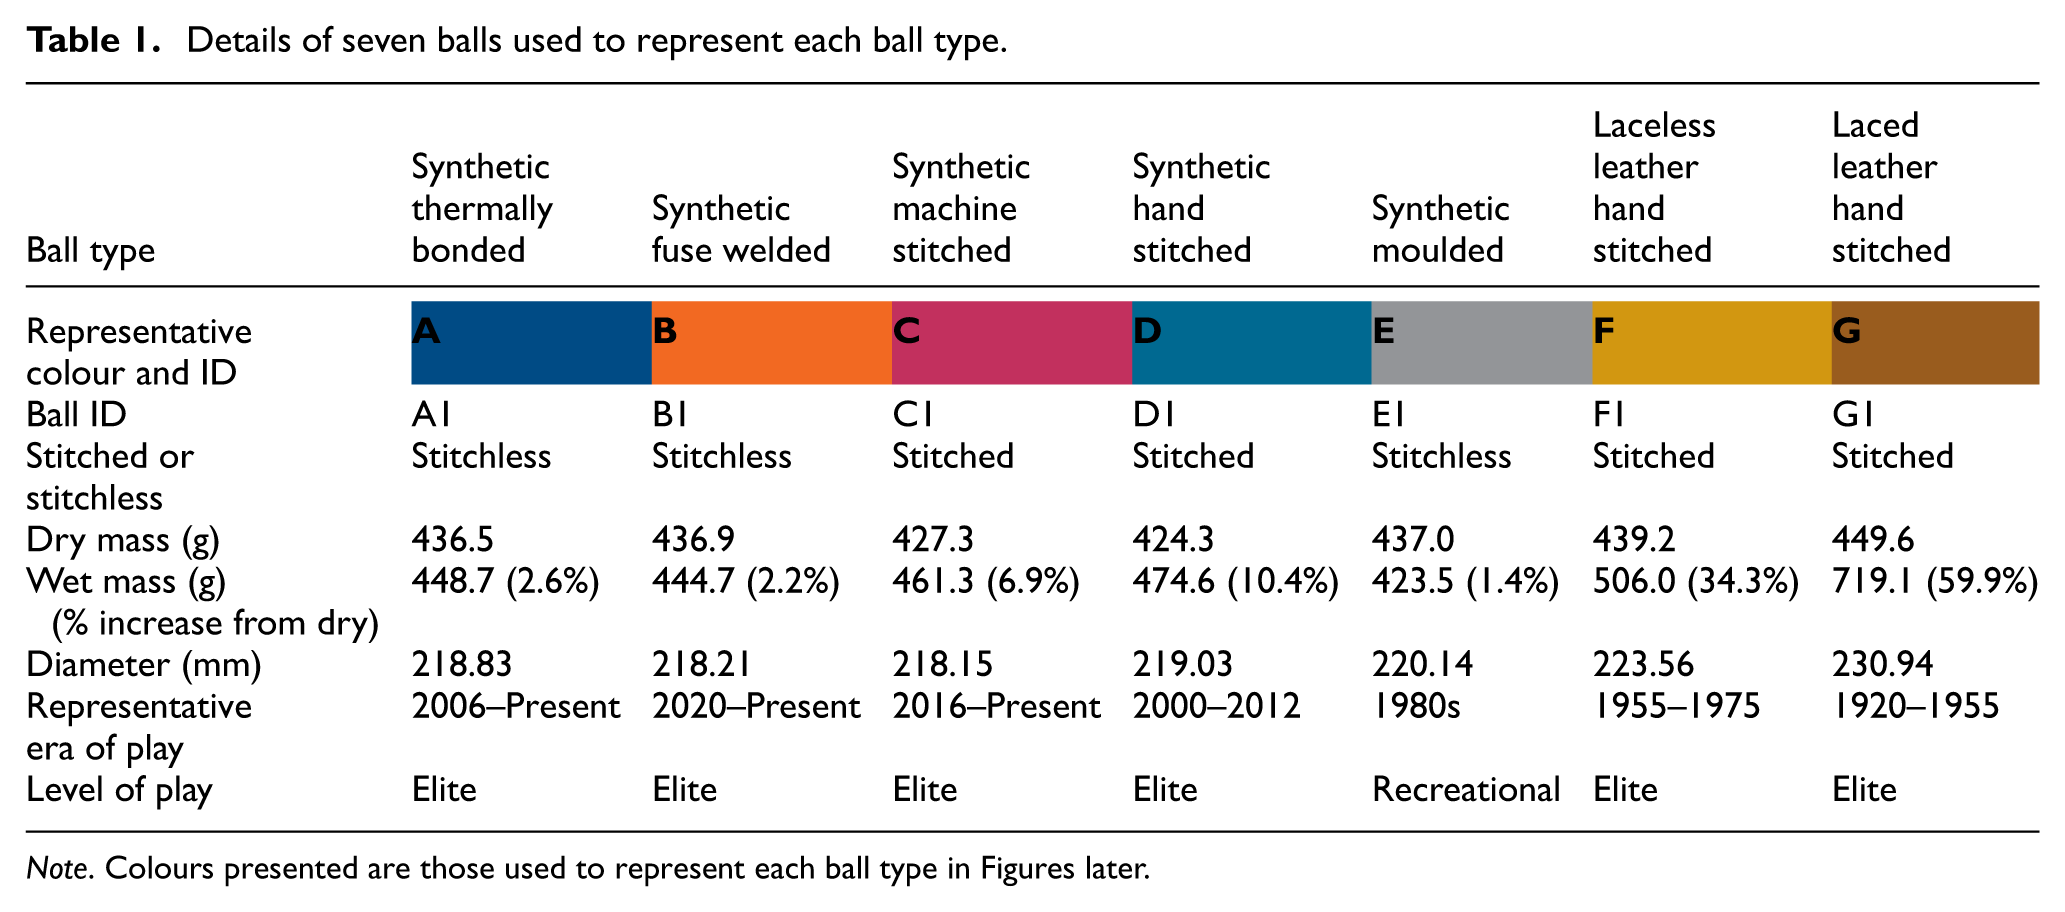
Note. Colours presented are those used to represent each ball type in Figures later.
Inbound velocity
To efficiently examine the influence of velocity and mass on the pressure signal, one example ball from each of the seven ball types was selected (ball number one for each category, see Table 1). This selection was not intended to be indicative of ball type, but rather to provide a diverse range of samples for comparison. Each ball was projected at three inbound velocities: ~13 m/s (aerial pass), ~18 m/s (corner kick) and ~23 m/s (shot). 87 Five consecutive trials were conducted for each combination of ball and velocity.
Wet conditions
The same seven balls were also tested under wet conditions. Immediately prior to testing, each ball was inflated to 1.0 bar and fully submerged for 90 min in a water bath (water temperature = 16°C), consistent with previous water uptake testing protocols. 71 Each ball was then allowed to drain for 10 min before testing, to remove excess surface water not representative of ball mass. Ball mass was measured prior to each impact using an EB Series Compact electronic scale (Ohaus, Parsippany, NJ, USA), following the procedure of FIFA Quality Programme for Footballs Test 05. 89 The skull surrogate was dried between collisions. Ten consecutive trials were conducted for each ball under both dry and wet conditions.
Statistical analysis
Results from repeated trials for each ball and condition were aggregated and reported as mean values with 95% confidence intervals. Differences between group means of individual balls under comparable conditions were assessed using pairwise Welch t-tests at α = 0.05, with Bonferroni correction to account for multiple comparisons.
To assess the influence of inbound velocity and ball type on pressure wave outcome metrics, a two-factor repeated measures analysis of variance (ANOVA) was conducted with velocity as a within-subjects factor and ball a between-subjects factor. The model assessed main effects of velocity, ball and their interaction; the latter indicating whether relationships between velocity and pressure wave characteristics varied based on the ball tested. Statistical significance of the relationships was reported through p-values assessed at the α = 0.05 significance level, with Greenhouse-Geisser correction. Effect sizes were determined using partial eta squared (η2). For each ball, post hoc one-way repeated measures ANOVAs were performed to investigate these differences.
When comparing dry and wet conditions, repeated measures analysis of variance (ANOVA) was used to assess the main effect of the ball, its condition and their interaction on each pressure wave outcome metric. Statistical significance of the relationships was reported through p-values assessed at the α = 0.05 significance level, with Greenhouse-Geisser correction, and effect sizes were determined using partial eta squared (η2). Post hoc paired t-tests (α = 0.05) were used to assess statistical significance within balls between dry and wet conditions.
Results
Pressure wave characteristics
Each of the 430 collisions conducted within this study resulted in a pressure measurement at a 5 mm depth inside the surrogate cranial cavity. Figure 2 shows a representative pressure-time signal for each of the seven balls in Table 1, and examples from individual balls are available in the Supplemental Materials. The first point of contact was timestamped as
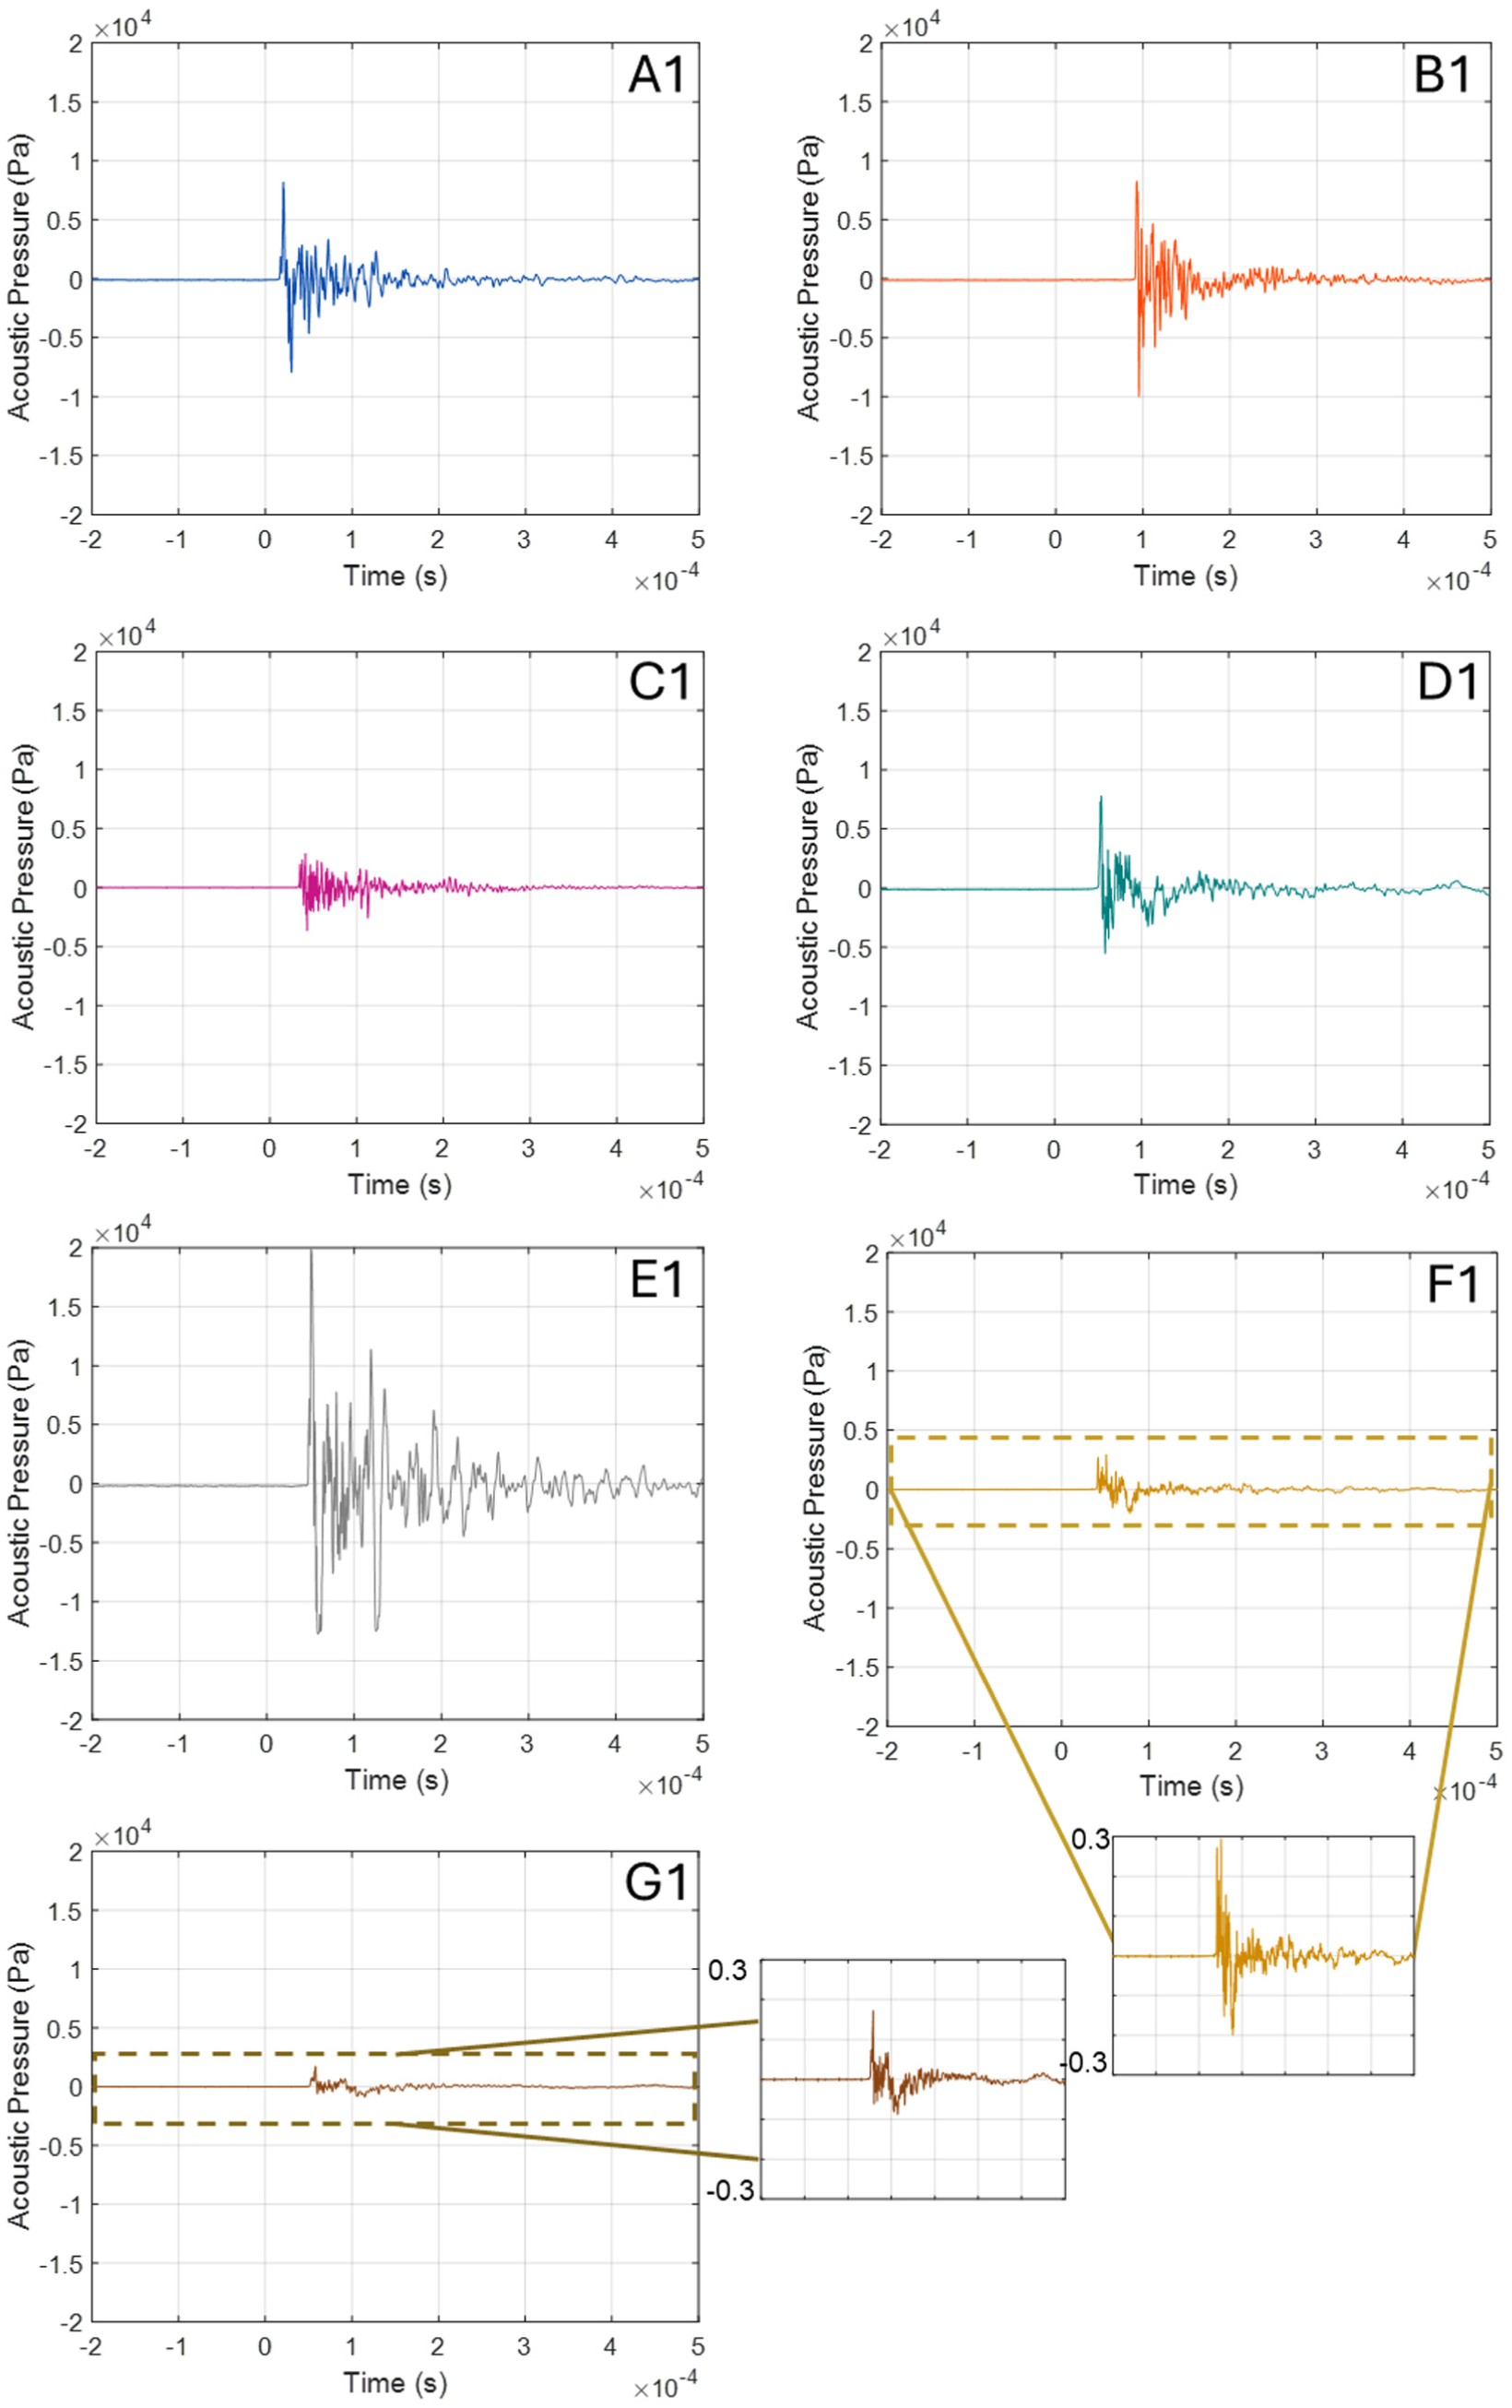
Representative pressure-time traces for an example ball from each ball type. The start of contact between the ball and head is timestamped as t = 0. Each subplot shows 500 μs of signal following this. Vertical axes are common between each subplot to visualise differences in pressure magnitudes between balls.
Within the first few hundred microseconds, the signals showed a rapid increase to a compressional overpressure peak, followed by a tensional underpressure. Ninety percent of energy within each signal was contained within the first 500 μs, before the pressure returned to equilibrium. The signals then decayed, returning to equilibrium within 500 μs (0.5 ms) of the time of first contact. Across repeated trials with the same ball at the same velocity, the signals exhibited comparable acoustic signatures and repeatable magnitudes, with peak-to-peak values yielding a coefficient of variation between 2.2% and 29.1%.
Differences between balls
Pressure signals were measured from collisions with 20 different balls, projected 10 times each, at 18.20 m/s ± 0.27 (1 SD) m/s, in dry conditions. The mean peak to peak pressure from each ball was found to vary from a minimum of 3.4 kPa (G1) to a maximum of 31.0 kPa (C1, Figure 3(a)). The moulded ball D1 generated the highest mean peak-to-peak pressure, 9.1-fold greater than the uncoated laced leather ball (G1, 3.4 kPa) and 1.6-fold greater than the laceless coated leather ball (F1, 5.6 kPa). Substantial variability was observed among synthetic balls, and even between balls of the same type, with a mean peak-to-peak pressure range of 12.6 kPa for synthetic thermally bonded balls and 20.0 kPa for synthetic hand stitched balls. The elite synthetic machine stitched ball (C1) exhibited the lowest peak-to-peak pressure of any synthetic ball (5.7 kPa), significantly lower than all other synthetic balls.
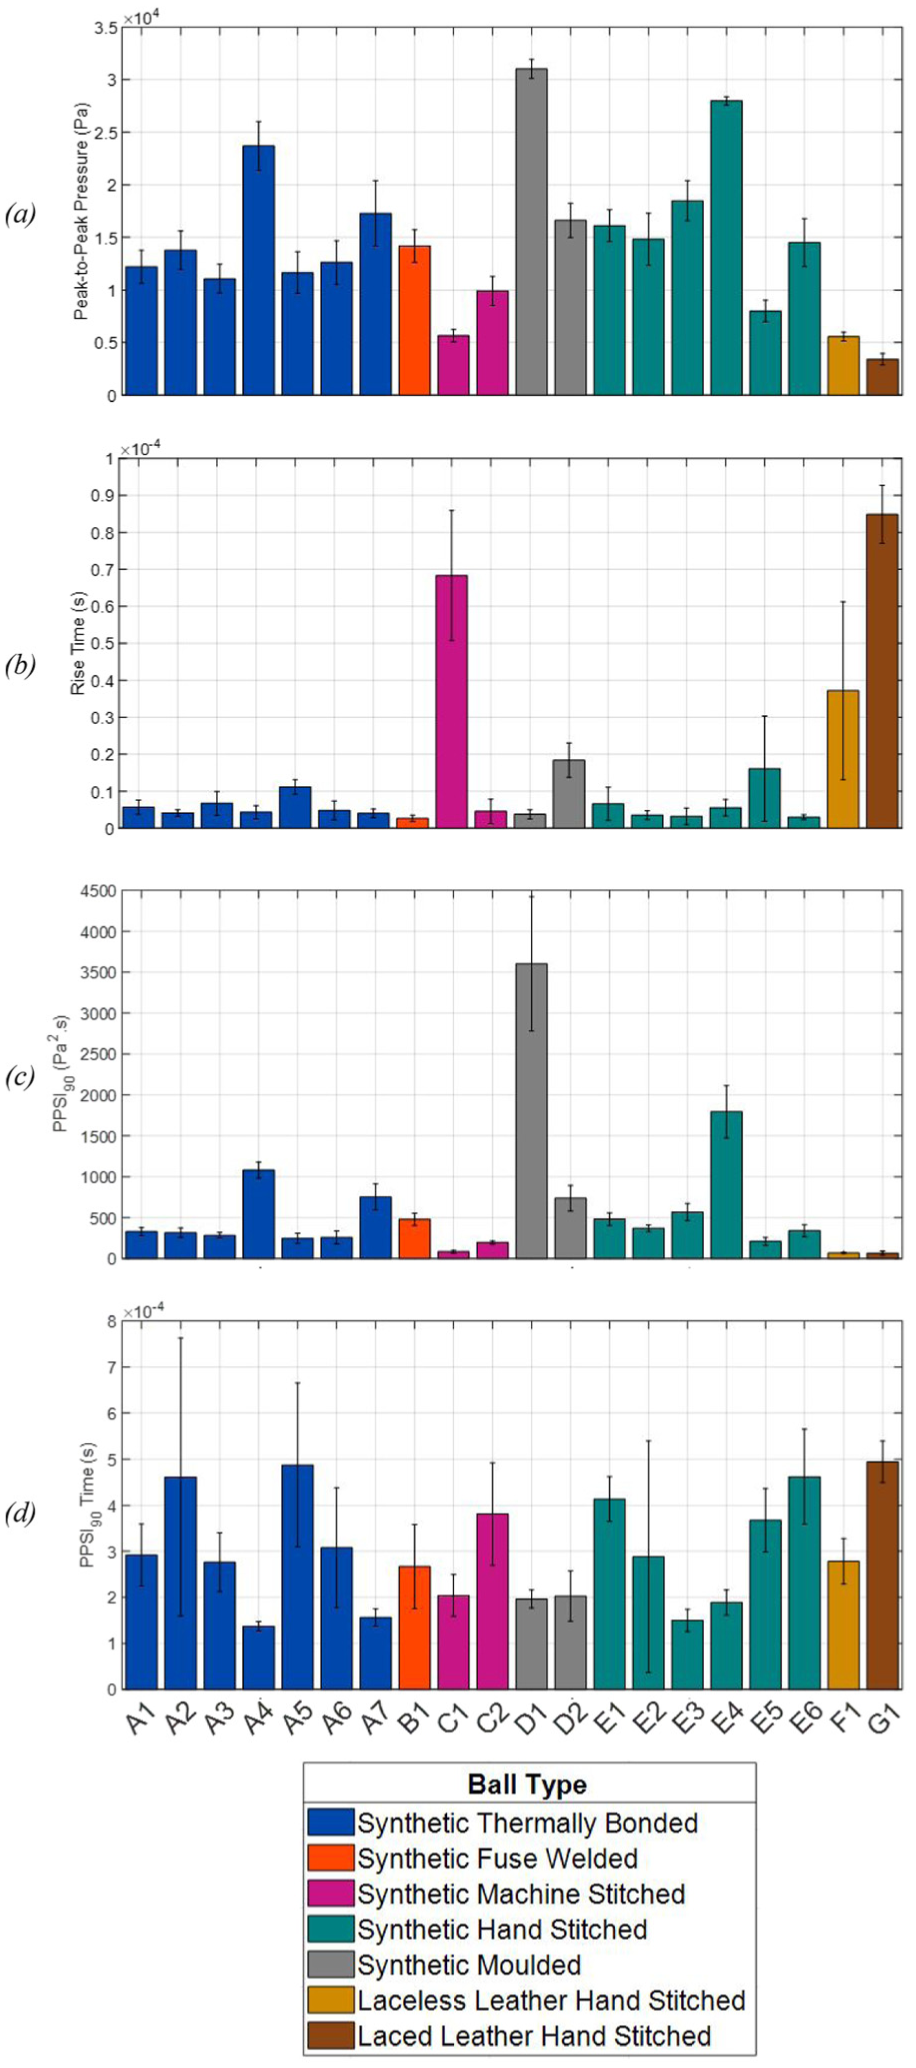
Results for all balls tested in standard conditions (dry, room temperature, 1.0 bar inflation pressure, 18 m/s velocity) for: (a) peak-to-peak magnitude, (b) peak-to-peak time, (c)
The mean rise time varied between 2.7 and 84.9 μs representing a 31.4-fold difference between balls (Figure 3(b)). Leather balls exhibited significantly longer rise times than all synthetic balls, except for the machine stitched ball C1. The uncoated laced leather ball G1 exhibited the longest rise time – more than twice that of its laceless coated counterpart F1 (p = 0.004). When both pressure-time characteristics were considered, the machine stitched ball C1 behaved comparably to the leather balls and was a clear outlier to the synthetic balls. The shortest mean rise time was observed in the fuse welded synthetic ball B1. Notably, among the synthetic samples, many exhibited similar rise times, but significantly different peak-to-peak magnitudes, indicating little or no dependency between pressure wave magnitudes and temporal characteristics.
When energy-time characteristics were considered, the
The duration over which the 90% of the energy contained within the signal was delivered ranged from 137 to 494 μs (Figure 3(d)). The uncoated laced leather ball exhibited the longest mean
Effect of velocity
A sample of seven balls was tested at three different inbound velocities, with five impacts per ball, per velocity. Measured velocities were 13.90 ± 0.18 (1 SD) m/s, typical of an aerial pass, 18.29 ± 0.25 (1 SD) m/s, typical of a corner kick and 23.46 ± 0.15 (1 SD) m/s, representative of a shot. Across the range of velocities, the general characteristics of the pressure-time signals depicted in Figure 2 were retained, including the delay from the start of contact and typical signal signatures. However, increasing the inbound velocity notably affected the characteristics of the pressure signals.
Peak-to-peak pressure increased up to 5-fold for a 10 m/s (22.37 mph; 36.00 km/h) increase in velocity, approximately corresponding to the difference between heading a typical cross-field pass and blocking a shot (Figure 4(a)). Repeated measures ANOVA showed that peak-to-peak pressure was influenced by both velocity (η2 = 0.85; p < 0.001) and ball (η2 = 0.98; p < 0.001). A significant interaction effect (η2 = 0.67; p < 0.001) between these also revealed the effect of velocity was different between balls tested.
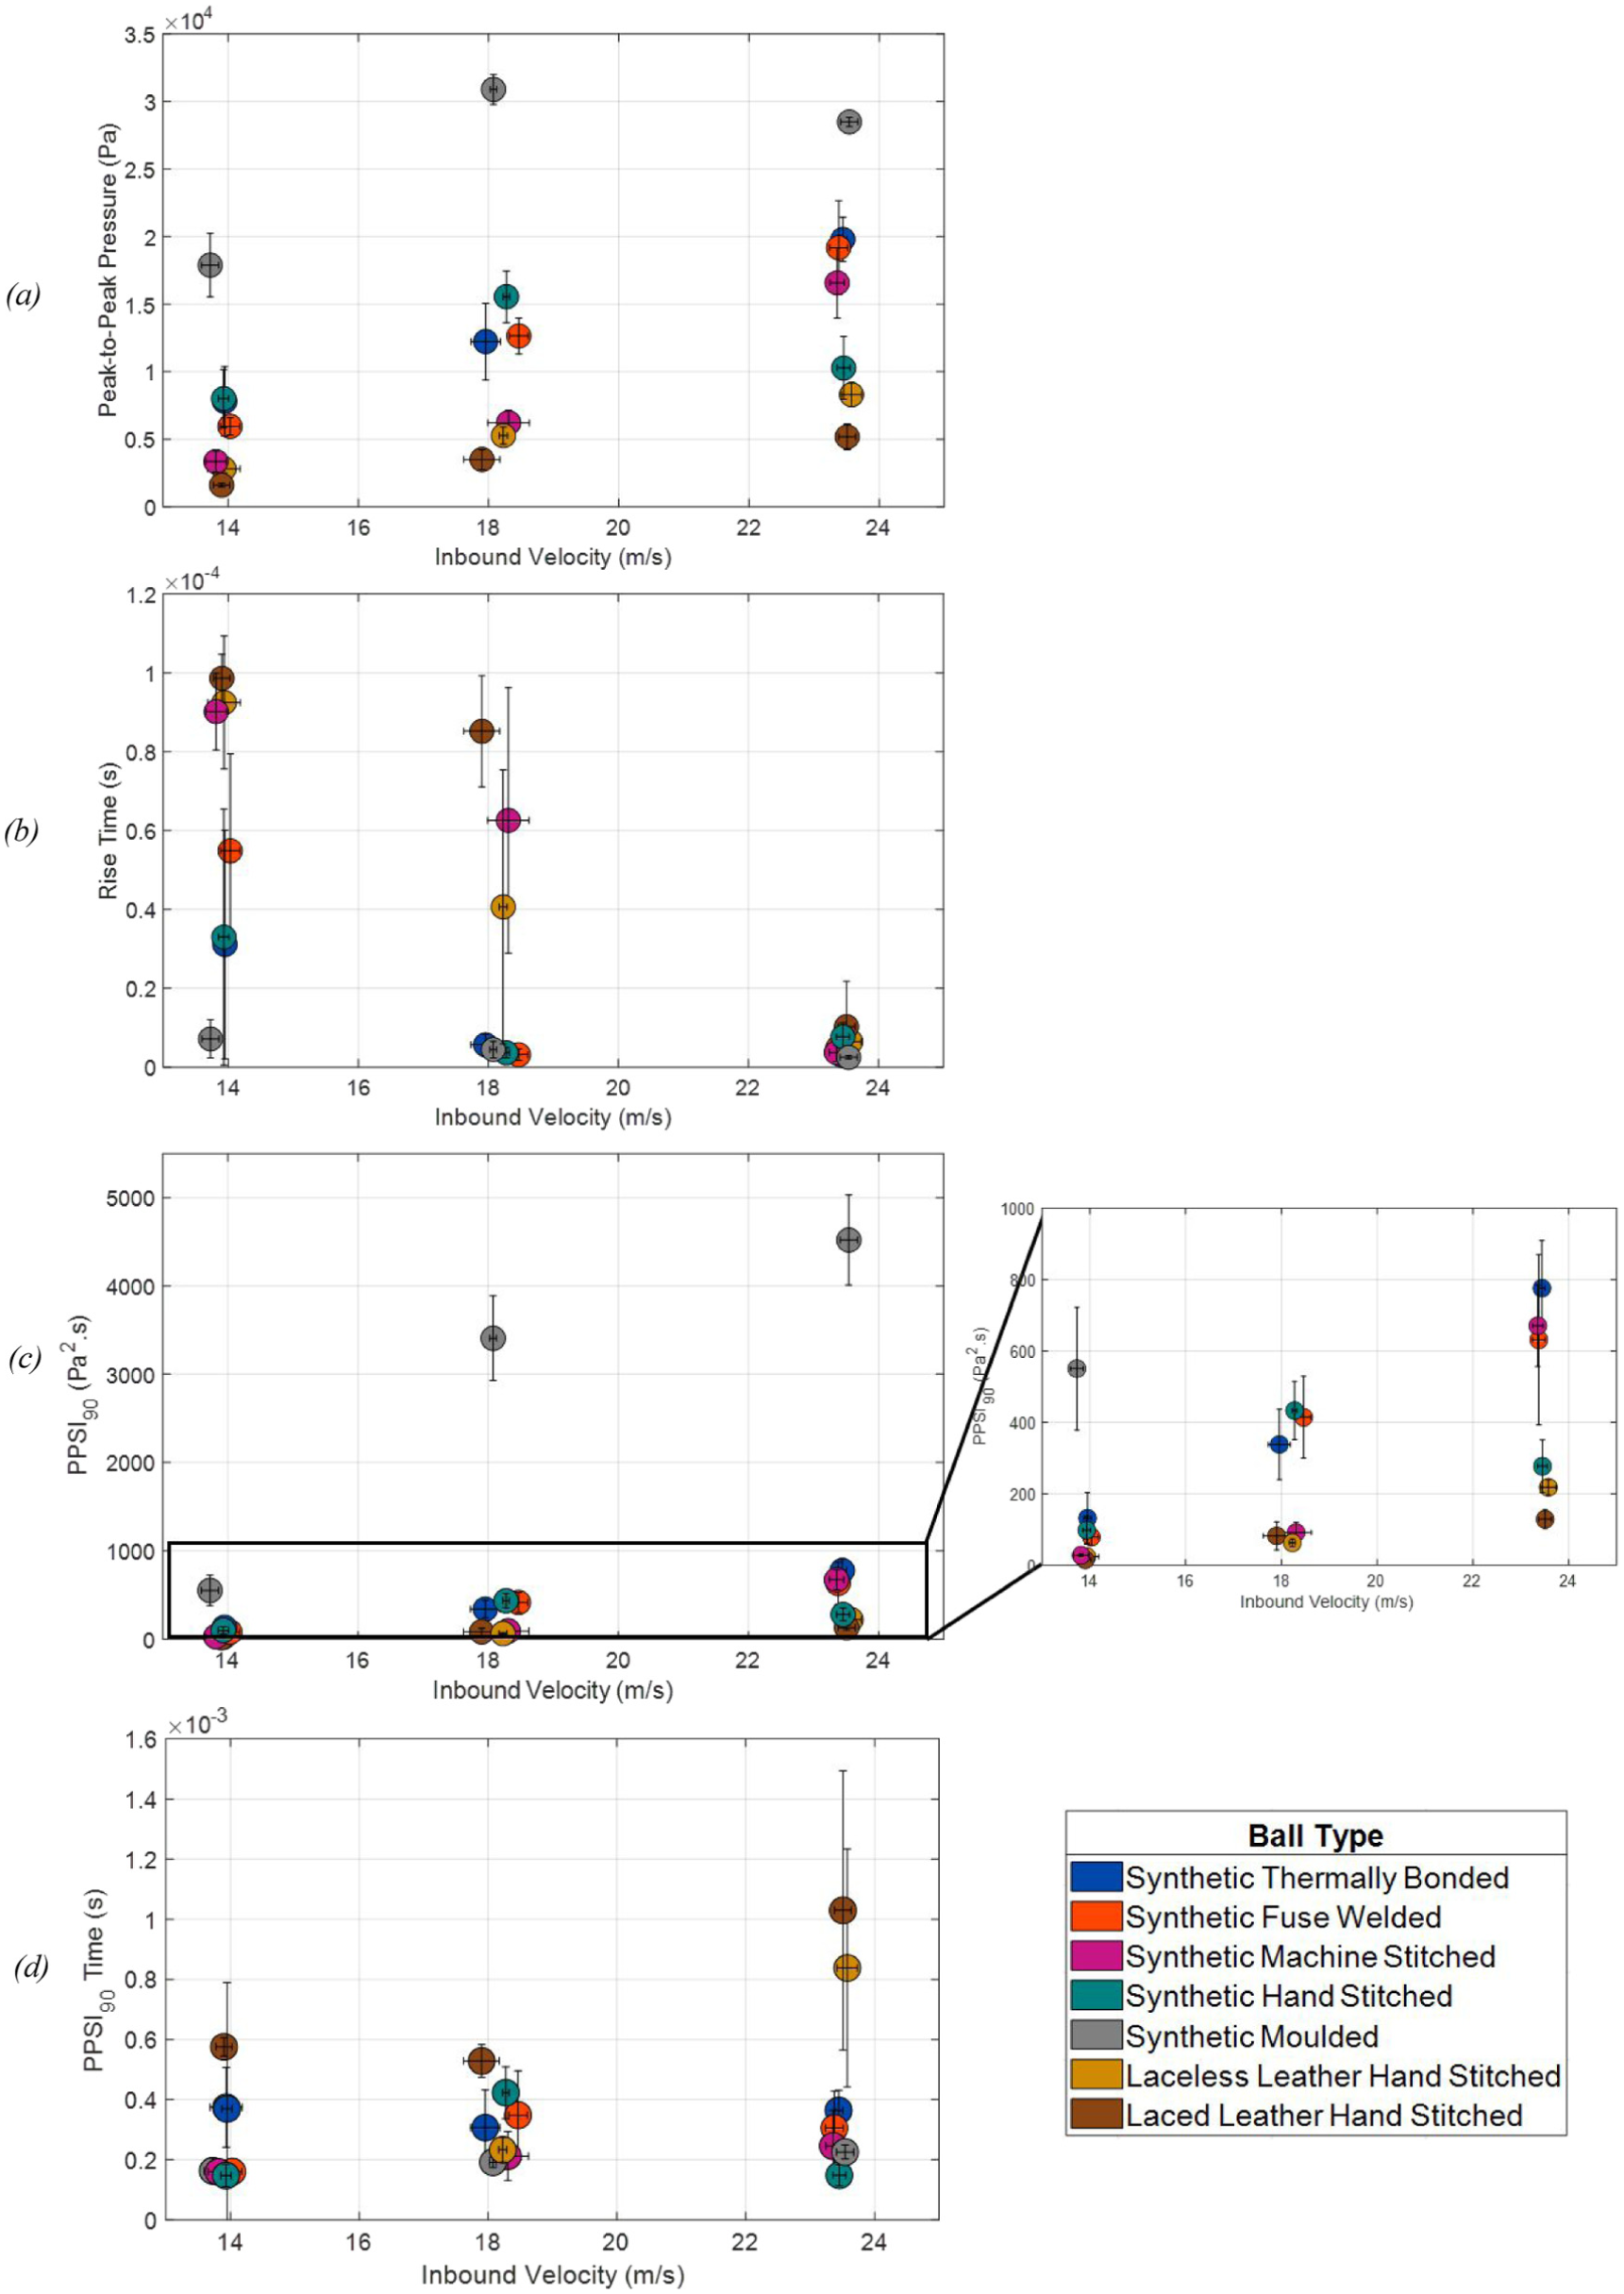
Changes in: (a) peak-to-peak pressure, (b) peak-to-peak duration, (c)
Increasing velocity significantly increased peak-to-peak magnitudes for each ball (p < 0.001 in each case). Different balls responded differently to velocity such that their order changed at different velocities. The difference between the maximum and minimum mean peak-to-peak pressures across all balls at 18 m/s was 27.6 kPa, representing a 9.1-fold difference. At 13 m/s this difference decreased to 16.3 kPa, corresponding to an 11.2-fold difference while at 23 m/s it was 23.3 kPa, representing a 5.5-fold difference.
Both ball (η2 = 0.87, p < 0.001), velocity (η2 = 0.78; p < 0.001) and their interaction (η2 = 0.68; p < 0.001) statistically significantly influenced rise times. The range of mean rise times between balls decreased with inbound velocity (Figure 4(b)). At 13 m/s, the difference in rise time between balls exceeded 90 μs whereas at 23 m/s the balls clustered, with a range of only 7.8 μs. Each ball exhibited significantly shorter rise times with increased inbound velocity, indicating that as the ball shell was deformed more rapidly, the influence of materials and construction on temporal characteristics of the resulting pressure signal reduced. For example, leather balls, which differed from synthetic balls at lower velocities, behaved comparably to them at higher velocities.
Additionally, ball (η2 = 0.98, p < 0.001), velocity (η2 = 0.85; p < 0.001) and their interaction (η2 = 0.92; p < 0.001) statistically significantly influenced
For
Differences between dry and wet conditions
Seven balls were tested in both dry and wet conditions. Repeated measures ANOVA revealed that the ball (η2 = 0.94; p < 0.001) showed a larger main effect on peak-to-peak pressure than condition (η2 = 0.39; p < 0.001). However, a strong significant effect of their interaction (η2 = 0.86; p < 0.001) highlighted that the influence of condition was not consistent between balls. Post hoc pairwise comparisons revealed significant differences between dry and wet conditions for each ball except B1 (p = 0.083), however the direction of difference differed between balls. The most pronounced differences between conditions were observed in the leather balls (For F1, T = −23.0, p < 0.001; for G1, T = −5.9, p < 0.001). Representative pressure-time traces for leather balls under dry and wet conditions are shown in Figure 5. Mean peak-to-peak amplitudes increased by 277% and 317% for the uncoated and coated balls, respectively (Figure 6(a)). The mean peak-to-peak pressure was 23.1 kPa for the wet coated laceless ball, exceeding the pressure measured in 17 of the 20 balls tested under standard conditions, and 12.9 kPa for the uncoated laced ball, exceeding 9 of 20 balls under standard conditions.
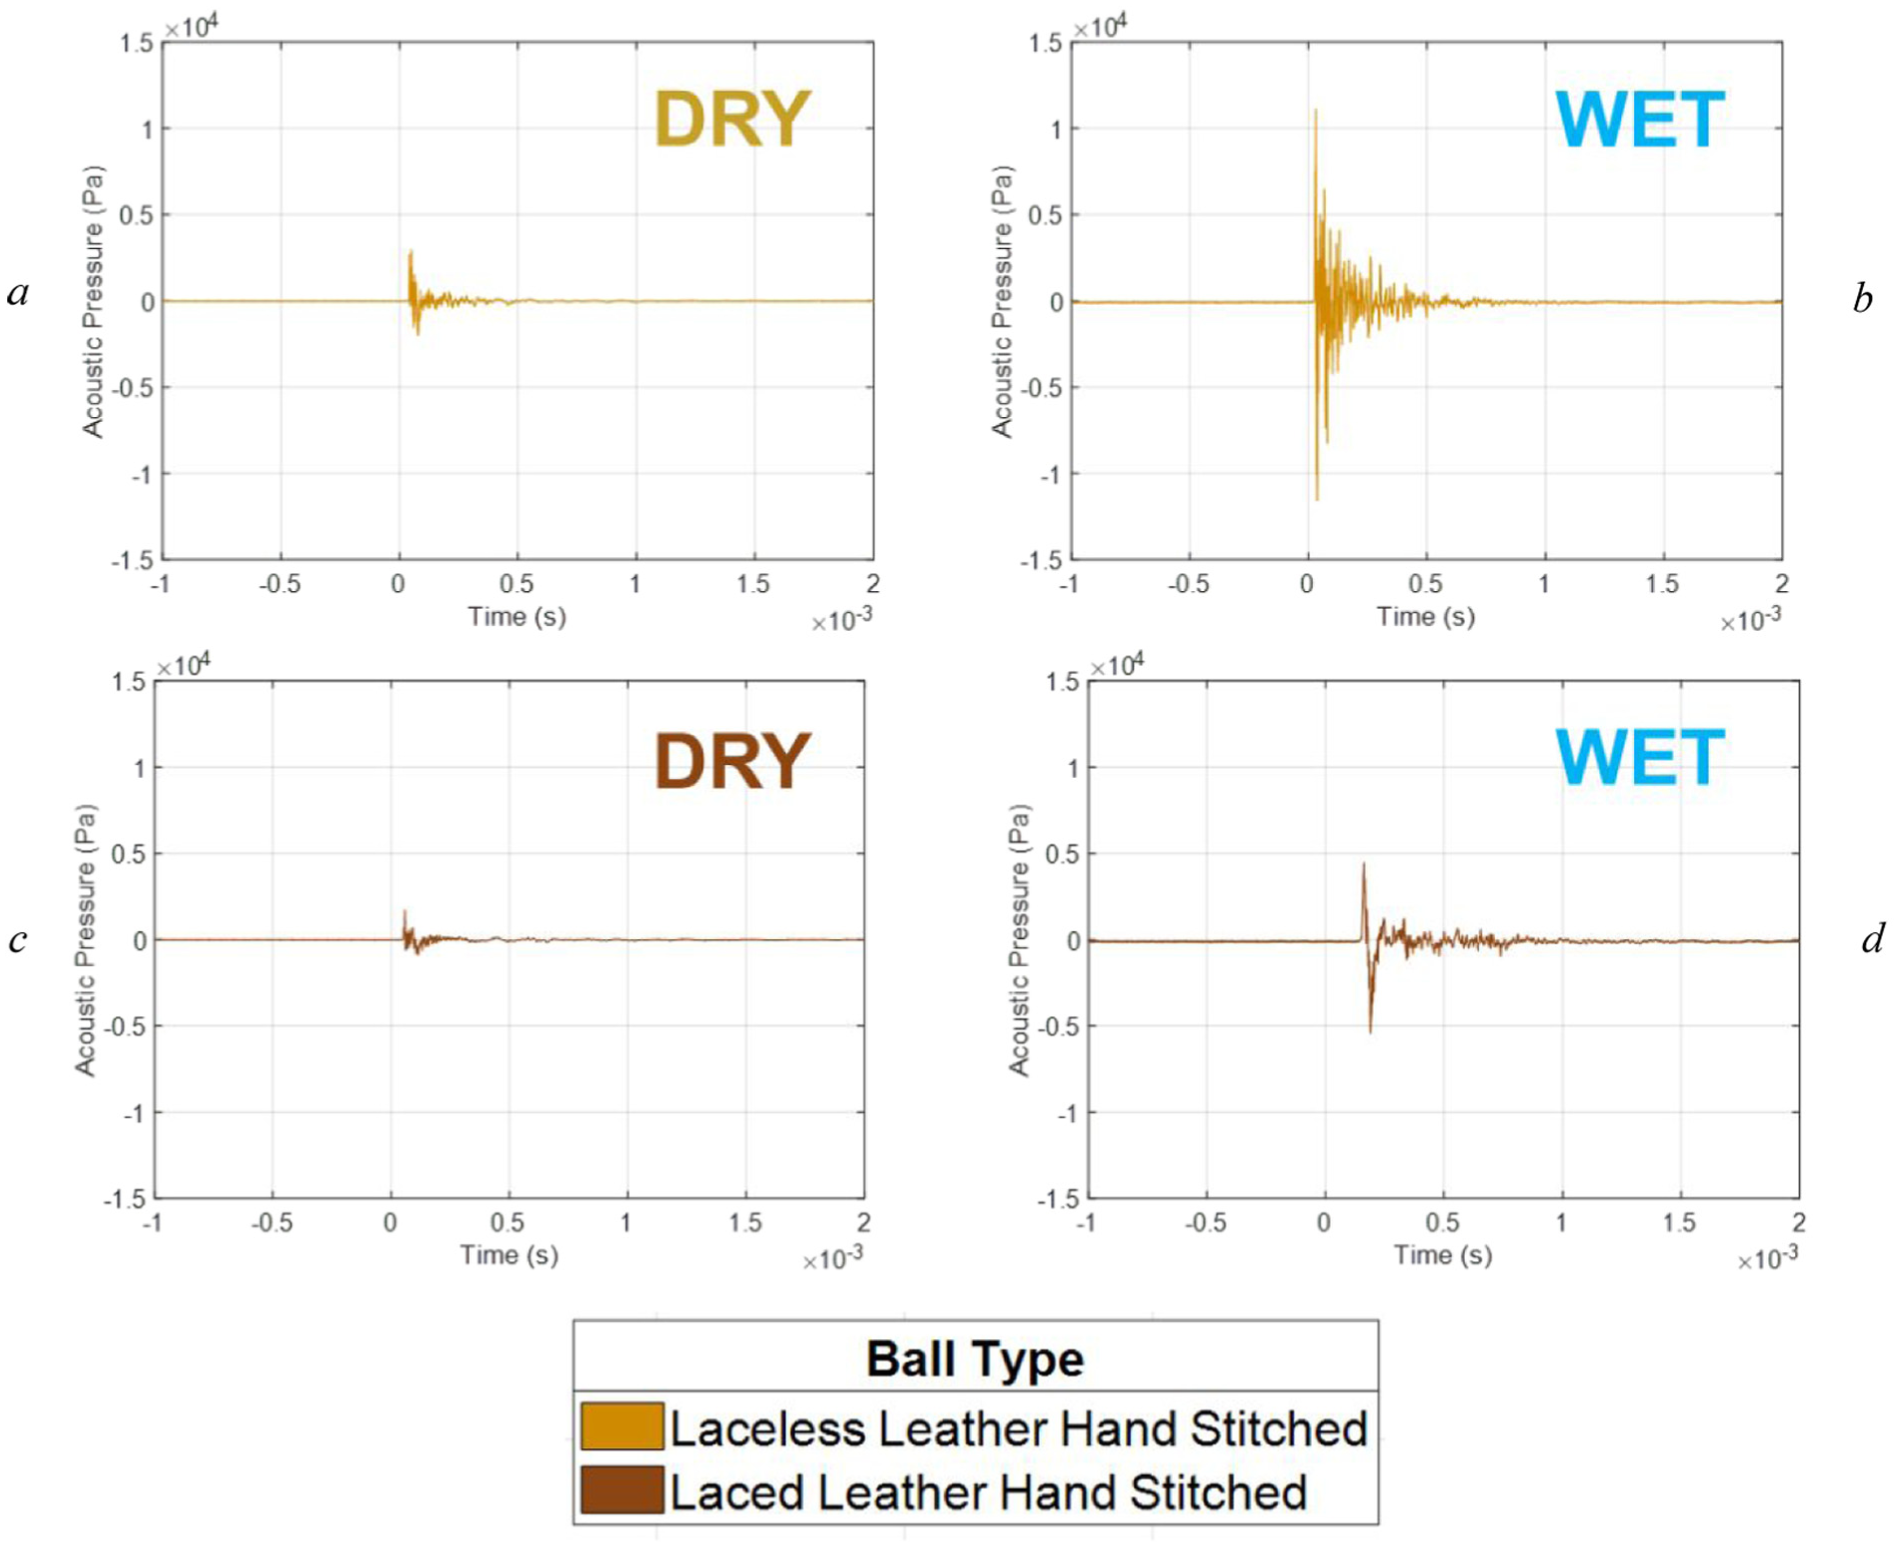
Representative pressure-time traces for leather footballs in (a and c) dry and (b and d) wet conditions. Axes scales are consistent between each trace to visualise differences. Dry traces for these balls are visualised in greater detail in Figure 1.
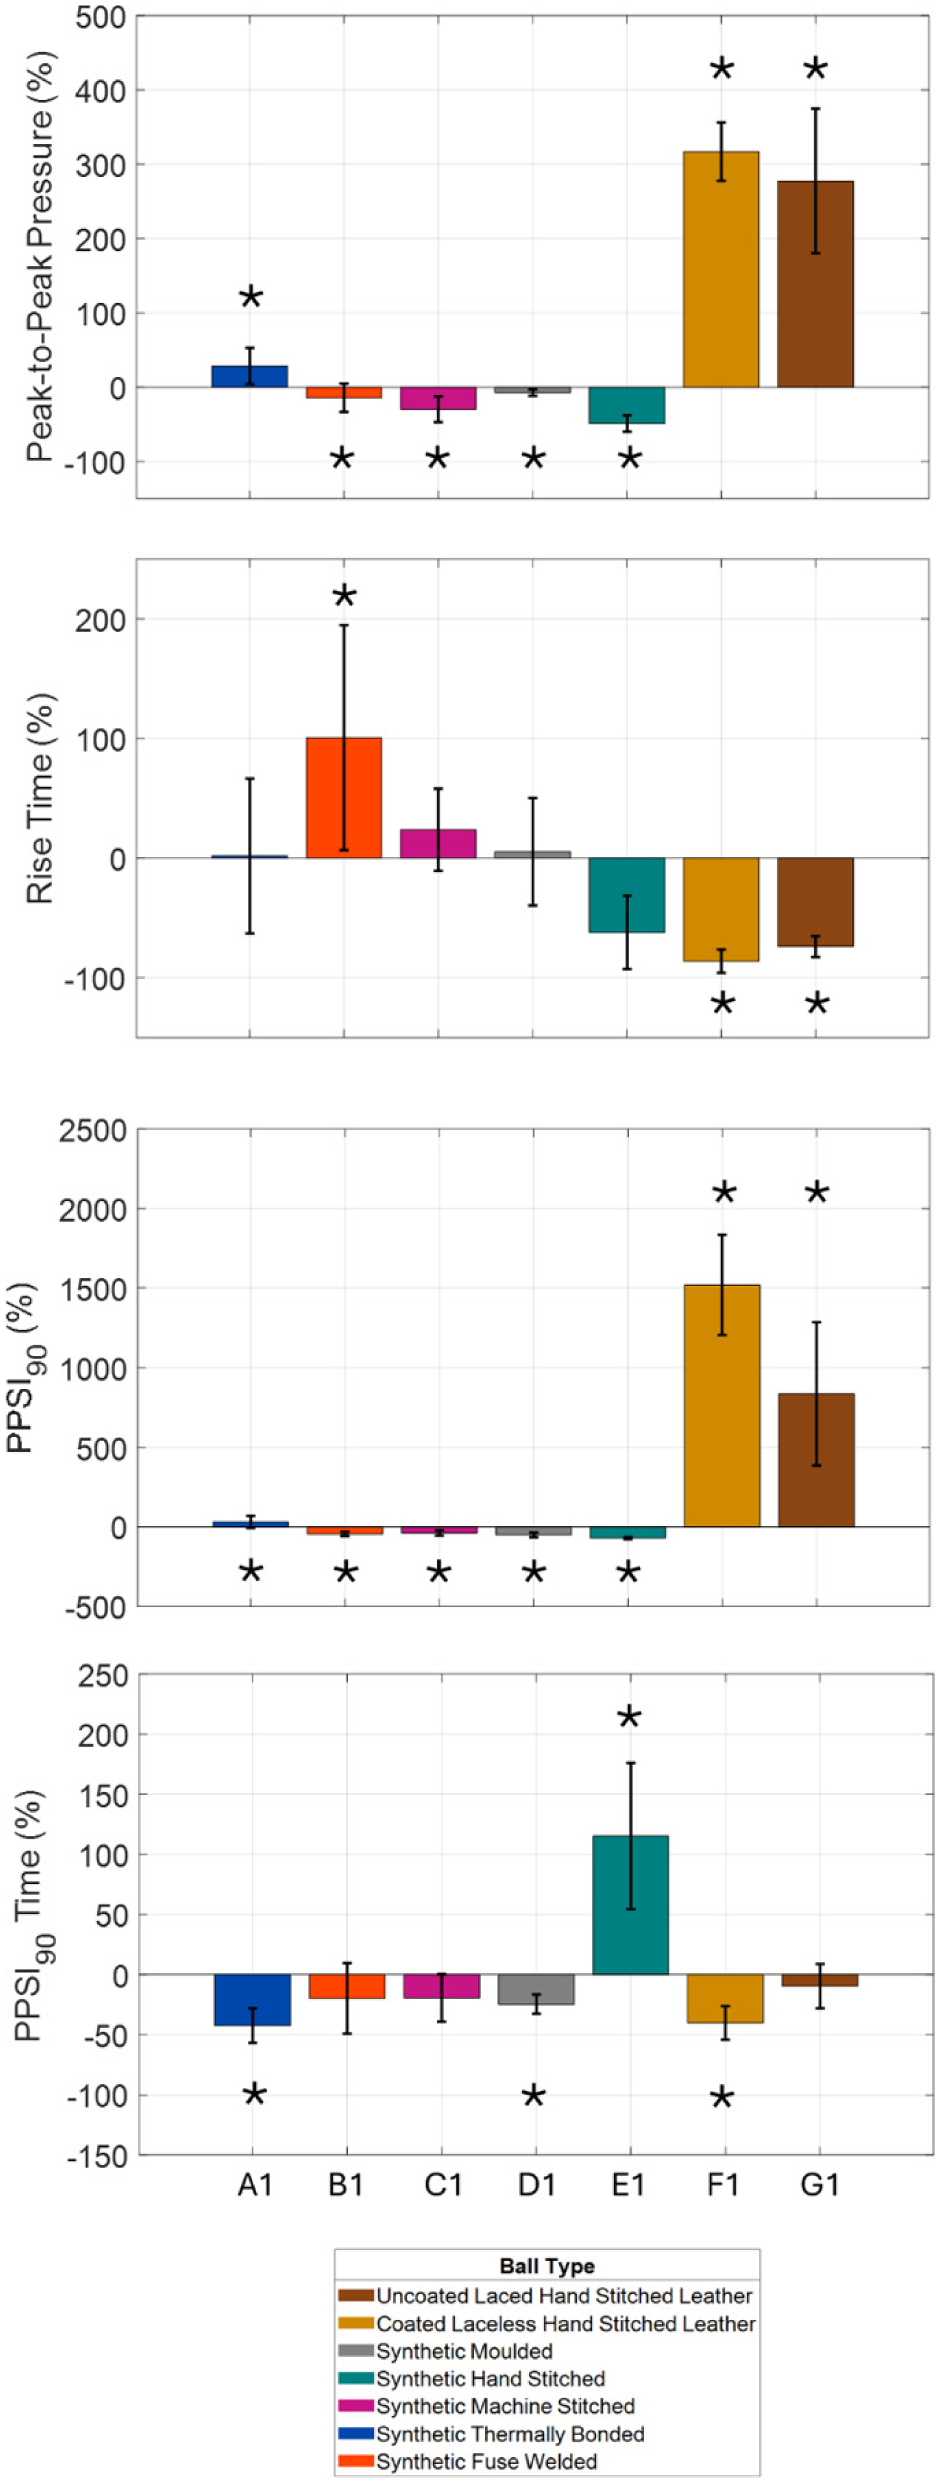
Percentage differences from dry to wet conditions, for each ball, for: (a) peak-to-peak-pressure, (b) rise time, (c)
Ball (η2 = 0.90, p < 0.001), condition (η2 = 0.22; p< 0.001) and their interaction (η2 = 0.58; p < 0.001) also statistically significantly influenced rise times. Leather balls demonstrated significantly shorter rise times when wet (Figure 6(b)), with mean values of 15.2 and 56.4 μs for the coated laceless (T = 2.6; p = 0.031) and uncoated laced balls (T = 9.4; p < 0.001), respectively. These values were comparable to those of synthetic balls under both dry and wet conditions. Therefore, while pressure-time characteristics of leather balls differed from synthetic balls when dry, their behaviour when wet was more similar to that of synthetic balls.
Whilst there was no main effect of wet condition on
The ball (η2 = 0.74; p < 0.001) and interaction variable (η2 = 0.63; p < 0.001) showed significant main effects on the
Discussion
This study experimentally documented pressure wave propagation from football head collisions. Following impact, pressure waves arrived at the hydrophone inside the skull cavity within 100 μs of the first contact with the head, emanating from the region of impact. Acoustic signatures, magnitudes and temporal characteristics were repeatable, with energy propagated within 0.5 ms – before gross head kinematics typically begin. These findings are consistent with computational simulations and animal neurotrauma models,32,50 indicating that energy from a football collision is transferred earlier and over a shorter temporal and more localised spatial domain than previously considered.
Although this study did not seek to investigate the effects of pressure waves on brain tissue directly, several contextual observations can be made. Pressure signals were comparable to those documented in some military gunshots and blast scenarios.90,91 Peak-to-peak pressures of up to 32.9 kPa were measured, whereas neurological modifications have been observed in military personnel at blast overpressures as low as 10 kPa. 92 The US Department of Defence blast overpressure exposure limit for training, measured outside the head, is 27 kPa, and is currently under review due to associations between low-level blast exposure and neurodegeneration. 93 Peak overpressures of typical military and civilian firearms are approximately 2 kPa, again measured outside the head, and can exhibit comparable acoustic signatures and temporal evolution to signals measured from football head collisions.91,94,95 The location of the measurement within the model approximates the frontal brain region, which appears most susceptible to neurodegeneration in former professional footballers, as evidenced through post-mortem analysis, 96 dementia screening tests, 7 and neuroradiology examinations. 97 Animal impact neurotrauma studies have measured blood-brain barrier disruption, and simulations have predicted the greatest brain strain in this region, prior to the onset of gross head kinematics.50,51 Blood-brain barrier disfunction is a “hallmark pathology” of Chronic Traumatic Encephalopathy, which has been identified in several former footballers.96,98–100 While these observations do not imply causation between pressure waves and neurodegeneration in footballers, they suggest that pressure waves cannot be excluded as a potential contributing mechanism. Features of the measured signals may have clinical implications. For example, greater pressure and energy magnitudes will likely increase mechanical stress on brain tissue subjected to pressure waves. Shorter rise times would indicate higher loading rates delivered to viscoelastic tissue, which may result in greater damage susceptibility.
Large differences were observed between footballs conforming to IFAB Law II. 70 Previous studies comparing peak force or peak head accelerations resulting from impacts of different footballs at similar velocities reported differences no greater than 20%.24,87,101 In contrast, this study observed a 9-fold difference in peak-to-peak pressure, and 54-fold difference in energy transfer between balls. These findings highlight the influence of ball shell materials and construction on the magnitude and duration of pressure waves and suggest a complex micromechanical interaction during impact. Greater apparent trial-to-trial variability with some balls suggests even local orientation differences may influence energy transfer. Variability in the delay between the start of contact and direct path arrival of the pressure wave, as well as differences in signal complexity between balls, support the need for further detailed micromechanical investigation. Further analysis of local ball material properties would be required to explain observed differences in pressure waves between balls.
Inbound velocity significantly influenced pressure magnitudes. Relationships with velocity varied between balls. These differences likely reflect underlying dynamic high-strain rate dependent compressive micromechanics within the ball shell. These may also explain temporal characteristics such as the lower range of rise times at high velocities, where stiffness responses may be rate dependent. The variable range of energy and pressure magnitudes between velocities may be consequential of local ball geometry and layer thicknesses, but these underlying mechanics require further investigation. The apparent non-linear relationships of some balls with velocity support the need for future testing to be conducted over a range of game-realistic velocities.
Leather balls produced the lowest pressure magnitudes in dry conditions, but these magnitudes increased substantially when wet. Unlike synthetic balls, leather balls absorb water directly into their outer panels and via ingress between seams, increasing local mass at the point of contact. 71 Water absorption may also increase local dynamic stiffness due to the incompressibility of water within the fibrous matrix of leather, as well as surface properties, however it is not possible to decouple these confounding factors. Further investigation is required to explain why some synthetic balls showed small reductions in pressure magnitudes in wet conditions, and may support the need for future testing, including new or existing standards tests, to be conducted in varied conditions.
This study has several limitations. A simplified head and brain model was used which did not incorporate detailed microstructure. In-vivo validation is lacking and will be challenging to achieve. The use of a single skull geometry limits generalisability of absolute pressure values to individuals with different cranial anatomies, such as different genders and ages. Further, the half-skull configuration provides a first-order approximation of the intracranial pressure field and does not facilitate complex 3D wave reflections. Further studies mapping these patterns may reveal detailed spatial distributions, constructive interference and focussing which may present pressure hotspots within brain geometry. Although pressure waves, particularly those from low-level blast, have been studied in military contexts, their effects on human brain tissue, specifically from football collisions, remain unproven. In addition, this study assessed a subset of balls broadly representative of different ball types however, to fully capture variability within and between ball types, wider ball testing is required. Some balls, for some metrics, demonstrated notable trial-to-trial variability. The signals measured in this study were complex, and despite tight experimental control, variance may be induced by subtle impact location, environmental variability or microscopic ball geometry.
Further studies exposing human tissue or bioengineered structures to these phenomena are required to determine their relevance to acute and long-term brain health. Integration of computational modelling to assess pressure wave propagation and energy distribution within the brain would be valuable. Wider scale ball testing and detailed micromechanical characterisation of footballs are needed to fully explore the future engineering, health or governance implications of these findings. Exploration of local, high strain rate, material stiffness and damping properties within the construction of the ball shell, and how they influence characteristics such as pressure magnitudes and rise times, may inform avenues for ball designs that would mitigate energy transfer characteristics.
The findings of this study suggest that pressure wave energy from football head collisions may be influenced by the materials and construction of the ball, and there is scope to affect this energy transfer without requiring alteration to the game or its Laws.
Conclusion
This study experimentally measured repeatable pressure wave propagation from football head collisions. The magnitude and duration of these waves were influenced by ball type, inbound velocity and water uptake. These findings provide evidence for a previously unidentified component of the mechanical insult experienced during a football head collision, and that it is distinct from macroscopic gross head kinematics. These findings provide a new mechanistic basis for future safety considerations, with potential to influence football design and equipment standards, moving beyond the current focus on head kinematics.
Supplemental Material
sj-docx-1-pip-10.1177_17543371261438388 – Supplemental material for Pressure wave propagation from association football head collisions
Supplemental material, sj-docx-1-pip-10.1177_17543371261438388 for Pressure wave propagation from association football head collisions by Ieuan Phillips, Séan Mitchell, Paul Lepper and Andy Harland in Proceedings of the Institution of Mechanical Engineers, Part P: Journal of Sports Engineering and Technology
Footnotes
Acknowledgements
The authors wish to thank The Football Association for their donation that supported this research.
Author contributions
All authors collaboratively developed the fundamental ideas and methodology of the study. IP was responsible for data collection, analysis and manuscript preparation, under the close supervision of AH, SM and PL, who also edited the final version.
Funding
The authors disclosed receipt of the following financial support for the research, authorship, and/or publication of this article: This research was conducted following a philanthropic donation from The Football Association.
Declaration of conflicting interests
The authors declared no potential conflicts of interest with respect to the research, authorship, and/or publication of this article.
Data availability statement
Data available from authors upon reasonable request and subject to appropriate sharing agreements. Contact
Supplemental material
Supplemental material for this article is available online.
References
Supplementary Material
Please find the following supplemental material available below.
For Open Access articles published under a Creative Commons License, all supplemental material carries the same license as the article it is associated with.
For non-Open Access articles published, all supplemental material carries a non-exclusive license, and permission requests for re-use of supplemental material or any part of supplemental material shall be sent directly to the copyright owner as specified in the copyright notice associated with the article.