
Abstract
Assessment of synthetic turf performance has been undertaken using a variety of experimental methods but is limited in understanding the complex physics of cleat-turf interaction. Computational models could provide insight, but there is currently no validated model of synthetic turf available. The scope of this study was to develop a Finite Element (FE) model of synthetic turf using a hierarchical approach and validate the model using independent test data. A physical third-generation synthetic turf comprising slit-film fibers with sand and rubber crumb infill was constructed. Experiments were conducted using a direct impact (Clegg) device and an artificial cleat-form. Material characterization tests were performed on the individual turf components, integrated into constitutive models, and a full turf FE model was constructed. The carpet was modeled with shell elements while the granular infill was modeled using smoothed-particle hydrodynamics (SPH) elements. A method to simulate the physical pre-conditioning performed on the experimental turf was developed. Both unconditioned and pre-conditioned turfs were assessed using Clegg tests. The re-created Clegg tests on the turf model demonstrated good agreement with the physical tests, with higher acceleration for the pre-conditioned turf. The turf model was validated using experiments with a turf test apparatus including dynamic translation and rotation of a cleat-form. The model predicted results in good agreement with the experiments (average CORA rating of 0.863) on pre-conditioned turf. The resulting model and methods can be expanded to synthetic turf of different constituent materials, to investigate their effects on cleat-surface interaction, optimizing performance, and reducing injury risk.
Keywords
Introduction
Synthetic turf is widely used in sports, such as American football, due to its longevity and reduced water usage compared to natural turf. 1 Since the introduction of synthetic turfs in the 1960s, many studies regarding the link between increased injury rates compared to natural turf (grass) have been reported. Some studies report an increase in risk of lower extremity injuries in American Football, 2 while others reported varying risk, and in some cases reduced risk, depending on the sport. 3 A recent study by Mack et al., 4 presented a 16% increase in lower extremity injuries on synthetic turf versus natural turf. Similarly, Kuitunen et al. 5 reported related results for professional European football players, showing a lower incidence of injury on synthetic turf versus other playing surfaces. Expanded parallel studies also investigated the effect of shoe variables but found outcomes did not strongly correlate to injuries.6,7
Third generation (3G) synthetic turf was developed in the 1990s with an aim to reduce injury rates and has become common on all types of sports fields globally.1,3 These 3G surfaces are commonly comprised of carpet backing with polyethylene fibers (typically 35–70 mm in length) and infill particulate material(s) deposited between the fibers. The fibers are stitched to the backing layer at specified intervals (stitch rate) with specified spacing between the rows of stitching (stitch gauge). 8 In some carpets, the fibers are retained in place by applying a layer of adhesive to the underside of the backing layer. The infill commonly consists of a bottom layer of sand (0.2–1.2 mm particle size) used to stabilize the turf, and an upper performance layer of styrene butadiene rubber (SBR) (0.5–2.0 mm particle size). 9 In some cases, different infill materials or mixtures of materials are integrated as separate layers to achieve specific compressive response and interaction with the fibers, and an underlying polymeric layer (shock pad) may be included.
There are a wide range of parameters that go into the design of a turf, some examples include the constituent materials, fiber areal density, depth of infill, and method of preparation during construction. In the context of player performance and injury, evaluation of turf requires large-scale amounts of material and specialized resources. An example is the Biocore Elite Athlete Shoe-surface Tester (BEAST). 10 The BEAST apparatus performs translation and rotation tests with a surrogate cleat-form on the turf surface to comparatively assess turf designs (Figure 1(a) and (b)). Another common form of turf evaluation is an impact attenuation test (Clegg test (Figure 1(c))) conducted to measure the turf hardness based on peak deceleration (g) tested in situ. 11
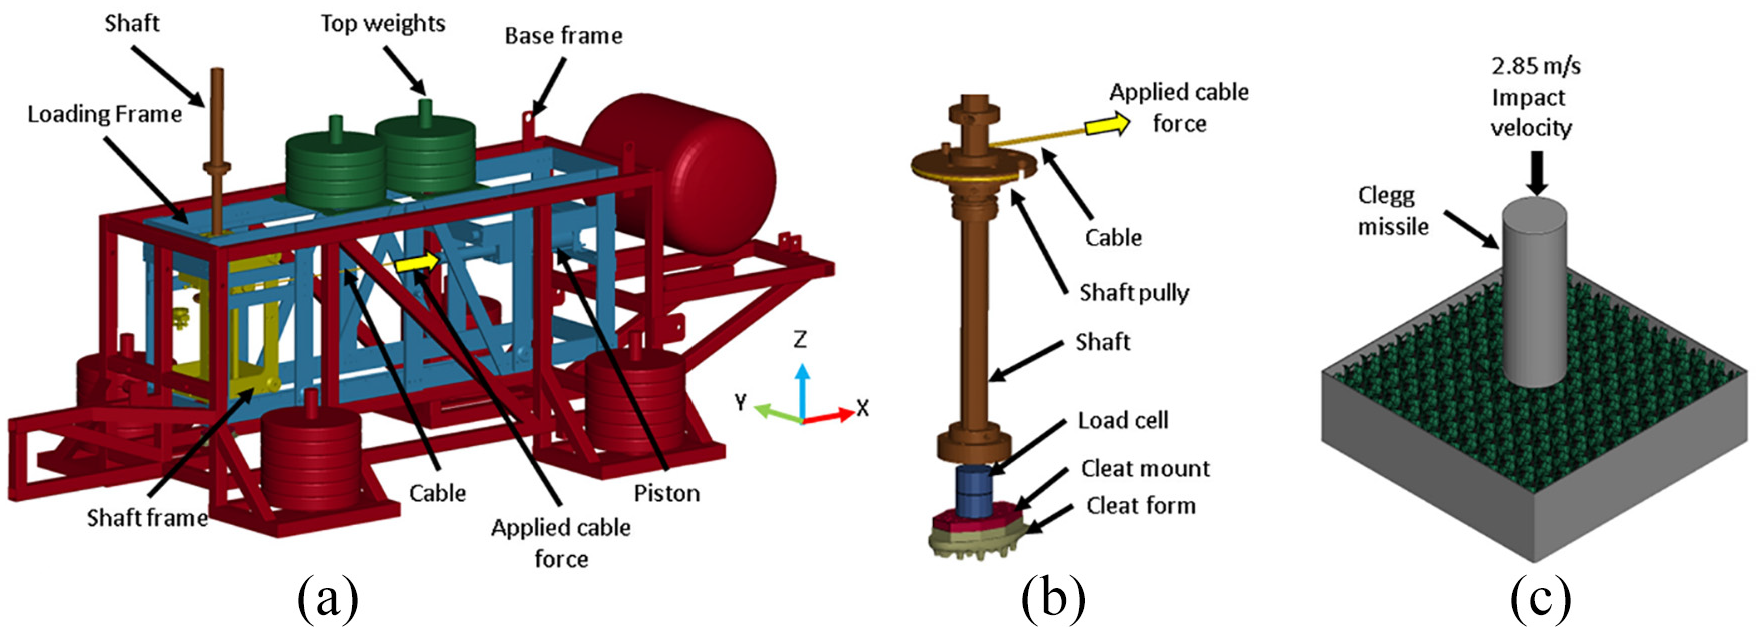
(a) BEAST test apparatus showing location of applied cable force, (b) isolated view of cleat-form attached to load shaft, and (c) Clegg impact test.
Challenges in physical testing can be alleviated by a numerical modeling tool that reduces the effort in design assessment and allows for prompt decision-making before investing into physical prototypes. 12 In the literature, there are several numerical models that exist for the constituent parts found in turf, such as fibers, 13 infill, 14 and shock pads. 15 Because the constituents are common in other systems, these numerical models are often developed outside the context of turf. For example, extensive studies have been performed on granular sand and rubber mixtures for use in geotechnical systems.16–18 However, there are no numerical models of 3G synthetic turfs that exist for the purpose of evaluating design, performance, and injury. Rittenhouse 19 made efforts in developing an infill only model using a discrete element method (DEM) approach but did not progress to the implementation of fibers and loading validation, due to software limitations in the infill-to-fiber interaction algorithm.
A recent study by Watson et al. 20 reported material characterization of infills and their mixtures within the context of synthetic turf. Watson et al. developed material models of infills using a soil material model that incorporated pressure-volume and shear yield behavior physically measured from confined-compression and direct shear experimental tests, respectively. The infills were modeled using a smoothed particle hydrodynamics (SPH) formulation with focus on the continuum behavior of infill rather than modeling discrete infill particles. The resulting model provided comparable results to the physical experiments, with relatively low computational cost compared to other meshless methods.
In the present study a synthetic turf model was developed and validated using dynamic impact tests with a Clegg FE model and cleat-form tests with a BEAST apparatus FE model. The turf model was created systematically, incorporating verification models for materials and friction characterization testing on the fibers, backing layer, and infill. This was done to ensure accurate representations of the individual components of the physical turf. The effect of pre-conditioning the physical turf via compaction was also incorporated in the model and validated, a step that was critical to the model capturing the response of the physical turf.
Experimental testing methods
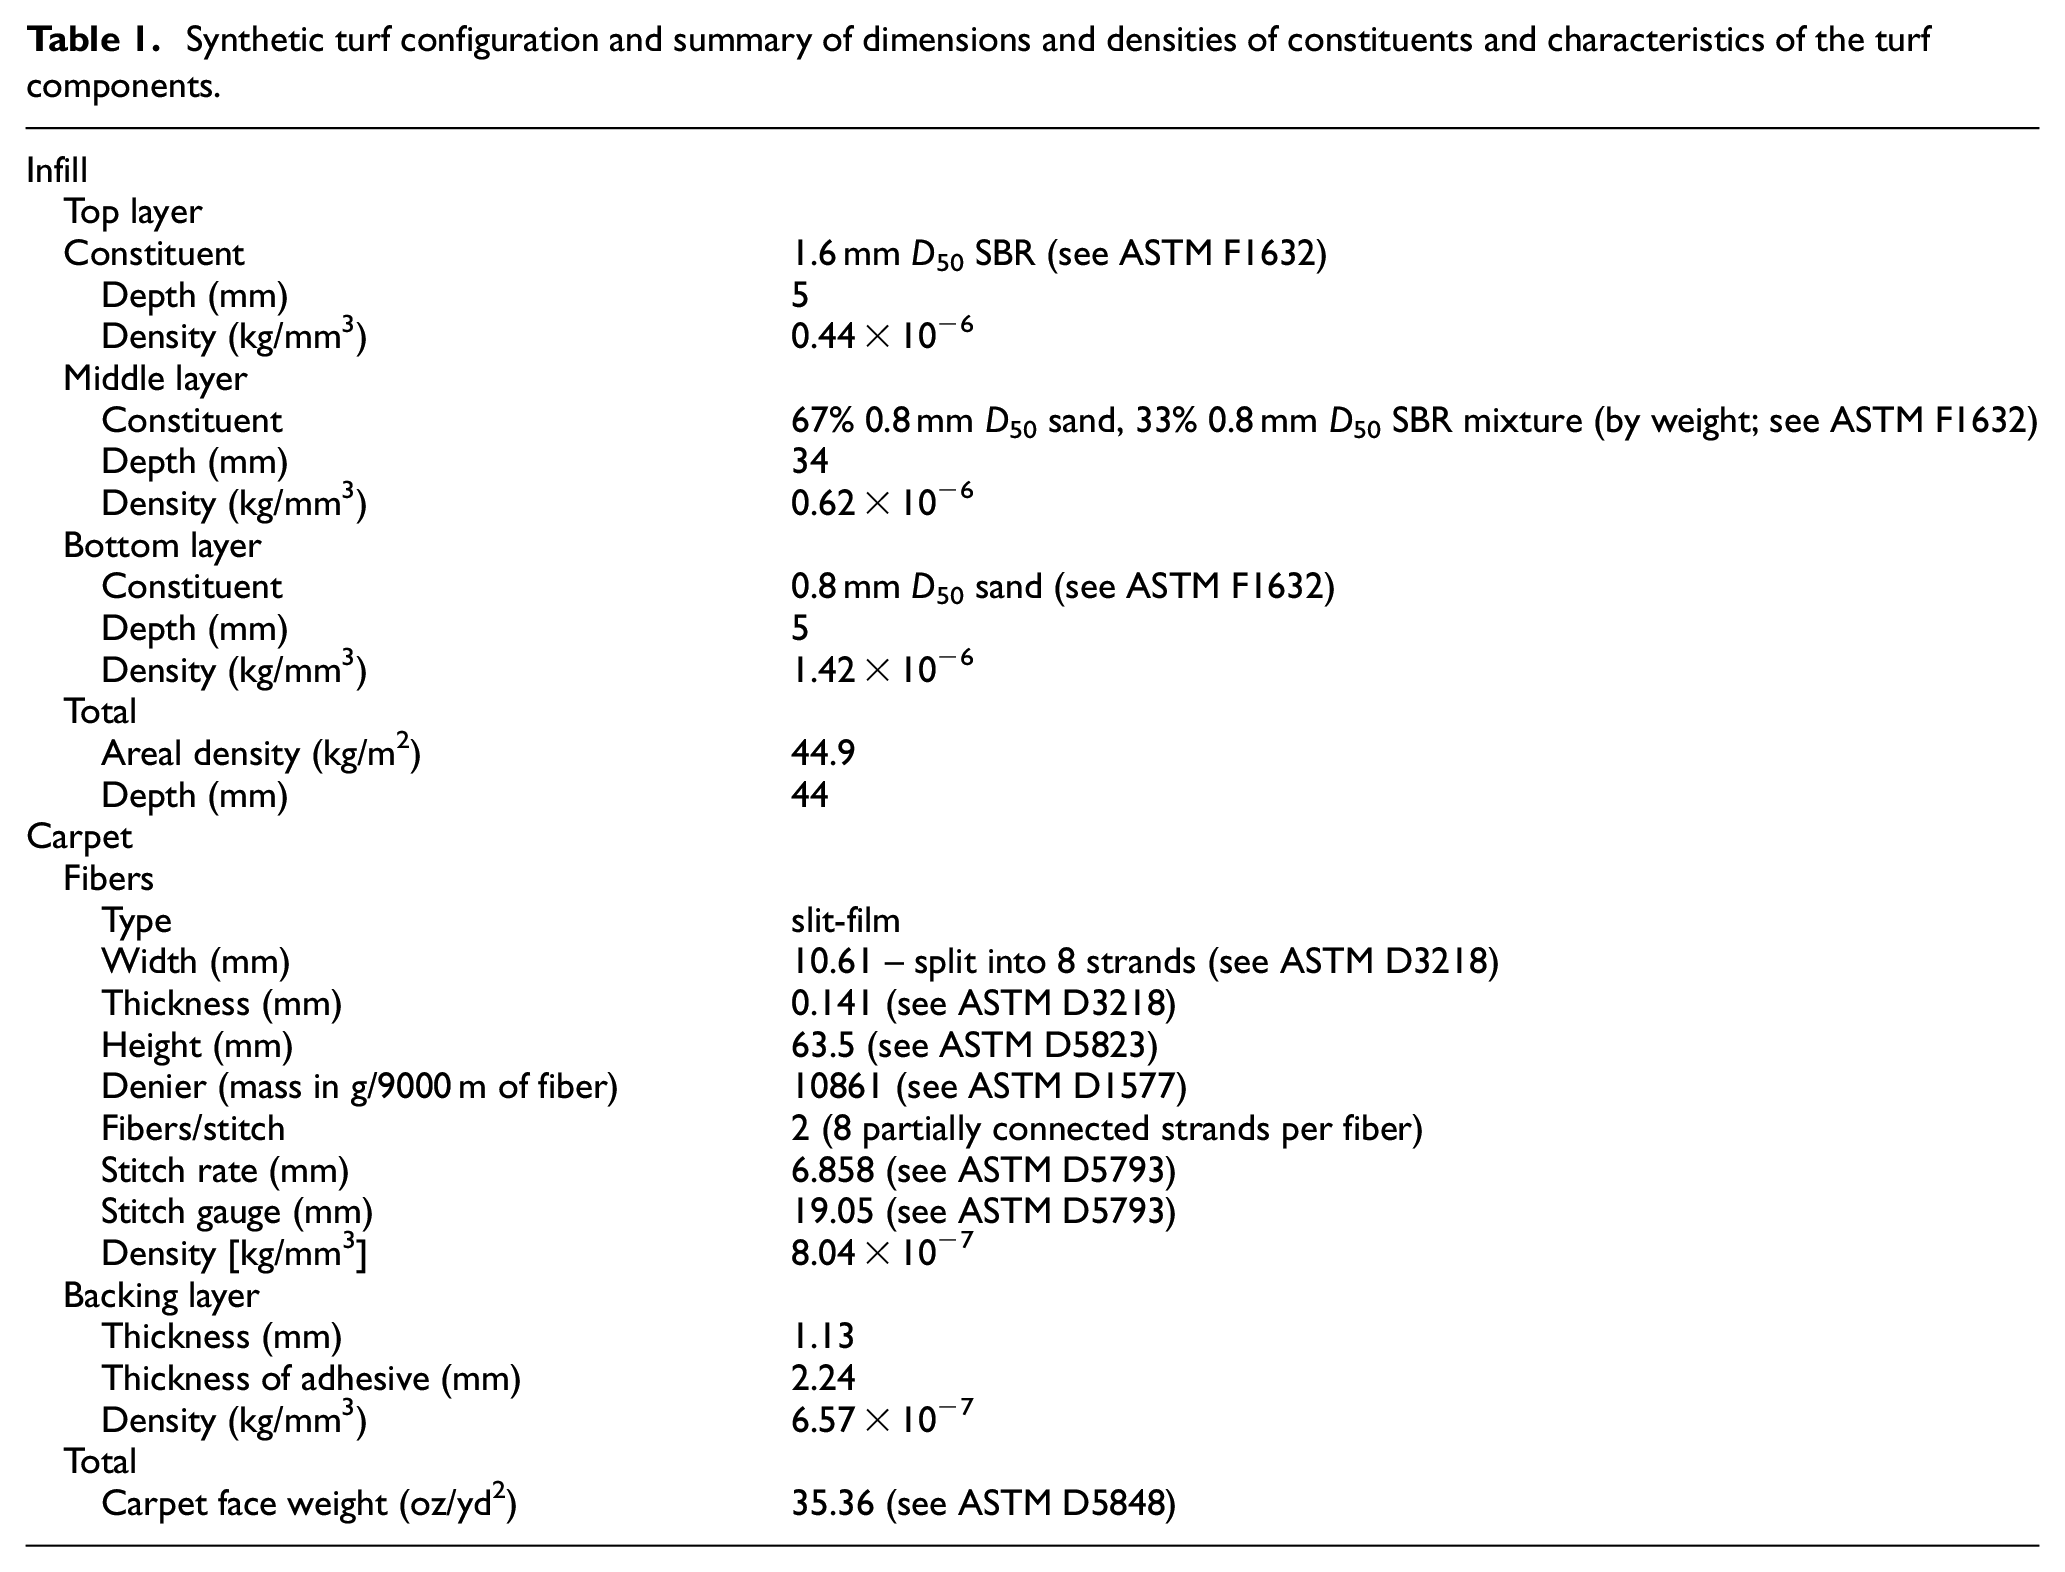
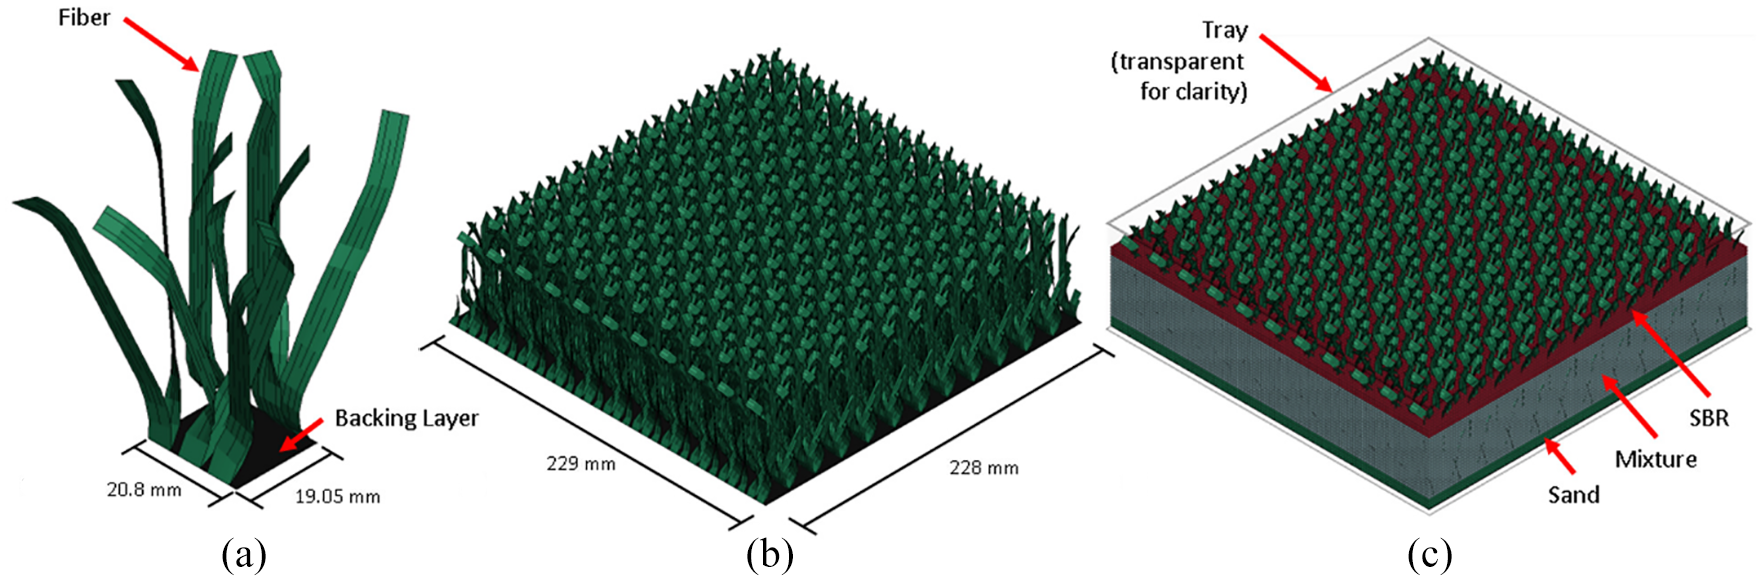
New carpet (fibers and backing layer) and infill materials from a typical 3G synthetic turf used in National Football League (NFL) game fields4,21 were used for the turf construction throughout this study (Table 1, Figure 2). The average fiber strand width, length, and thickness dimensions were measured from a set of specimens extracted from the carpet, and their average densities were calculated. The infill consisted of three different layers of infill, characterized in a previous study. 20
Synthetic turf configuration and summary of dimensions and densities of constituents and characteristics of the turf components.
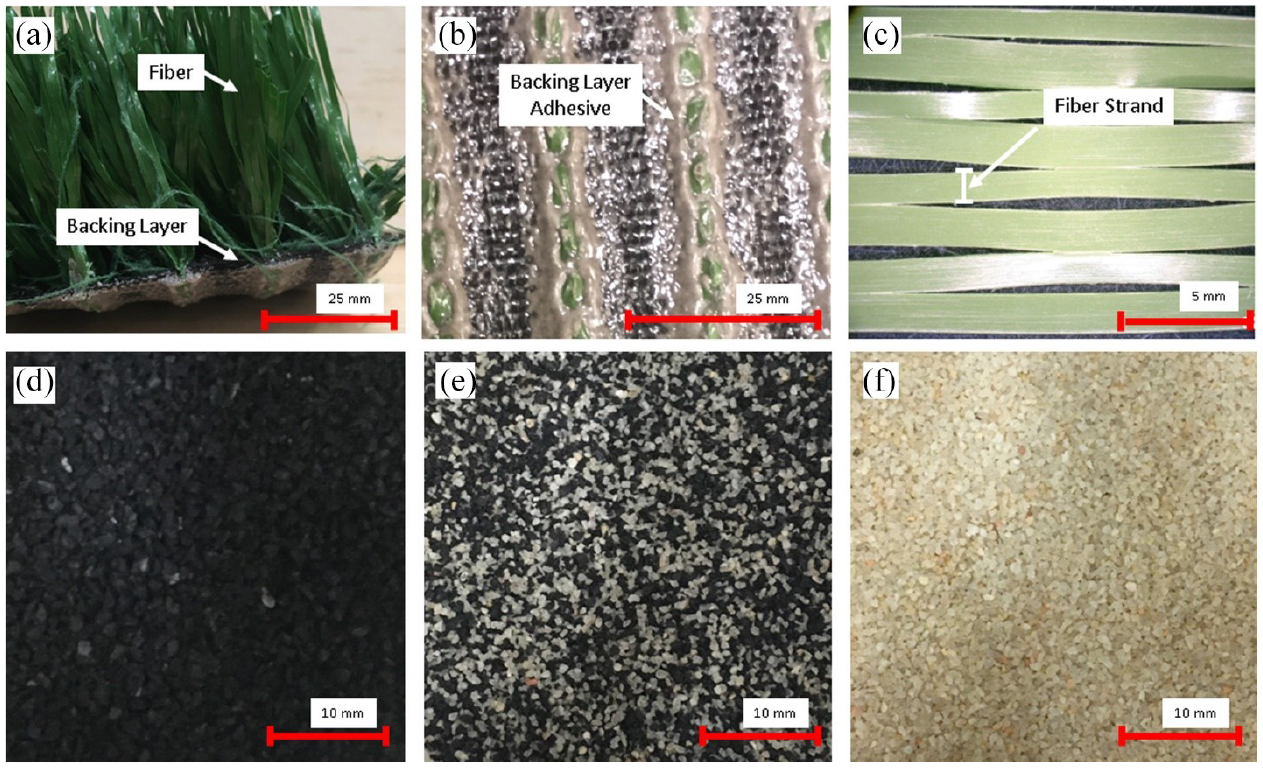
(a) Turf constituent materials comprising slit-film fibers and backing layer material, (b) with adhesive on the underside of the fiber stitching, (c) individual fiber strands within fiber, (d) SBR infill, (e) SBR-sand mixture infill, and (f) sand infill.
Synthetic turf construction and pre-conditioning
Carpet was placed in an 863 mm by 1449 mm tray 22 with the backing edges clamped onto the base of the tray and the fibers brushed upright with a power broom. The infills (sand, then mixture, then SBR) were deposited onto the carpet, taking care to ensure that the particles fell between the fibers. When half of the mixture infill was deposited, a weighted cylindrical studded roller was rolled on the surface for 20 passes to ensure any air voids or gaps were filled with infill, particularly voids that may occur near the base of the fibers. The fibers were then straightened with a push broom and infill depositing continued. Once the specified level of infill was achieved, the turf was rolled a second time (300 roller passes) to compact the infill uniformly. Lastly, the turf surface was lightly brushed to straighten the surface fibers, completing the turf construction. The compaction of the infill resulting from the rolling was measured to be 6 mm for this turf, resulting in a final infill depth of 44 mm. Turf samples that were not rolled the second time were termed unconditioned turfs in this study.
Clegg Impact Testing
The first set of validation tests were impact tests using the Clegg device following ASTM F1702 (Figure 1(c)). The Clegg missile is a metal cylinder having a diameter of 50 mm, a length of 146.7 mm, and a mass of 2.25 kg, which is impacted into the turf with a velocity of 2.85 m/s. Tests were performed on pristine locations of both pre-conditioned and unconditioned turfs and acceleration histories of the missile were measured.
BEAST Testing
The turf was tested under translational and rotational modes of loading at two levels using the BEAST test apparatus, defined as reduced power translation (RPT), reduced power rotation (RPR), full power translation (FPT), and full power rotation (FPR; Table 2). The translation motion was achieved by fixing the cable end to the shaft and using the pneumatic piston to apply a force to the other end, dragging the shaft frame and shaft (which were locked together to prevent rotation) towards the piston (Figure 1(a)). For rotation, the motion was achieved by wrapping the cable around the shaft pully prior to testing (Figure 1(b)). When the cable force was applied by the piston, the shaft was free to rotate in the shaft frame (which was fixed to the loading frame to prevent translation). In all cases, the loading frame was allowed to translate vertically. Two different sets of top weights (98 kg for RPR, 180 kg for all other cases (Figure 1(a)) were used, which, when added to the mass of the remaining components (102 kg), provided the desired vertical preload.
Summary of BEAST loading cases.
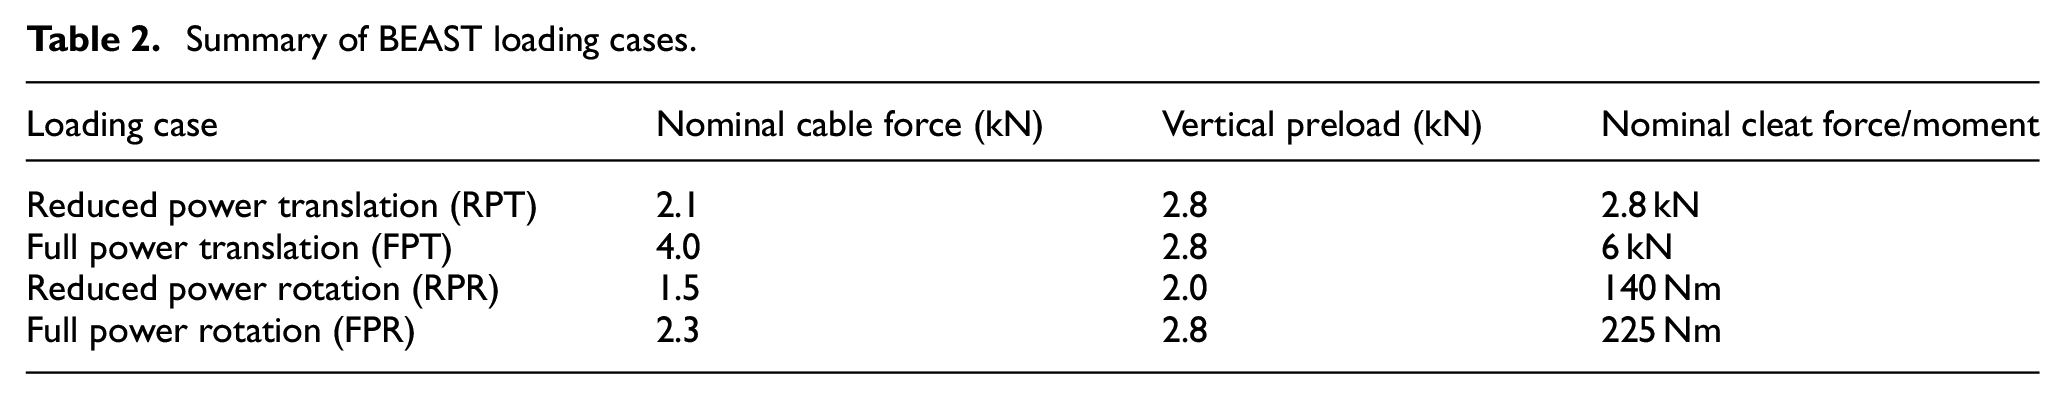
The nominal cable forces measured during the tests were dependent on the cleat-surface interaction; thus, the pneumatic firing pressures used for each case corresponded to cleat-form forces and moments that were measured in tests when the cleat-form was fully fixed (Table 2). 10 For each test case five repeat tests were conducted (20 total tests). In all cases, an aluminum cleat-form representing the forefoot of a contemporary American football cleat 22 was attached to the BEAST shaft to load the turf. A six-axis load cell between the cleat-form and shaft measured forces and moments. Displacement and rotation sensors located in the shaft frame measured vertical translation, horizontal translation, and axial rotation during loading.
Numerical model methods
Turf model construction and pre-conditioning
The geometry of the finite element model of the turf was created using a Representative Volume Element (RVE) approach (Figure 3). Both the fiber and backing layer were modeled using fully integrated thin shell elements (Figure 3(a)). An RVE representing a single repeating carpet unit was created and then propagated in both X and Y directions to construct a representative region of carpet (229 mm × 228 mm for rotation and Clegg models and 514 mm × 125 mm for translation) (Figure 3(b)). The fibers shared nodes with the backing layer where they attached in the physical carpet. Initial position and distribution of the fibers of the RVE were modeled to represent fiber fibrillation during construction of physical turf. The infill layers were added as SPH elements to their required depths (Figure 3(c)). The infill SPH element geometry was modeled with a pitch (spacing between SPH elements) of 2 mm, constant smoothing length of 1.42 mm, and a volume of 11.87 kg/mm3 (corresponding to a spherical volume for a radius of 1.42 mm). Finally, the carpet and SPH were combined inside a solid-element box with rigid walls to contain the turf during simulation.
(a) Carpet representative volume element (RVE) unit, (b) that was repeated to create turf carpet area, and(c) superposition of infill layers using smoothed particle hydrodynamics to complete the turf.
The infill material models and methods of modeling for the three infills considered in this study were obtained from Watson et al. 20 The material model used for all three infill materials was a pressure dependent soil constitutive model with a Drucker-Prager yield surface (*MAT_SOIL_AND_FOAM in LS-DYNA) (detailed in Appendix A). The fibers were modeled using a three-parameter linear viscoelastic material model (G1 = 0.061 GPa, G2 = 0.0663, G3 = 0.2, β1 = 0 s−1, β2 = 0.01, and β3 = 1.0) and the backing layer was modeled using an elastic material model (E = 0.2 GPa, ν = 0.01). The testing and verification modeling of the constituent components of the turf are discussed in detail in Appendix B. The model was solved using a commercial explicit finite element solver (LS-DYNA V12.0.0, Ansys, Canonsburg, PA, USA).
An important input parameter to the model was the friction between the fibers and infill. To determine this parameter the fiber pull-out tests were simulated and used to determine the friction parameters between the fibers and infill. Two simulations (Mixture and SBR) were undertaken by compressing the infill between rigid platens as in the experiments. The fibers were then pulled out by prescribing velocity on nodes outside the infill volume. Force history was measured from the fiber-infill contact in the pulling direction. Static friction, dynamic friction, and the decay constants were iterated to obtain comparable pull-out forces between the models the tests (0.44, 0.60, and 300, respectively, for fibers in SBR and 0.65, 1.60, and 300, respectively, for fibers in mixture, See Appendix C).
To simulate the pre-conditioning process performed on the sample turfs, which occurred within a timeframe of hours, a numerical method was developed and performed on the FE turf over a duration of 250 ms of simulation time (detailed in Appendix D). First, rigid discrete elements (spheres) were superimposed on the SPH infill elements, and the SPH elements were set to rigid (nondeforming) for the purpose of allowing the SPH elements to achieve compact stacking within the turf model. Then a horizontal rigid plane was displaced 6 mm downwards to compact the infill over a simulation duration of 110 ms. This 6 mm displacement matched the total measured amount of compaction in the physical turf due to rolling. The rigid plane was then displaced upwards away from the turf, followed by a settling phase with gravity at 1 g. Subsequently (140 ms), the DE elements were removed from the calculation, the SPH elements were converted to deformable with the appropriate soil material properties, and the whole turf model was allowed to equilibrate under gravity loading up to 250 ms of simulation time.
Clegg impact model
The missile for Clegg impact tests was modeled using a rigid material model with steel material properties (E = 207 GPa) (Figure 1(c)). The missile was integrated with the turf model (232 mm by 232 mm) and following pre-conditioning (at a simulation time of 250 ms), the missile impacted the turf with an initial velocity of 2.85 m/s, as described in ASTM F1702. The missile acceleration history was extracted. In addition to simulating impacts on pre-conditioned turf (Appendix D, Figure D1), impacts on unconditioned turf, where the pre-conditioning phase was skipped, were also simulated.
CORA analysis (v4.0.4, Partnership for Dummy Technology and Biomechanics, Ingolstadt, Germany) was performed on the extracted missile acceleration histories for comparison with the point-wise averages of the experimental tests. 23 All CORA parameters were kept as their default values except the interval of evaluation (T_MIN/T_MAX), which was defined to be the duration of the impact event, and the progression (G_V), size (G_G), and phase shift (G_P) weightings for the cross-correlation method, which were defined to 0.5, 0.5, and 0.0, respectively. The phase shift weight for the cross-correlation method was defined to be 0.0 because all simulations were synchronized to the starting point of the experimental test.
BEAST model
The BEAST apparatus was modeled using rigid bodies and beams (Figure 1(a)). The base frame was fixed in space and the loading frame (62.44 kg) was constrained to the base frame with a translation joint allowing only Z translation. Top weights (180 kg for FPT, RPT, FPR; 98 kg for RPR) were fixed to the loading frame and provided the correct vertical preload mass to the cleat-form using a 1 g body load. For the translation cases, the shaft frame (24.1 kg) was fixed to the loading frame with a translation joint allowing only X translation relative to the loading frame and the shaft (15.3 kg, inertia of 21500 kg-mm2) was fixed to the shaft frame. For the rotation cases, the shaft frame was fixed to the loading frame and the shaft was constrained to the shaft frame using a rotational joint that allowed Z rotation. The load cell and cleat-form (meshed with 5 mm shell elements) were affixed to the bottom of the shaft (Figure 1(b)). The turf model was located beneath the cleat-form with the tray fixed in space. The loading frame was lowered until the cleat-form reached the target depth (roughly 21 mm from the surface) at 140 ms to settle the cleat-form into the turf.
The cable, modeled using discrete beam elements (1.36 kg), was attached to the shaft in a manner mimicking the test configuration (attached directly to the shaft for translation and wrapped around the shaft pully for rotation). The opposite end of the cable was attached to the piston, to which a loading force was applied. In the tests, the cable load cell was mounted directly to the end of the pneumatic piston, meaning the load cell was accelerating relative to the ground. Consequently, the measured cable force was in a non-inertial frame of reference and the measured cable force could not be used to provide the model boundary condition. To obtain the cable force in the correct (inertial) frame of reference, tests were conducted for all four firing pressures where both the shaft frame and shaft were fixed, and the cable force was measured. By applying these cable forces from the fixed tests to the piston with the correct mass (11.1 kg) the translation models could be conducted with the cable loading in the correct frame of reference. For the rotation cases, the angular inertial forces generated by the rotation shaft (which are not present in the fixed tests) must also be accounted for by reducing the mass of the piston by subtracting the moment of inertia of the shaft divided by the squared radius of the pully (163.35 mm). By applying the fixed test cable force onto the piston with this “effective mass” (7.84 kg) the cable force from the fixed tests could be used as model boundary conditions in the correct frame of reference. The cable loading was initiated at 250 ms of simulation time, following the settling phase.
Outputs extracted from simulations were the cleat-form rotation and displacement, and the forces and moments at the load cell location. Similar to the turf model under Clegg loading, the turf responses under BEAST loading were compared to their corresponding averaged experimental data using CORA, using the same CORA parameters.
Results and discussion
Clegg impact testing and FE turf model validation
During the loading phase of the Clegg impact test, the infill directly under the missile was compacted, rather than experiencing large displacement or expulsion, due to the confinement effect of the fibers. Additionally, little lateral motion of the infill or turf surrounding the impact site was apparent due to the fiber confinement, leading to a relatively localized impact site. The peak acceleration exhibited a high degree of repeatability with a mean peak acceleration of 72.3 (±2.7) g and 53.1 (±3.7) g for pre-conditioned and unconditioned turf, respectively (Figure 4). After peak loading, the unloading acceleration of the missile exhibited a broadly symmetric slope, with rebound velocities of −1.42 (±0.07) m/s for the tests on the pre-conditioned turf and −1.25 (±0.08) m/s for the tests on the unconditioned turf.
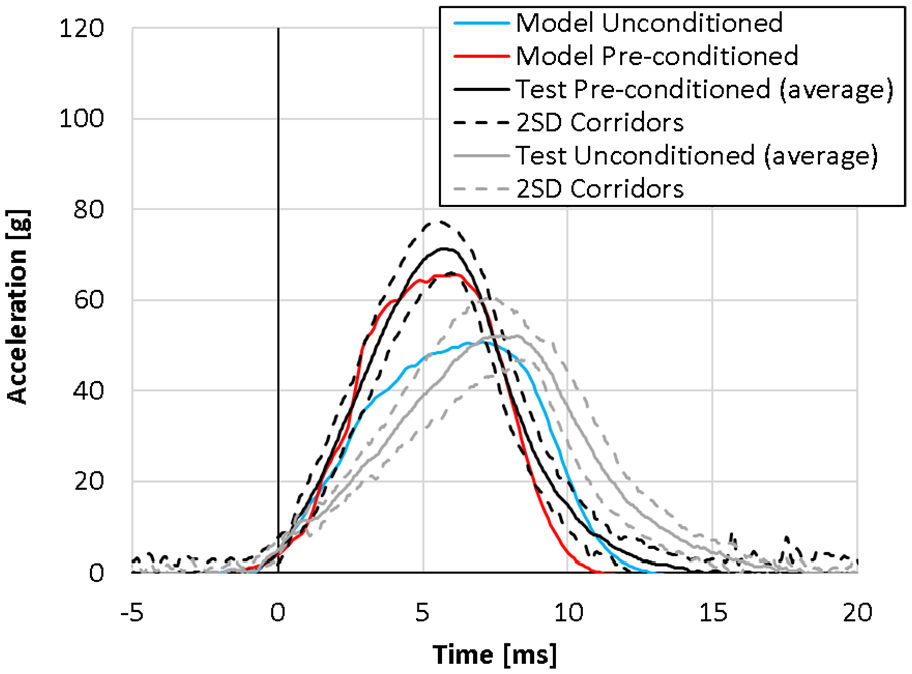
Experimental test averages and ± two standard deviations (2SD) corridors and validation results of Clegg impacts on unconditioned (N = 5) and pre-conditioned (N = 50) turfs.
The validation models exhibited similar local confinement around the impact site and resulted in peak accelerations of 65.6 and 50.6 g and rebound velocities of −0.83 and −0.67 m/s for the pre-conditioned and unconditioned turfs, respectively (Figure 4). The unconditioned turf simulation had a peak acceleration comparable to the tests while the pre-conditioned turf was within the lower bounds of the tests. The simulations followed the tests with slightly greater stiffness between 4 and 5 ms and lesser stiffness in unloading for both turf preparations. The differences between the rebound velocities between the models and test response were, in part, due to the model peak acceleration being lower than the test average. Additionally, no adjustment of the unloading response of the material model was undertaken because the model had limited options to define the unloading behavior of the infill. The validation cases captured differences between pre-conditioned and unconditioned turfs, demonstrating the model sensitivity to surface construction and maintenance of turf, which influences turf response. 1 Overall, the FE model demonstrated comparable results having CORA ratings of 0.964 and 0.914 for the pre-conditioned and unconditioned turfs, respectively.
BEAST testing and FE turf model validation
The experimental x-displacements and x-forces for the translation tests, and the z-rotations and z-moments for the rotation BEAST tests (Figure 5) were plotted with the model results to assess response to their correspondence in the primary loading directions (Figure 5). In addition, the z-displacement and z-force were measured to assess the response to the BEAST preloads.
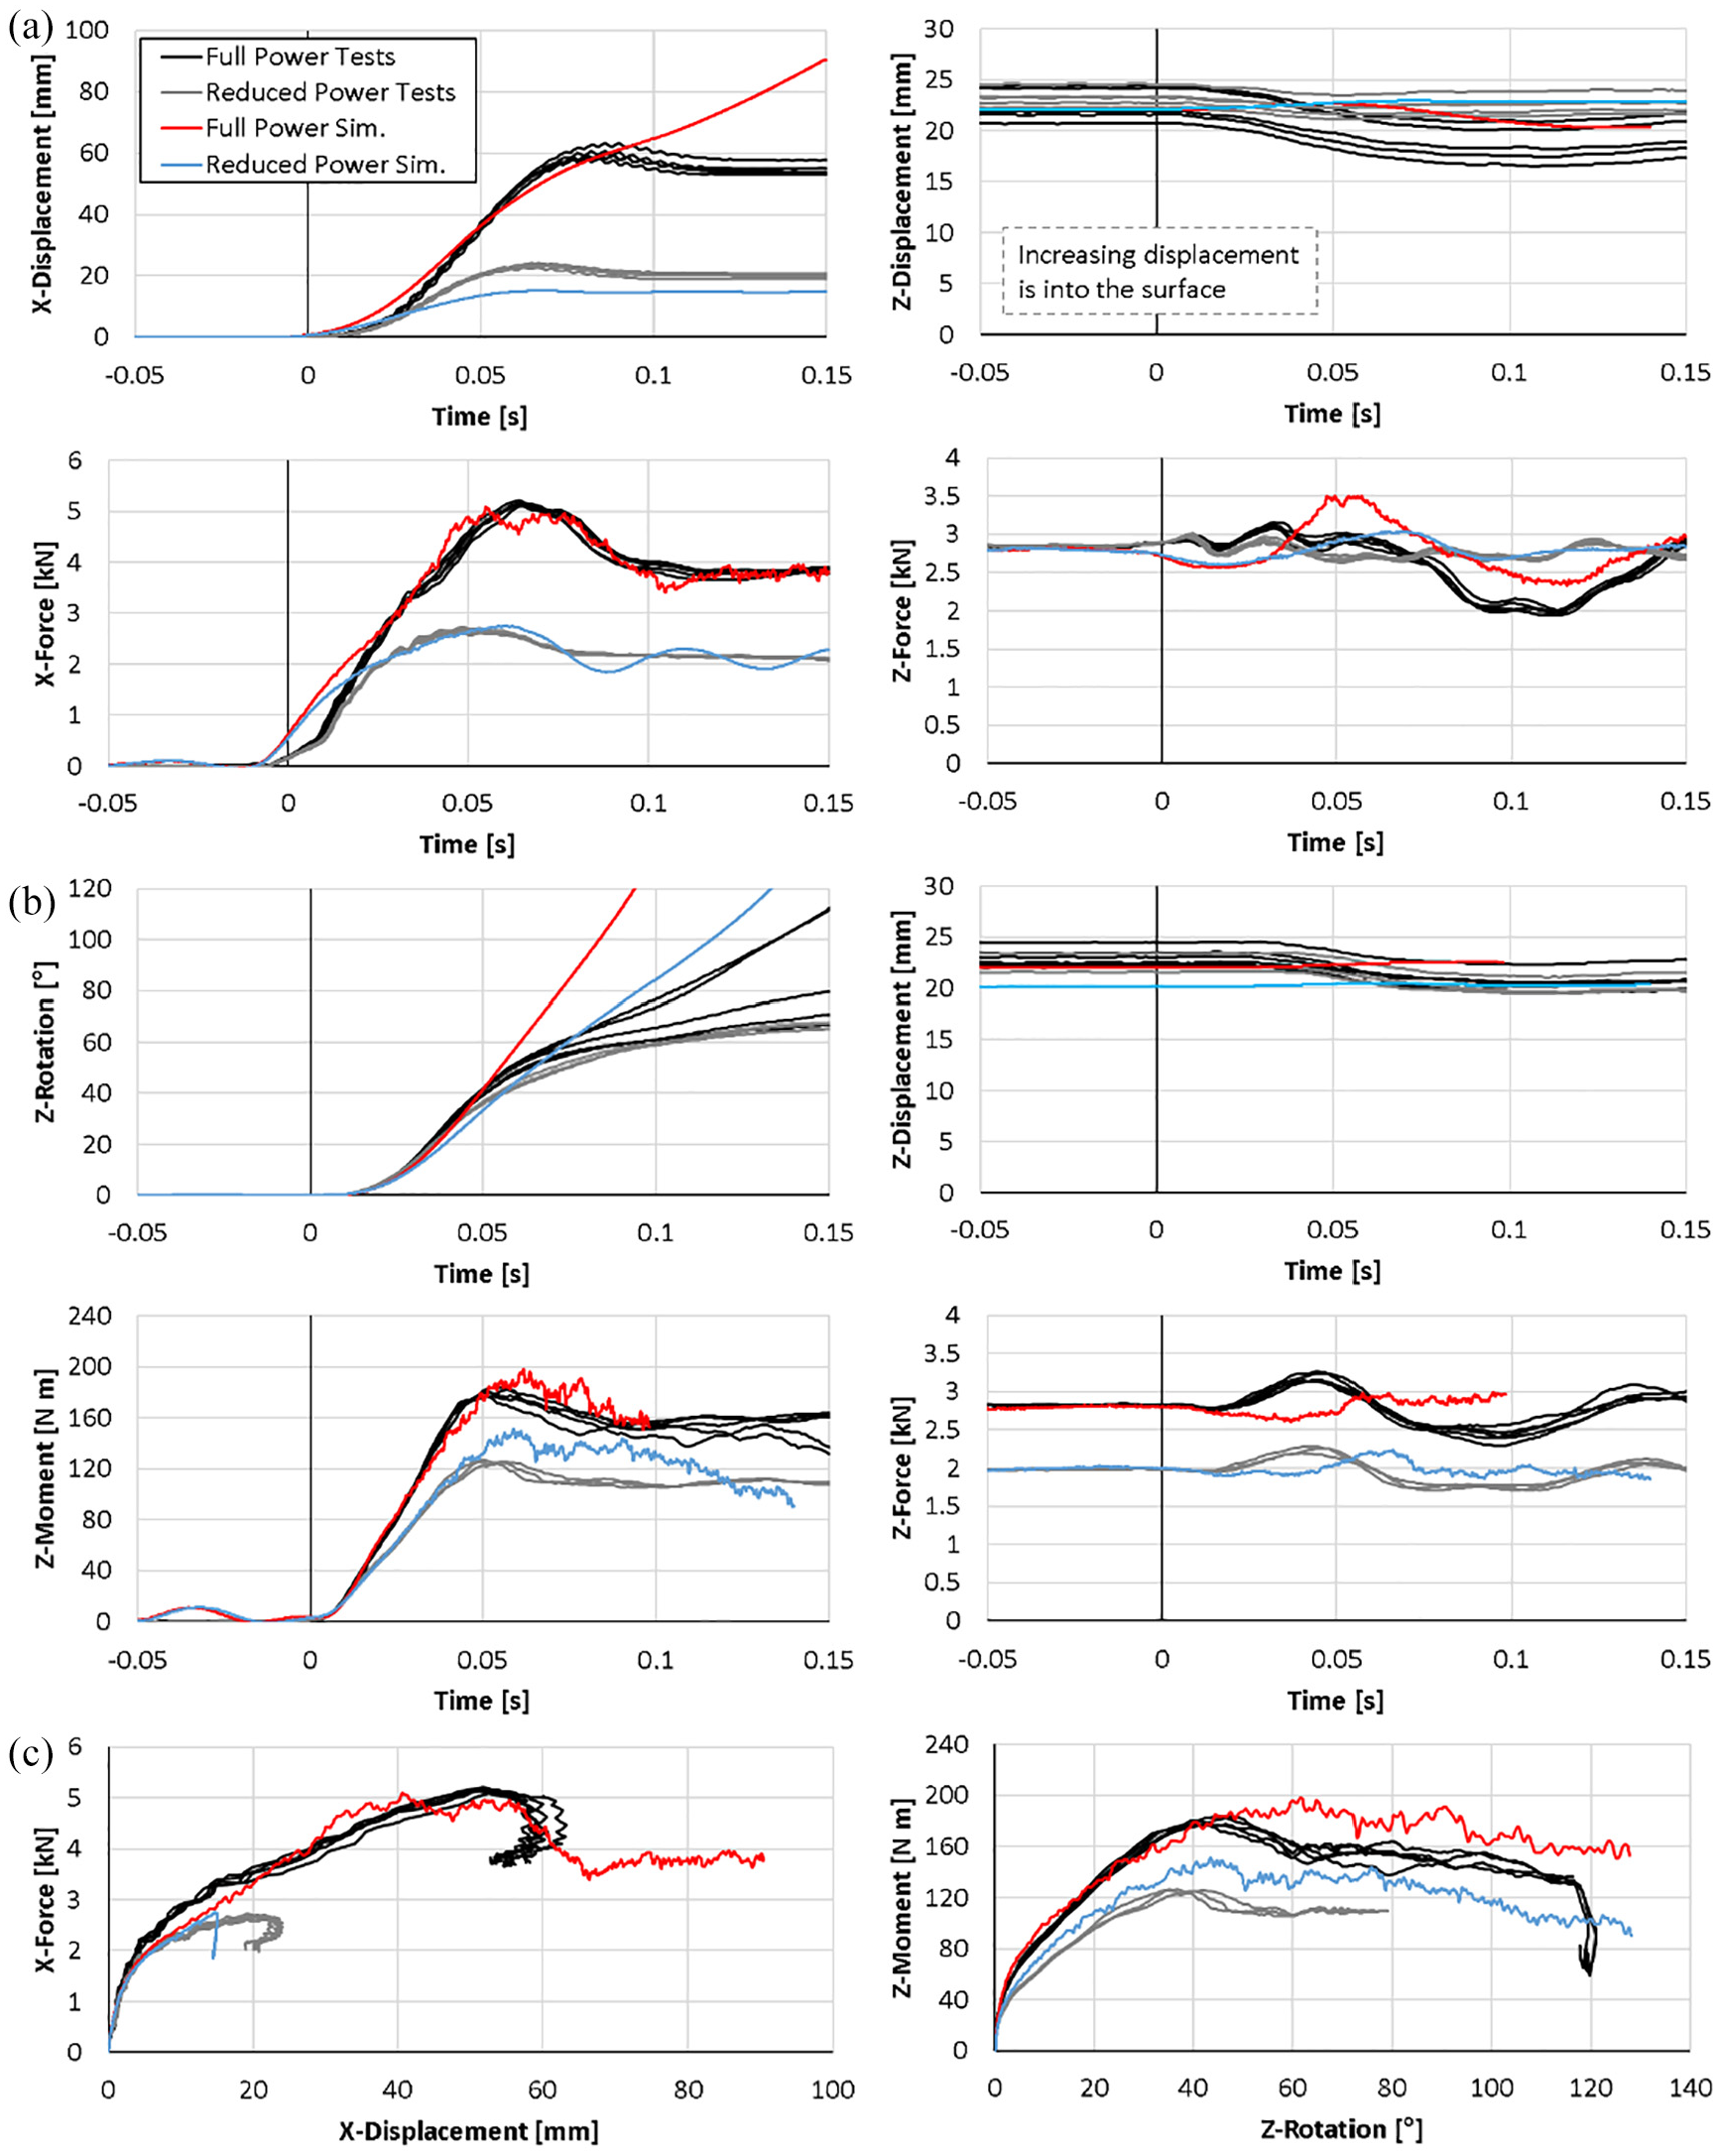
Experimental test averages and validation results of BEAST tests on pre-conditioned turf: (a) response measurements of the cleat-form in translation and (b) rotation, respectively, and (c) force-displacement (left) and moment-rotation (right) response for all BEAST tests.
The force-displacement measurements from the translation BEAST tests demonstrated similar bi-linear stiffness responses between power levels, both showing similar initial linear regions until 6 mm, but then a stiffer secondary linear region for the FP tests (Figure 5(c)). The measured forces from the translation tests peaked at 2.6 kN (RPT) and 5.0 kN (FPT) before declining (Figure 5(a)). During translation, the physical BEAST shaft frame accelerated before the cleat-form, producing a pitch forward of approximately 2° while in motion. Due to the location of the displacement sensor, a backwards displacement was measured from the un-pitching motion after the cleat-form was arrested (sticking) by the turf. For the translation tests, the cleat-form stuck at roughly 24 and 60 mm of displacement for RPT and FPT, respectively, before the shaft frame began its un-pitching motion.
The rotation BEAST tests also yielded similar bi-linear responses with the FPR case yielding a stiffer secondary linear region than the RPR tests (Figure 5(c)). The rotation tests peaked at 120 N · m (RPR) and 180 N · m (FPR) before stiffness declined (Figure 5(b)). The rotation tests did not exhibit sticking nor pitching, and the cleat-form rotation slowed after approximately 0.05 s.
All validation simulations were completed for the total event duration without any errors. The pre-conditioning and settling phases of the turf model proved effective in re-creating the initial state of the physical tests within a short duration (250 ms; Figure 6). Both the simulations and tests displayed infill material expulsion, where the expelled SPH elements were deactivated to increase computational efficiency. The carpet in the model also demonstrated comparable gross deformation to the tests. The fibers realigned in the direction of the cleat-form motion, and for the translation tests, the carpet lifted slightly in the region behind the cleat-form, due to fiber tension (Figure 6). The rotation simulations and experimental tests did not demonstrate lifting of the carpet, which may be due to the twisting deformation of fibers. At regions where tension was expected to be prominent, such as the edges of the cleat-form away from the axis of rotation, the fibers did not remain beneath the cleat long enough to generate the tension necessary to lift the carpet.
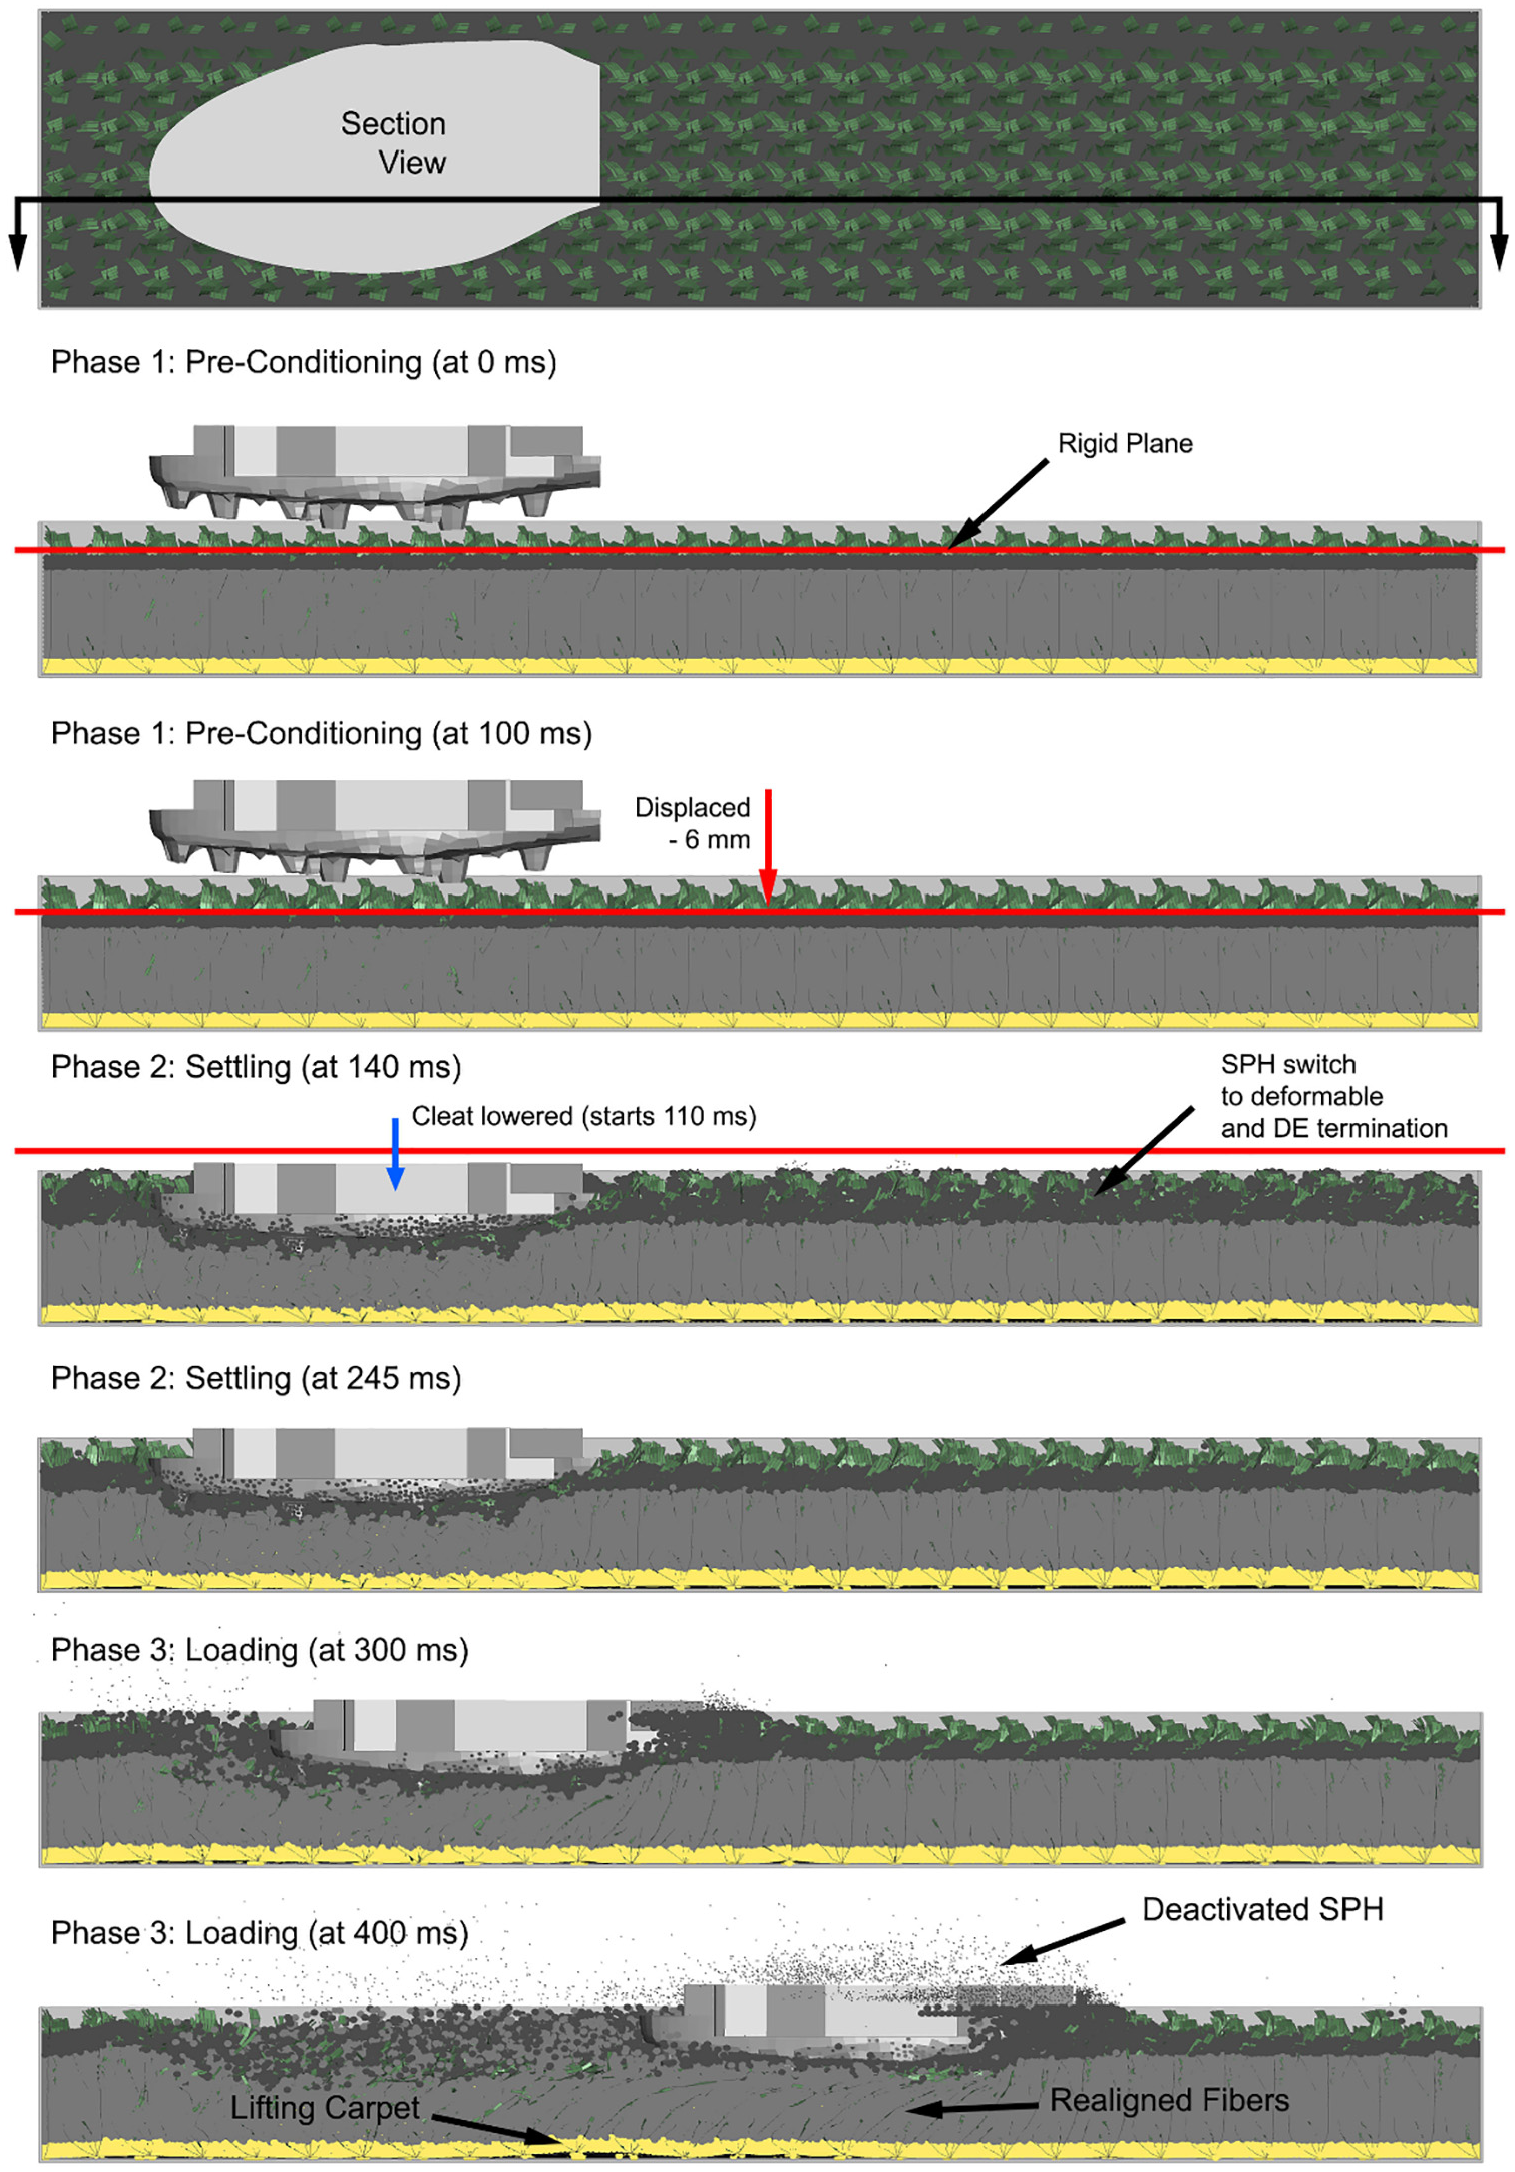
Critical stages in BEAST full power translation validation case on pre-conditioned turf.
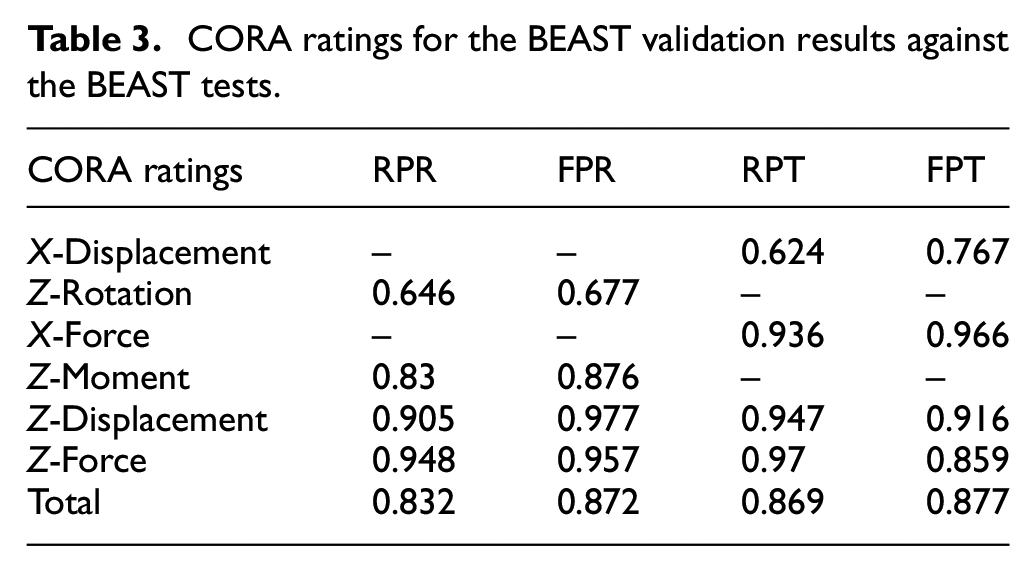
Overall, the peak forces for the translation simulations were comparable at 2.85 kN (RPT) and 5.3 kN (FPT) versus 2.6 kN (RPT) and 5.0 kN (FPT) for the experiments, respectively. The rotation simulations resulted in greater peak moments of 151 N · m (RPR) and 198 N · m (FPR) versus 120 N · m (RPR) and 180 N · m (FPR) for the experiments, respectively (Figure 5). The CORA ratings for the measured responses between the simulations and experimental tests were calculated (Table 3). The overall total ratings for the four BEAST cases ranged between 0.832 and 0.877, which is considered a good correlation. When equally weighing the two Clegg cases and four BEAST cases, the average CORA rating of the FE model was 0.888.
CORA ratings for the BEAST validation results against the BEAST tests.
There were some differences noted between the model and the experiments for the translation load cases. The model yielded stiffer responses compared to the tests, except for the FPT tests. The differences between the RPT and FPT simulations and tests may be attributed to the compliance of the physical BEAST apparatus compared to the BEAST FE model. The pitching of the physical apparatus was associated with increased pressure beneath the leading half of the cleat-form. Pitching was not implemented in the BEAST computational model due to the uncertain position of the pitching axis during translation. The lack of pitching in the model resulted in lower pressures beneath the cleat-form and greater cleat displacements compared to the tests. A lack of pitching could also lead to a reduction in z-force resulting in a change of cleat-form z-displacement by roughly 1 mm into the surface.
Both the RPR and FPR simulations demonstrated good agreement with the tests until 0.05 s, after which the model z-rotation and z-moment continued to increase (Figure 5(b)). The z-forces were underpredicted in the simulation and increased just before 0.05 s. Similar to the translation simulations, the cleat-form had a change in z-displacement by roughly 1 mm into the surface.
The physical turfs exhibited a complex distribution of individual fiber strands that was approximated in the FE model using the RVE approach. Investigation on the effects of fiber distribution is planned for a future study. Some differences may be due to the use of a continuum SPH approach to model the infill. The SPH infill produced the expected pressure distributions beneath the cleat-form for non-pitching motion. However, the overlapping nature of the SPH elements results in a radius of influence. This overlapping radius of influence does not exist in physical infill, which have small grains that influence each other at their surfaces. The SPH pitch size of 2 mm with a smoothing length of 1.42 mm used in the current study has an overlap of roughly 0.42 mm. Albeit small, the overlap in the model would typically result in larger volumes of deformed infill. Additionally, the unloading behavior of the infill material model may lead to underpredictions for the complex loading conditions that are modeled where multiple types of loading are occurring sequentially.
Lastly, some differences may also be due to loading velocity and the rate effects on the fiber-infill interaction. Although the friction interaction between the fiber and infill were measured and verified (Appendix C) up to 10 mm/s, greater velocities and normal forces may occur in load cases, requiring further investigation.
FE model discussion
The Clegg and BEAST validation simulations presented runtimes of about 50 h for the 400 ms simulation time. The main limitation of the turf model was balancing computational efficiency with fidelity. The scope of the full turf model was to predict response under the BEAST apparatus loading; thus, enhancements were made for that scope, such as using rigid parts for the BEAST model and minimizing the number of elements. Although computational efficiency was a priority, all assumptions made were verified to ensure fidelity was not sacrificed. The runtime criteria existed to ensure fast turnaround for design exploration. Future improvements to the model can be made to further increase fidelity without sacrificing runtime.
To improve runtime, the SPH pitch and element size were increased, and smoothing length decreased from those reported by Watson et al. 20 Watson et al. reported that there was little pitch and size dependence for the infill in direct shear and compression. Two finer infill meshes were investigated, yielding comparable responses; however, runtime increased by 15,300% for the smallest elements. It should be noted that a pure DE approach was also investigated during preliminary stages of the development but had limited material models available and a 300% greater runtime than SPH, a similar finding reported by Rittenhouse. 19
The motivation of starting the turf simulations with nondeformable SPH and then switching to deformable SPH was due to preloads, such as the rigid plane and cleat-form, causing premature infill yielding that reduced turf stiffness during primary loading. Yielding without self-healing was a limitation of the soil model implementation. 24 To alleviate this premature yielding, the SPH was made nondeformable to bypass the soil model yielding criterion while conserving strain history. When the SPH became deformable, the material was initiated and behaved in accordance with the constitutive model. The use of DE elements with coincident nodes to the SPH was due to the lack of volume for nondeformable SPH. The DE elements were used to provide volume for the SPH until the SPH became deformable. The turf stress state before the loading phase was verified with comparisons of measured surface hardness tests and pressures under the cleat-form.
A further consequence of the scope and loading cases intended for the model, was a focus on the macro-scale of the model response. Although the model was demonstrated to be fidelic in the loading cases of interest, local response measurements in the micro-scale, such as single infill particle to fiber contact, may have reduced accuracy. The SPH continuum approach of infill modeling was limited in predictions involving particle interlocking characteristics and geometrical features; although their effects would be incorporated in the test measurements performed by Watson et al. 20 Such limitations were minimized through the systematic bottom-up approach of developing the turf constituents separately and verifying their interactions before assembly. Investigation on the effects of infill factors such as rigidity and geometric effects is planned for future studies.
Conclusions
In this study, a third-generation turf surface was modeled using a bottom-up approach that tested the turf constituents separately and then validated with system-level tests. The turf model incorporated infill modeled as an SPH continuum and carpet modeled using thin shell elements. The pull-out force from complex interaction of fibers and infill under compression were measured showing increased force with pull-out rate. This trend was true for both SBR-only and a mixture of SBR and sand infills.
It was demonstrated that the process of switching SPH from nondeformable to deformable was effective in preventing premature yielding in the pressure dependent soils constitutive model utilized. The outlined methodology for pre-conditioning the turf model within the simulation showed that the turf is sensitive to changes in its preparation, consistent with observations in the physical tests. The model had efficacy in capturing the response of the physical tests, along with the increase in stiffness observed in both compression (Clegg) and shear (BEAST) loading. Overall, the methods presented in this study showed efficacy in the development of a FE turf model using a systematic bottom-up approach and provided a novel tool for contributing to the limited understanding of numerical modeling of turf surfaces.
Footnotes
Appendix A: Infill characterization testing and verification modeling
The three infill constituents (SBR, mixture, and sand) were each tested under confined compression (ASTM D2435) and direct shear (ASTM D3080) testing to obtain the pressure-volumetric strain response and shear failure response, respectively, as described in detail in Watson et al. 20 The confined compression testing was conducted by filling a 53.5 mm inner diameter steel ring with 12.7 mm of infill and compressing the infill at 1 mm/s. After pre-conditioning the infill by loading to 1500 N and unloading, four loading cycles were then conducted on each infill specimen before the infill was discarded. A total of 12 loading cycles were tested for each of the SBR, mixture and sand constituents with the force (f) and displacement (d) being measured for each test.
The shear response of the infill was measured using a direct shear test machine (Model 2001-D, Karol Werner, Powel, OH, USA) with a 50 mm × 50 mm square shear box. In each test, 19.5 mm of infill was placed in the shear box and loaded laterally at 0.1 mm/s. Preloads of 100, 200, and 300 kPa were used, which corresponded to roughly 50%, 100%, and 150% of the nominal pressure under the cleat-form used for BEAST testing when the turf was loaded at 2.8 kN. For each loading condition, five test repeats were conducted. For each test, the force and lateral displacement were measured.
Due to the soil-like behavior of the infill materials, a pressure dependent soils constitutive model with a Drucker-Prager yield surface was chosen to represent the infill in the turf model (*MAT_SOIL_ AND_FOAM in LS-DYNA). The force-displacement responses of the confined compression tests were converted into pressure (p)-volumetric strain (ε Vol ) using:
and
where A was the area of the confinement ring and h was the initial height of the infill prior to testing.
In the direct shear tests, the yield force (vYield) was defined as the force at 12% shear strain (see Watson et al. 20 ), leading to a yield function defined by:
where A was the area of the shear box, pNormal was the applied preload and a and b were yield parameters used in the material model (Table A1). Additionally, the shear moduli of the materials were defined by performing a least squared fit to the initial 0.02 mm/mm shear strain of the 100 kPa preload direct shear results.
Verification models were developed which used the same SPH parameters that were used in the full-scale turf models contained in rigid geometry representing the confined compression and direct shear test equipment, with loading applied to mimic the test response.
In both confined compression and direct shear, a progression from a stiffer sand response to a softer SBR response was apparent, with the mixture infill lying between the two responses (Figure A1). The models capture the test response well but as discussed in Watson et al., 20 the friction between the infill and shear box for the sand direct shear tests (Figure A1(b–d)) lead to higher shear forces in the model than tests. Due to the placement of the thin sand layer (5 mm) in the full turf construction at the base of the turf, which is generally not disturbed by the cleat, this overprediction of shear force was not of concern for the current study. Furthermore, the high degree of compressibility of the mixture compared to the shear modulus, led to the mixture model overpredicting the force in the early portion of the confined compression response (Figure A2(a)) although, more importantly, the consolidation response above roughly 300 N is well captured by the model.
Appendix B: Carpet component characterization testing and verification modeling
Individual strands of the slit-film fibers were extracted for tension testing. The strands were tested at three nominal deformation rates (0.1, 1.0, and 27 s−1) with three repeats per rate. Markers (1 mm) were applied to the top and bottom of the strands for all tests and the videos were tracked with software (Tracker v4.9.8, Open-Source Physics, Davidson, North Carolina, United States) to confirm the strain and loading strain rate. The 0.1 (60 Hz sampling) and 1.0 s−1 (600 Hz sampling) tension tests were conducted on a hydraulic frame, which was outfitted with a load cell (2.2 kN LC412-500, Omega) and recorded (USB-6211, National Instruments; Flex Test SE controller, MTS, Eden Prairie, Minnesota, United States). Test videos were captured using a DSLR camera (D3200, Nikon; 60 fps 1080p; 105 mm f/2.8 EX DG OS Macro lens, Sigma, Kawasaki, Japan). The 27 s−1 tests were performed on a hydraulic test frame outfitted with a load cell (9314B, Kistler) that recorded (USB-2651, National Instruments) at a sampling rate of 20,000 Hz. High speed videos were taken using a high-speed camera (FASTCAM SA5 Model 1300K-M1, Photron, at 20,000 fps 50,000 DPI with a 105 mm f/2.8 EX DG OS Macro lens, Sigma, Kawasaki, Japan).
To measure the stress-strain response of the backing layer, test specimens were extracted along the length of the carpet (16 mm × 38 mm, fiber stitch running parallel to the length of the specimen) and transverse to the length of the carpet (21 mm by 38 mm, fiber stitch running perpendicular to the length of the specimen). The backing layer was tested with the adhesive securing the fibers kept in-place because it was integrated to the structure of this specific carpet. The backing layer was tested at a deformation rate of 0.1 s−1 in tension with three repeats each, using the same test setup as the 0.1 s−1 fiber tests. It was later confirmed that this rate was representative for the backing layer in the BEAST validation tests.
Verification models for both the fiber and backing layer were created by meshing the material using 3 mm shell elements (1.3 mm across the fiber width) with one end fixed in space and a prescribed displacement applied to the other end at the appropriate loading rate to match the experiments. Both models were assigned the proper nominal thicknesses (Table 1) and meshed using fully integrated shell elements with three integration points through-thickness. A three-term linear viscoelastic material model was used to model fiber response, with the G and β terms optimized based on the test response. A linear elastic material model with a Young’s modulus of 0.2 GPa and a Poisson’s ratio of 0.01 was used to represent the backing layer’s material response. The boundary force required to load the specimen and the nodal displacements were output and converted to engineering stress-strain to compare to the test data.
The fiber tensile tests demonstrated a non-linear stress-strain response and increasing stiffness with strain rate (Figure B1(a)). The 0.1 and 1.0 s−1 tests yielded at 0.44 strain (17.5 mm) before failing after 0.63 strain (25 mm). A single 27 s−1 test yielded at 0.30 strain (8 mm) before failing at 0.45 strain (11 mm), and the other two repeat tests failed before 0.30 strain. The fiber was modeled as a linear viscoelastic material with shear relaxation and decay constants (G1 = 0.061 GPa, G2 = 0.0663, G3 = 0.2, β1 = 0 s−1, β2 = 0.01, and β3 = 1.0). Fiber failure was modeled using a maximum principal strain criterion of 0.40, although localization of the strain led to different apparent failure strains for the entire fiber strand. Using a point-wise average of the stress response to compare to the model, r2 values of 0.98 and 0.97 were obtained with the model fit at 0.1 and 1.0 s−1, respectively. The oscillatory behavior of the high-rate test response led to a somewhat lower r2 of 0.79.
The backing layer tensile tests demonstrated mostly linear behavior at low strains for both the parallel and perpendicular specimens, which failed at average strains of 0.28 and 0.29, respectively (Figure B1(b)). Non-linearity at high strains was attributed to incremental yielding of individual weave strands throughout the tests. Failure was not implemented in the backing layer because it was not expected nor observed during the full turf tests. Verification of the simulations resulted in comparable results to the tests with r2 values of 0.96 between the model and the pointwise average of the parallel tests and 0.92 for the perpendicular tests.
Appendix C: Fiber-infill pull-out testing and verification modeling
To measure the friction parameters between the fibers and infill, pull-out tests were performed on the SBR and mixture infill materials (Table 1) using a hydraulic test frame equipped with a load cell (2.2 kN LC412-500, Omega, Norwalk, Connecticut, United States) and recorded (USB-6211, National Instruments; Flex Test SE controller, MTS). 25 Single fibers were placed within the infill between two platens (Figure C1). A screw system was used to generate static preload on the infill and the fiber was pulled through the infill. The force versus displacement of the fiber was recorded (30 Hz) and the maximum pull-out force was determined from the test.
Models of the pull-out tests were created to determine the parameters necessary to define the coefficient of friction (µ)
between the infill and fibers via inverse modeling where fS and fD are the coefficients of static friction and dynamic friction, respectively, DC is the friction decay constant and vRel is the relative velocity between the sliding surfaces. The infills were compressed by rigid platens using the prescribed normal force and then the fibers were pulled out by prescribing velocity on nodes outside the infill volume. Force history was measured from the fiber-infill contact in the pulling direction. Static friction, dynamic friction, and the decay constants were iterated to obtain a model response which matched the peak force measured during testing.
All fiber pull-out tests demonstrated greater maximum force at 10 mm/s compared to 1 mm/s (Figure C2). The tests demonstrated complex fiber-infill interaction that included sticking, slipping, and gripping. At the same time, the infill particles were able to shear against each other, yield, and realign resulting in an increased resistance to fiber motion. Therefore, the friction parameters of the model should be understood as parameters for modeling the complex interactions rather than typical friction. The model coefficients of static friction, dynamic friction, and decay constants used for fiber in SBR were 0.44, 0.60, and 300, respectively, and 0.65, 1.60, and 300 for fiber in mixture. The verification simulations yielded maximum pull-out forces that were within the variability of the test data with -2% to 8% differences between the model results and test average, demonstrating acceptable fiber-infill interaction.
Appendix D: Simulation timelines for turf models
Acknowledgements
The authors would like to express thanks to Biocore LLC for their support of this research. Additionally, research presented in this paper was supported in part by the National Football League and the National Football League Players Association. The views expressed are solely those of the authors and do not represent those of the NFLPA, the NFL, or any of these organizations’ affiliates.
Declaration of conflicting interests
The author(s) declared no potential conflicts of interest with respect to the research, authorship, and/or publication of this article.
Funding
The author(s) received no financial support for the research, authorship, and/or publication of this article.