
Abstract
Strength asymmetry can be detrimental to athlete performance and may lead to injury. The countermovement jump (CMJ) can be used to measure strength asymmetry via shear force production. The reliability of parameters and effects of asymmetry and shear force production on vertical CMJ performance were evaluated in a study with 15 university-level sprint and high jump athletes (m = 11, f = 4). The athletes performed three CMJs on two occasions, separated by 1 week. Tri-axial ground reaction force (GRF) was recorded using two force platforms embedded within a bespoke weight training area. Key performance metrics were calculated in real-time describing total CMJ performance, asymmetry and shear force production. Changes in the means and coefficients of variation (CV) were used to express reliability. Twenty-six parameters from the Total analysis and 21 Asymmetry analysis parameters showed a CV lower than 10%. Temporal and kinetic variables describing Asymmetry analysis highlight a lower CV compared with equivalent parameters derived from Total analysis. Shear parameters show high levels of CV compared with Total analysis and Asymmetry analysis. The measures of asymmetry calculated using methods described in this work were shown to be reliable for monitoring CMJ performance. No significant negative relationships were found between measures of asymmetry or shear force and traditional performance metrics in the CMJ (e.g. jump height, specific peak power and peak force). Further work is required to identify the potential of reducing asymmetry on CMJ performance.
Introduction
The countermovement jump (CMJ) test has been used extensively for performance monitoring in athletics. CMJ is a plyometric activity, defined as exercises with rapid deceleration-acceleration phases, such as jumping 1 and an athlete’s performance of CMJs has been shown to correlate positively with sprint performance at various distances (e.g. 5, 10, 30 and 100 m).2–5 The CMJ has also been used to determine the efficacy of training interventions.6–8 Furthermore, the CMJ can be used to measure strength asymmetry, which is considered detrimental to sporting performance 9 and may lead to injury. 10
Force platforms are commonly used to measure CMJ performance6,11,12 and have been found to be a reliable measure of capability compared with inertial measurement units. 13 A large number of kinetic and kinematic variables can be derived using the ground reaction force, however, it is unclear as to which variables are most important to the practitioner in determining asymmetry. Reliability studies have been reported that have attempted to quantify the variability in each of the relevant CMJ parameters,12,14,15 but the results have been conflicting. Reliability is often classified by the coefficient of variation (CV), using an arbitrary threshold of 10% CV as a benchmark for acceptable reliability. However, this does not necessarily mean that parameters with a CV greater than 10% should be ignored. 14 For example, McLellan et al. 16 showed that the rate of force development is significantly correlated with CMJ performance (r = 0.68, p < 0.01), despite having a relatively high CV (16.3%).
The aim of the CMJ is to achieve maximal vertical height. This is typically measured through direct analysis of the vertical ground reaction force. In a CMJ, an athlete produces force in the medial-lateral and anterior-posterior directions (i.e. shear forces) to maintain balance. 17 Athletes with a functional instability have been shown to produce greater medial-lateral and anterior-posterior force in a landing task. 18 No studies have directly investigated the effect of shear forces on CMJ performance. It was hypothesised in this research that shear impulse in the take-off phase would negatively affect CMJ performance.
In a similar study to the research presented in this paper, Souza et al. 19 evaluated the reliability of CMJ parameters using a single force plate and general population participants. Their results indicated that peak force was the most reliable metric (r = 0.99 and CV = 2.5%) and rate of force development was the least reliable metric (r = 0.94 and CV = 12.9%). The use of general population participants was acknowledged as a limitation of the study and may have affected results, since the participants did not conduct CMJs regularly. Furthermore, only a single force plate was used by Souza et al. 19 Only one study has investigated the relationship between asymmetry and CMJ performance. Bell et al. 20 investigated the influence of peak force and peak power asymmetry in CMJ height. The authors did not report correlations, but separated athletes into groups of 0–5%, 5–10%, 10–15% and >15% asymmetry. Athletes with an imbalance greater than 10% in peak power were found to have a significantly lower jump height (i.e. reduced height by 9 cm).
The primary aim of the research presented in this paper is to quantify the reliability of parameters that represent bilateral asymmetry and shear force production in the CMJ. A secondary aim is to investigate the relationship between asymmetric shear parameters and vertical CMJ performance.
Background
The two methods used to assess asymmetry in plyometric exercises can be classified as unilateral and bilateral. During a unilateral (single-leg) test, the athlete performs a vertical jump using one leg.21,22 This is repeated for each leg, allowing differences to be compared. The second method utilises two force plates. The athlete performs a bilateral (two-leg) vertical jump, with one leg standing on each platform.11,23 The orientations of the x-, y- and z-axes from such force plate measurements are shown in Figure 1, along with typical force traces for the respective axes during the take-off phase of a CMJ. Outputs from each force plate are compared to assess asymmetries.
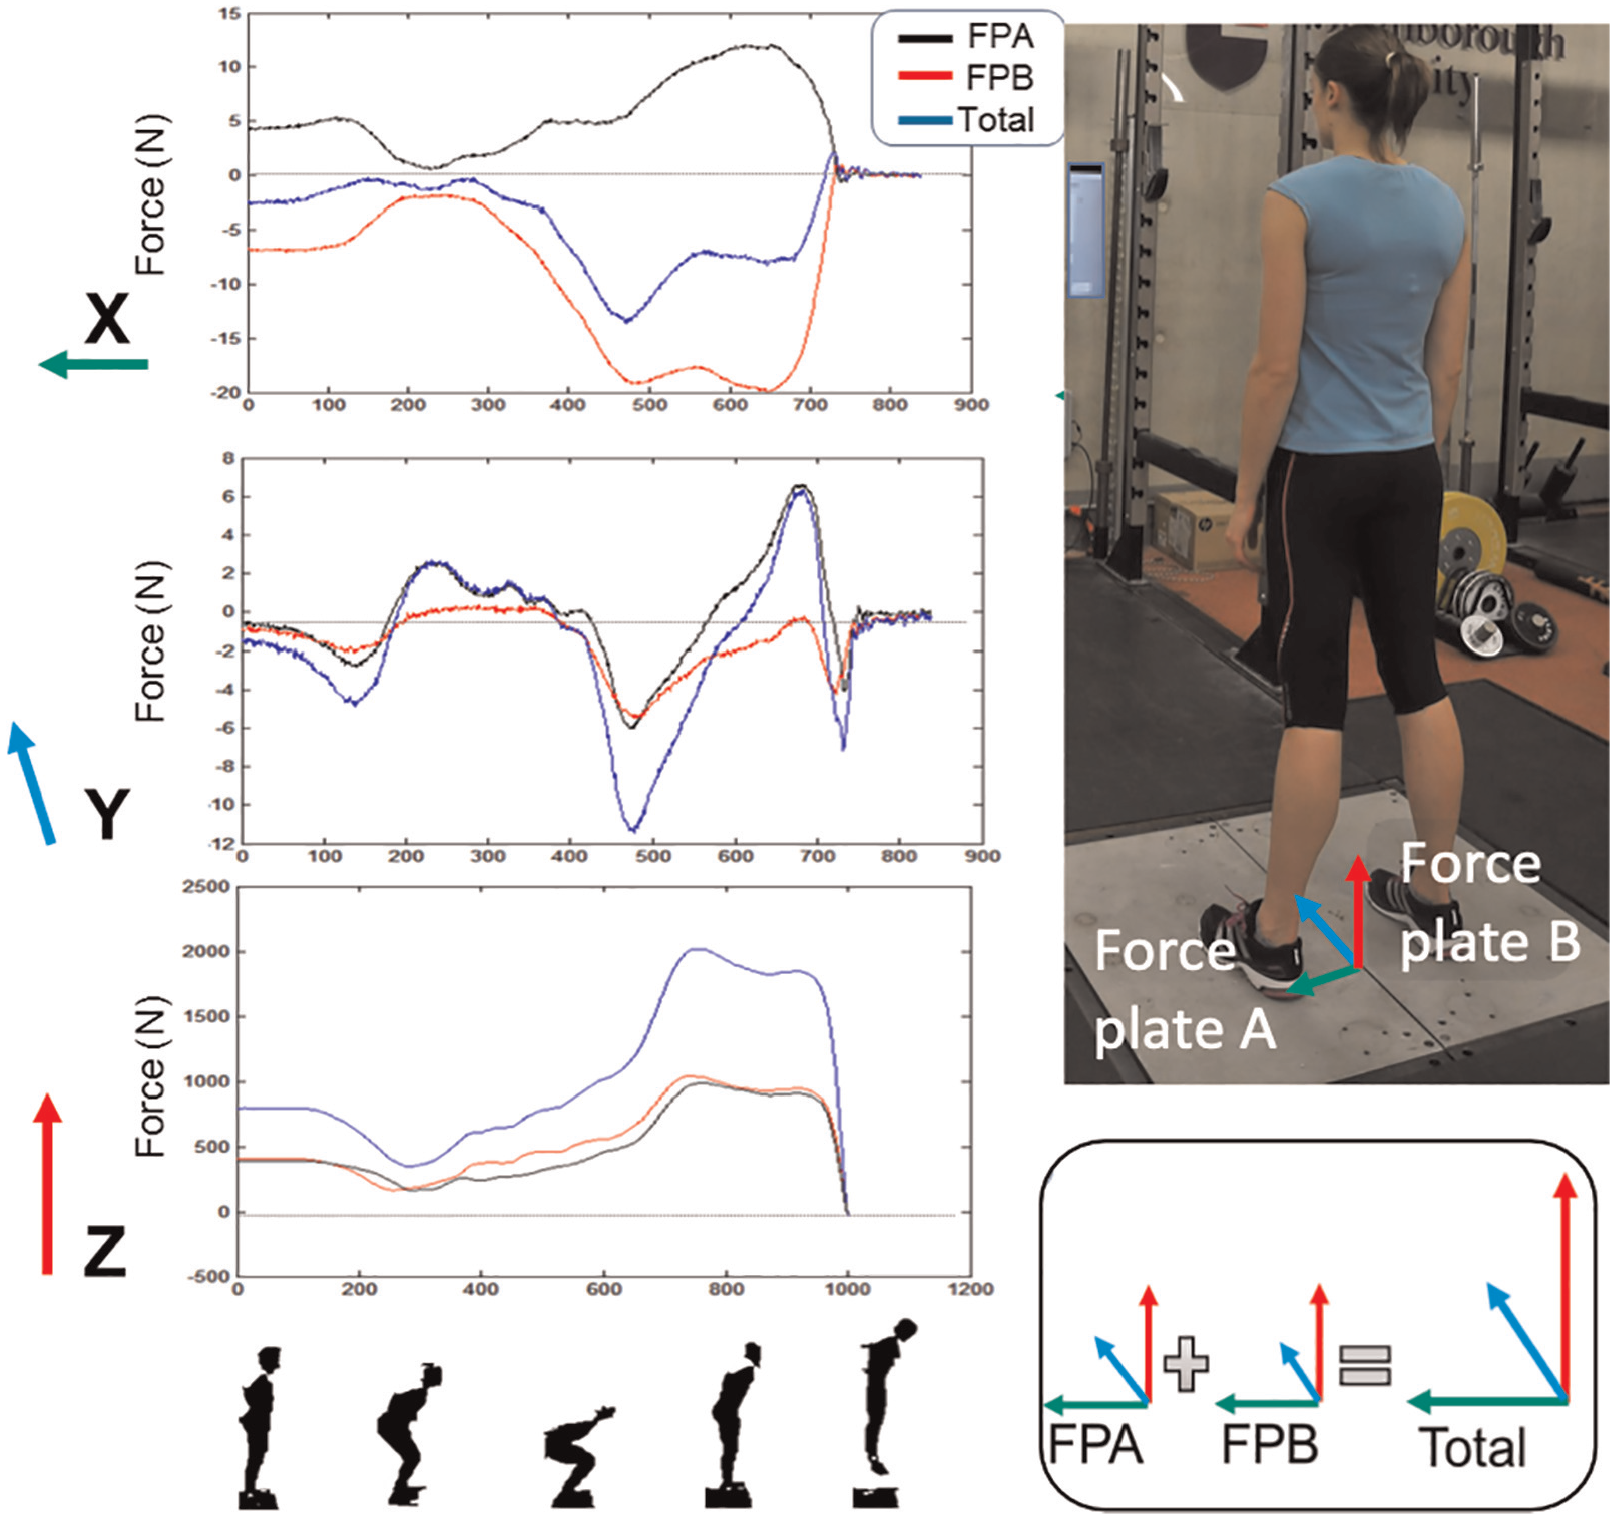
Typical force traces in x- (side to side), y- (front and back) and z- (up and down) axes for countermovement jump take-off phase, showing orientation of measurement axes
Asymmetry has been examined by testing for significant differences between right and left side outputs 23 or by expressing the asymmetry as a percentage.11,20,24 Five methods have been described in the literature when expressing asymmetry as a percentage (see Table 1)..
Formulae used to define asymmetry.
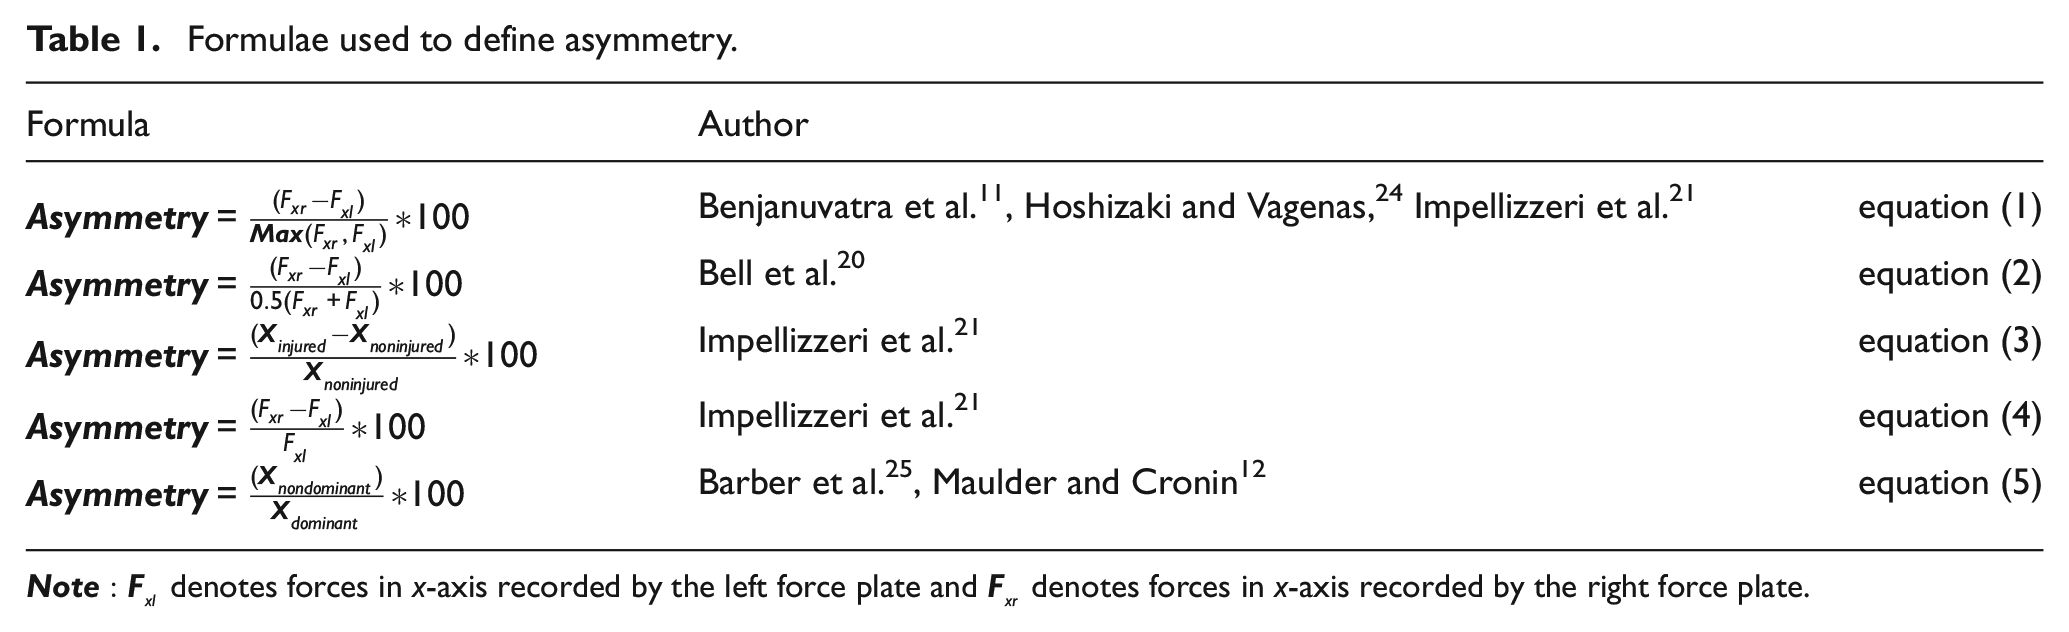
The difference between an injured and non-injured leg, relative to the injured leg, is expressed in equation (3). This method is limited to subjects experiencing or recovering from an injury and is not relevant for healthy subjects. Equation (4) expresses the difference between left and right legs, as a percentage of the left. Adopting this method could be problematic as the level of asymmetry is dependent on whether the left leg is the stronger or weaker side, 21 hence this method is not considered an appropriate measure of asymmetry. Equation (1) expresses the difference between legs relative to the stronger leg, whilst equation (2) expresses the difference between right and left legs relative to the average force between the two legs. Equation (2) is more sensitive to asymmetry than equation (1), as the difference is expressed relative to the average force, which is smaller than the maximum force. Equation (5) expresses the non-dominant leg as a percentage of the dominant leg.
Despite the differences in approaches, several studies discuss the use of a ±15% or ±10% threshold to classify subjects as ‘high risk’ or ‘at risk’ to performance reductions and/or injury.20,21. Only one study focused on the reliability of parameters describing asymmetry, which was based on unilateral movements 12 using equation (5) to enable quantitative values to be derived. It is important to understand the variability of asymmetric measures to determine the validity of ‘high risk’ and ‘at risk’ thresholds. Coefficients of variation must be calculated using data on a ratio scale to represent a distribution. 26 This may be why studies using equations (1)–(4) do not report on coefficient of variation. Equations (1)–(4) express the asymmetry on an interval scale, whilst equation (5) expresses it on a ratio scale. For this reason, equation (5) should be used when determining the reliability of asymmetric parameters.
No previous work has been published that investigated impulse and its variation in the shear axes (i.e.x- and y-axes) in a CMJ. In the x-axis (i.e. side to side forces), forces applied to force plate A (FPA) and force plate B (FPB) are in opposing directions as shown in Figures 1 and 2, where the athlete is pushing outwards with both feet. Hence, when the vectors are summed, the result is a net force (and total impulse) that is lower in magnitude than either the FPA or FPB taken individually.
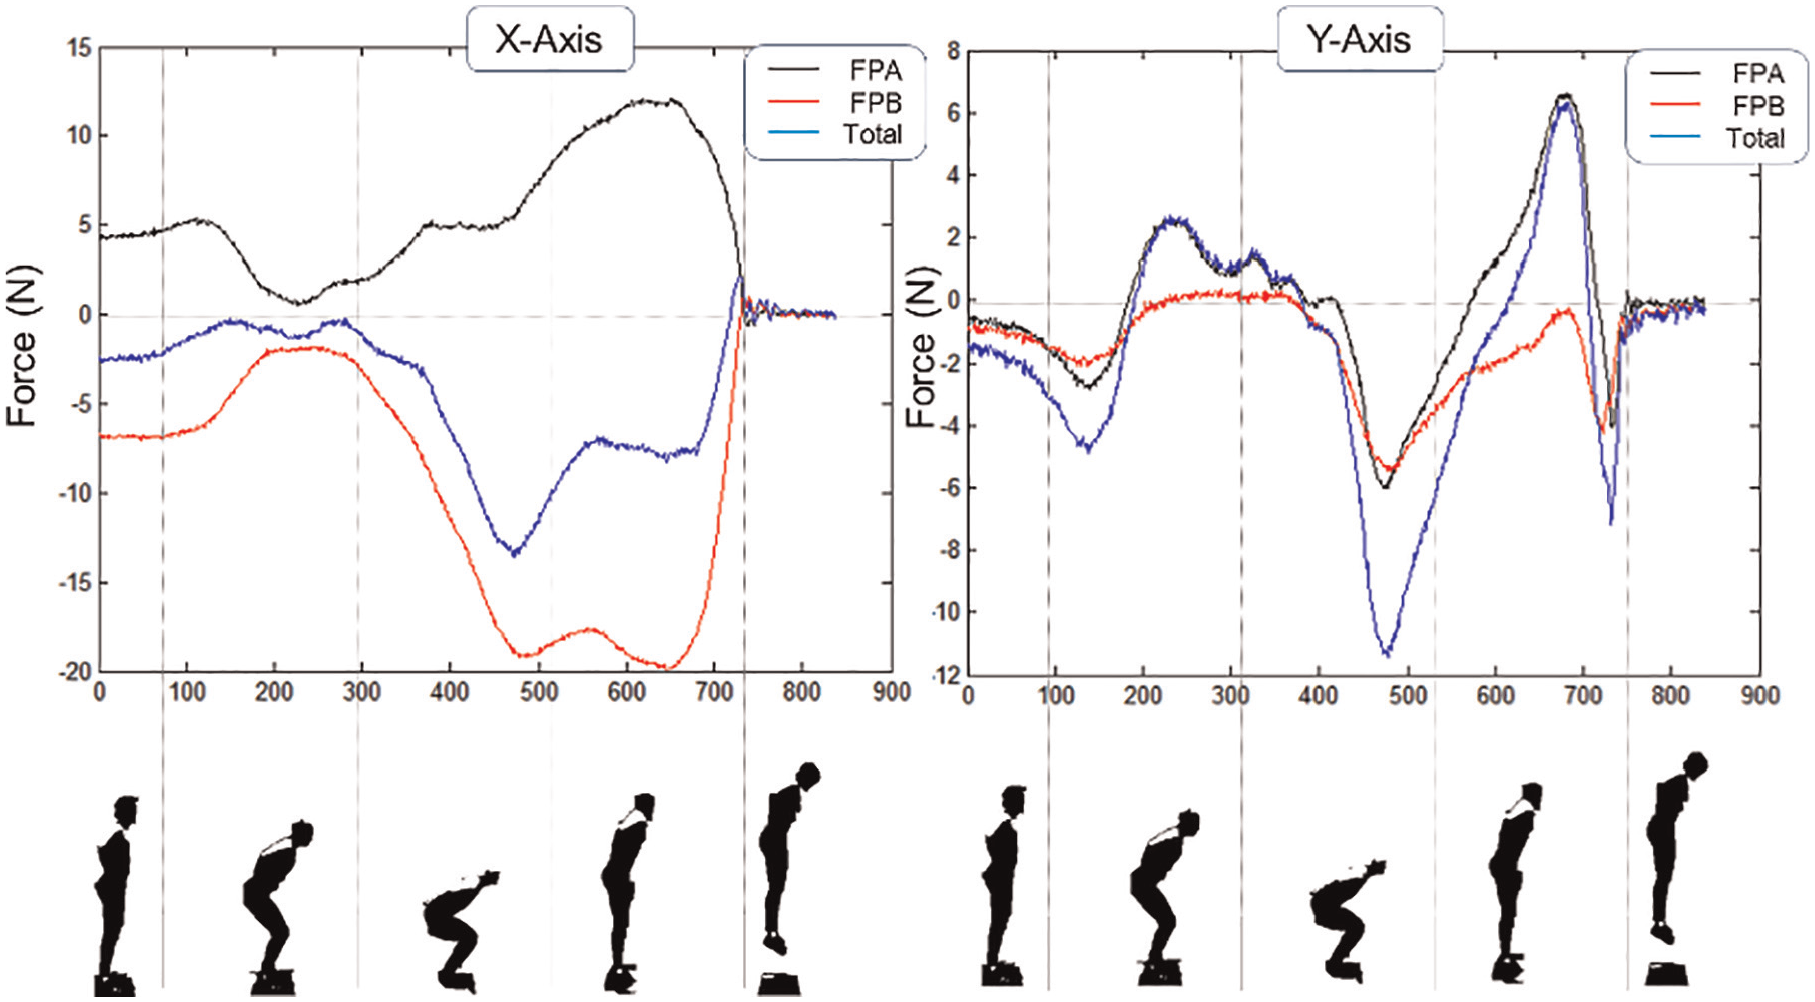
Typical shear force traces in x- and y-axes leading up to a CMJ take-off (i.e. before tTO).
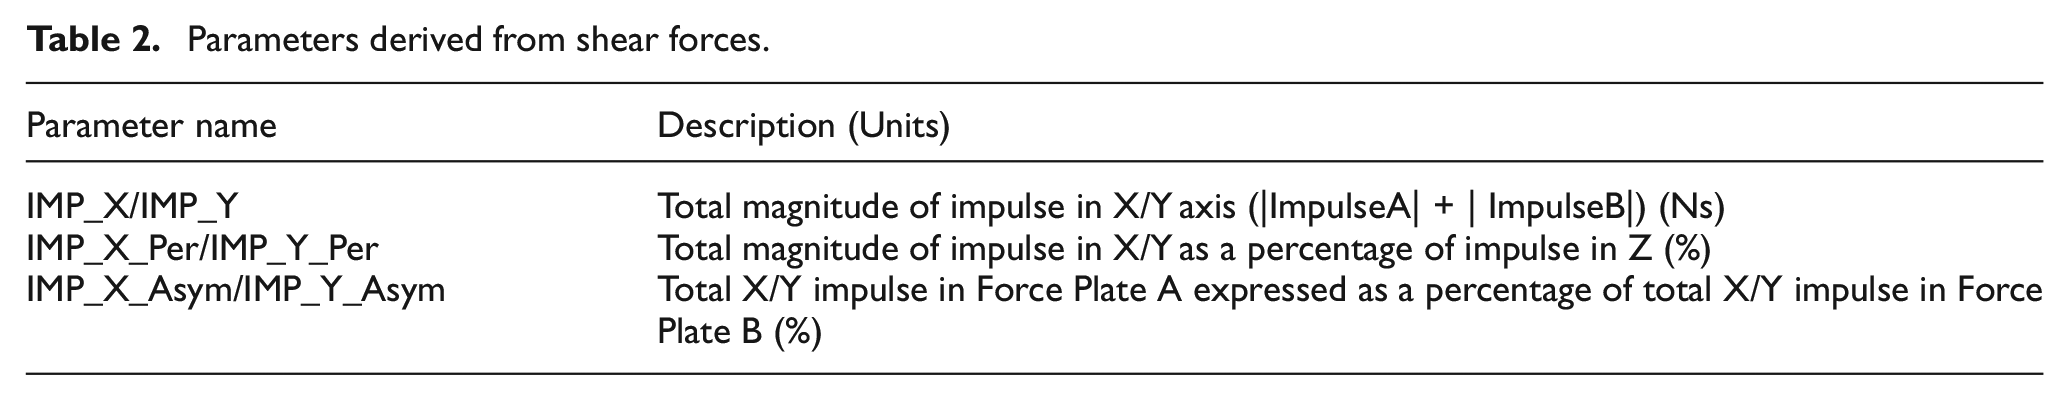
In the y-axis (i.e. front to back), similar features in time are observed with different magnitudes (see Figure 2). The vector sum of the magnitude of the impulses from FPA and FPB is used to determine the total impulse applied in the x- and y-axes. These values are subsequently expressed as a percentage of the total impulse in the z-axis. Finally, asymmetries in shear impulses are defined as the impulses in FPA expressed as percentages of the impulses in FPB. Table 2 lists the parameters derived from each of the shear axes (x and y).
Parameters derived from shear forces.
Materials and methods
Subjects
A total of 15 athletes participated in this study, comprised of eight university level sprint athletes (m = 7, f = 1) and seven university level high jump athletes (m = 4, f = 3). No athletes had any injuries prior to, or during, the test sessions. All athletes were experienced in performing plyometric exercises, including CMJs, as part of their routine training program. All participants signed informed consent forms in compliance with Loughborough University Ethics Standards.
Experimental approach to the problem
The experimental design adopted for the study was a single-group repeated-measures to assess the inter-session and intra-session reliability of a range of performance metrics in the CMJ. Ground reaction force (GRF) data were captured using two low profile force platforms (600 × 500 × 80 mm) with Kistler 9602A transducers (18) to measure tri-axial GRF sampled at a frequency of 1000 Hz. The experimental set up is shown in Figure 3.
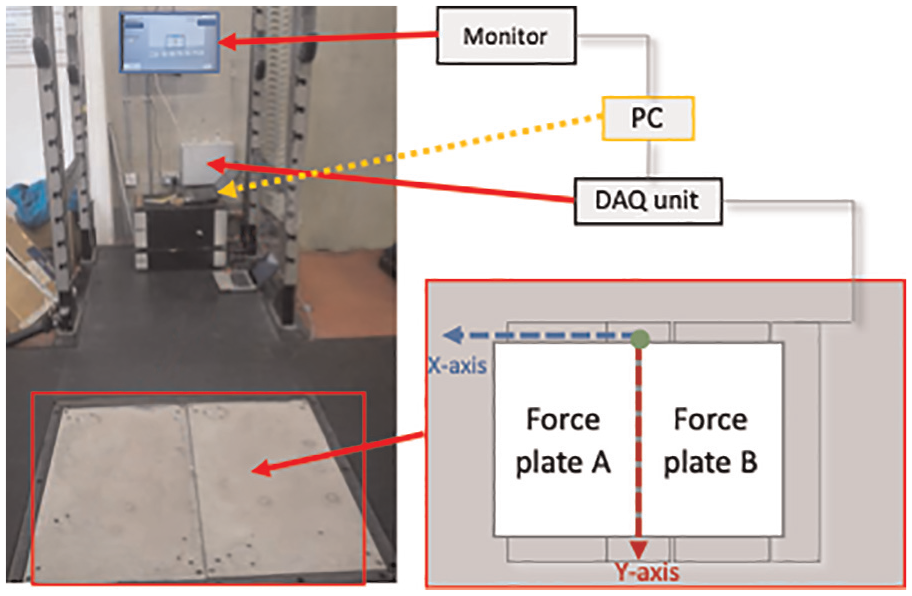
Force plate (A and B) connect to Data Acquisition Unit (DAQ), data processed on local PC and shown to user on touch screen monitor.
Athletes were asked to perform three maximal effort CMJs with 3 min rest between repetitions to minimise effects of fatigue. Sessions were coordinated with athlete training periods to ensure minimum fatigue before a CMJ session. Each athlete participated individually in two sessions, separated by 1 week. Each session comprised a 10-min warm up routine consistent with their training warm up (e.g. a light jog, dynamic stretches, sub-maximal sprints and sub-maximal CMJs), followed by three recorded CMJs. Subjects were instructed to jump for maximal vertical height, with hands placed on the hips or to the side to avoid use of the arms during the jump. GRF was recorded during a 10 s trial window for each CMJ. After 2 s of recording, a visual cue was given and the athlete performed the trial. The trial with the maximum jump height in each session and the mean of the three trials were selected for analysis of inter-session reliability.
Statistical analysis
All statistical processing was performed using MATLAB R2013a. 27 A Kolmogorov-Smirnov test was used to test normality. Inter-session variability in the parameters was calculated, comparing the mean values for the three trials in each session and the trial with the greatest jump height in a session. Intra-session error was determined using all three trials in each session with variability quantified by calculating the standard error in measurement (SEM). 28 The coefficient of variation (CV) was used to represent reliability across all parameters. 28 Pearson’s product-moment correlation 26 was used to investigate the significance of the relationships between asymmetric and shear parameters and CMJ performance, with significance set at p < 0.05. 26
Extraction of performance metrics
Timing of the start, take-off and landing were determined according to the methodology described by Street et al. 29 The end point was determined using a moving standard deviation with a 10-point window. The end point was defined as the first time the standard deviation dropped below a value of 10 N. Body weight was taken as the mean GRF over the first 1.2 s of each trial (i.e. when the athlete was stationary). Velocity and displacement were calculated using the impulse-momentum relationship.15,29 The start and end points from the Total analysis were used to define the start and end point for individual bilateral analysis (i.e. FPA and FPB traces). The traces from the three components (GRF total, GRF FPA and GRF FPB) were analysed independently using the same analysis protocol, resulting in three separate sets of metrics. Results from FPA and FPB were used to express asymmetry using equation (6). Figure 4 highlights the temporal features derived from the force and velocity traces and Figure 5 summarises the algorithms used to derive these values.
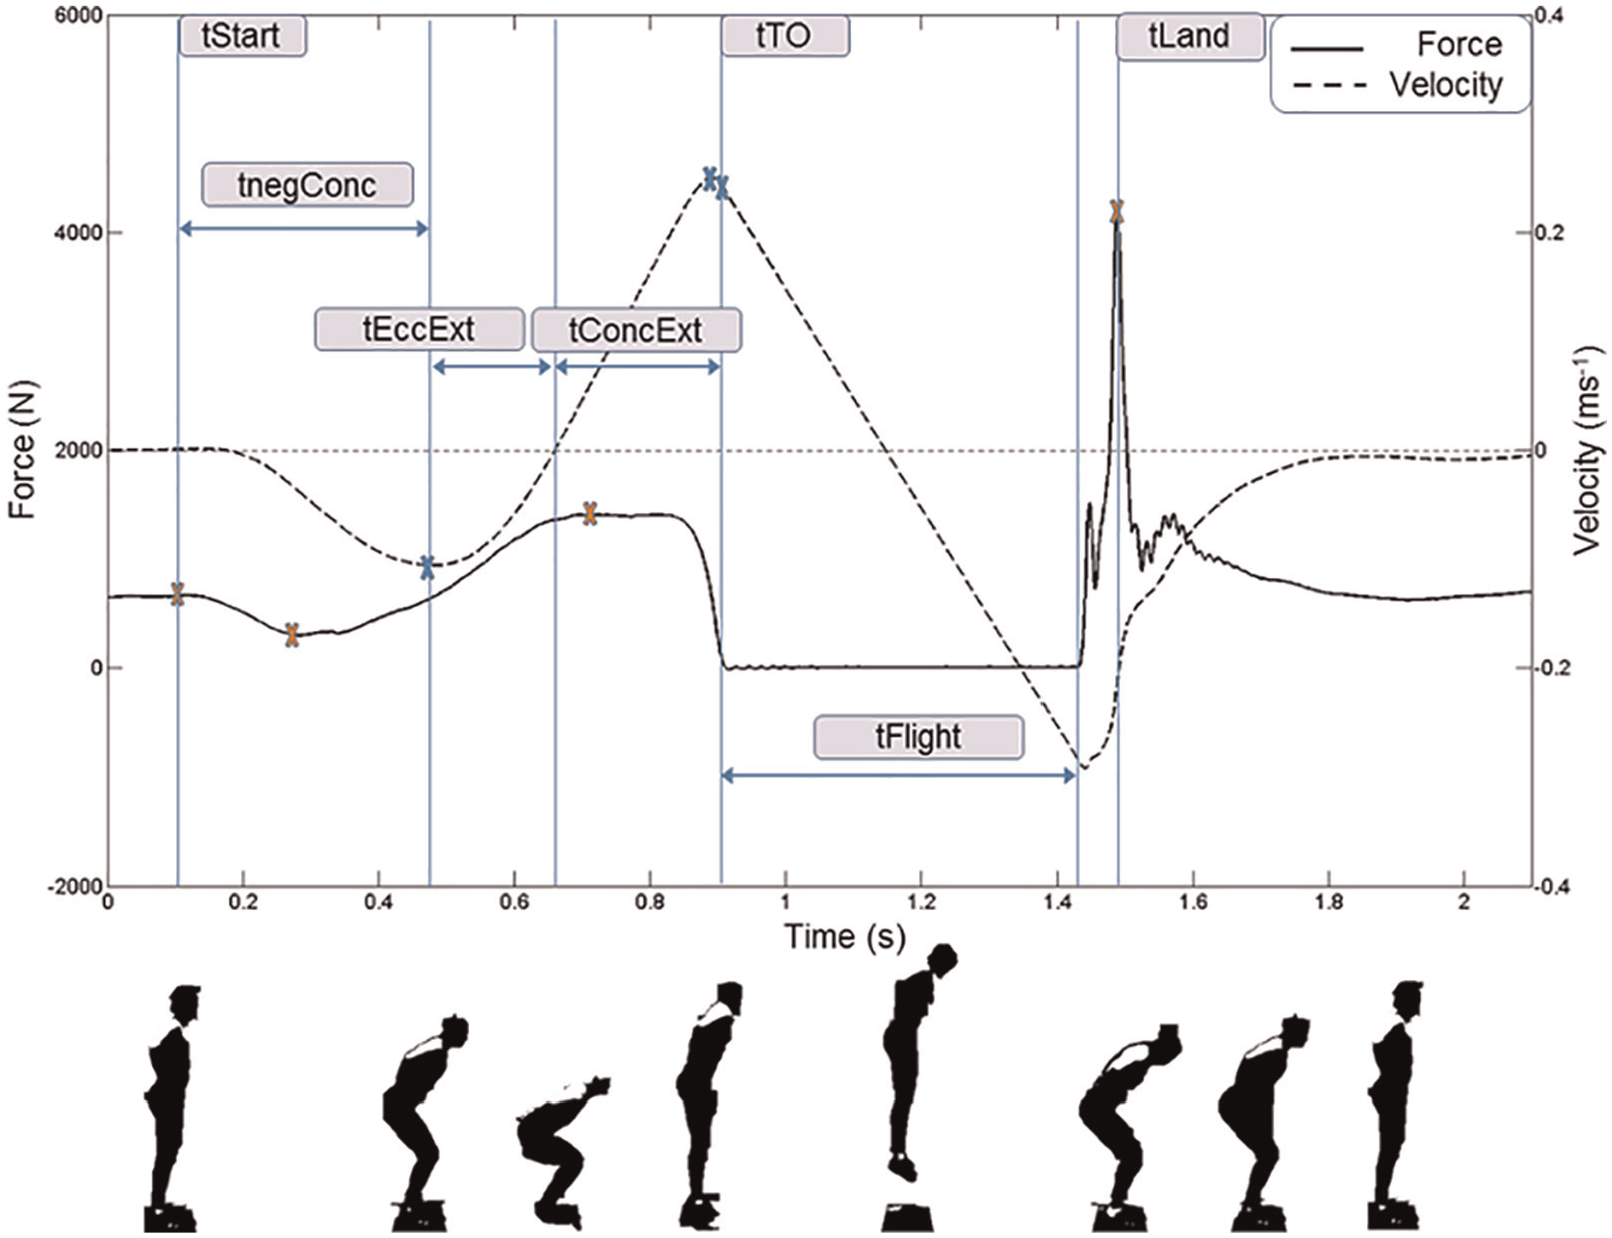
Temporal features derived from force and velocity curve. Time of flight (tFlight) was the difference between time oftake-off (tTO) and time of landing (tLand). For abbreviations, see Table 3.
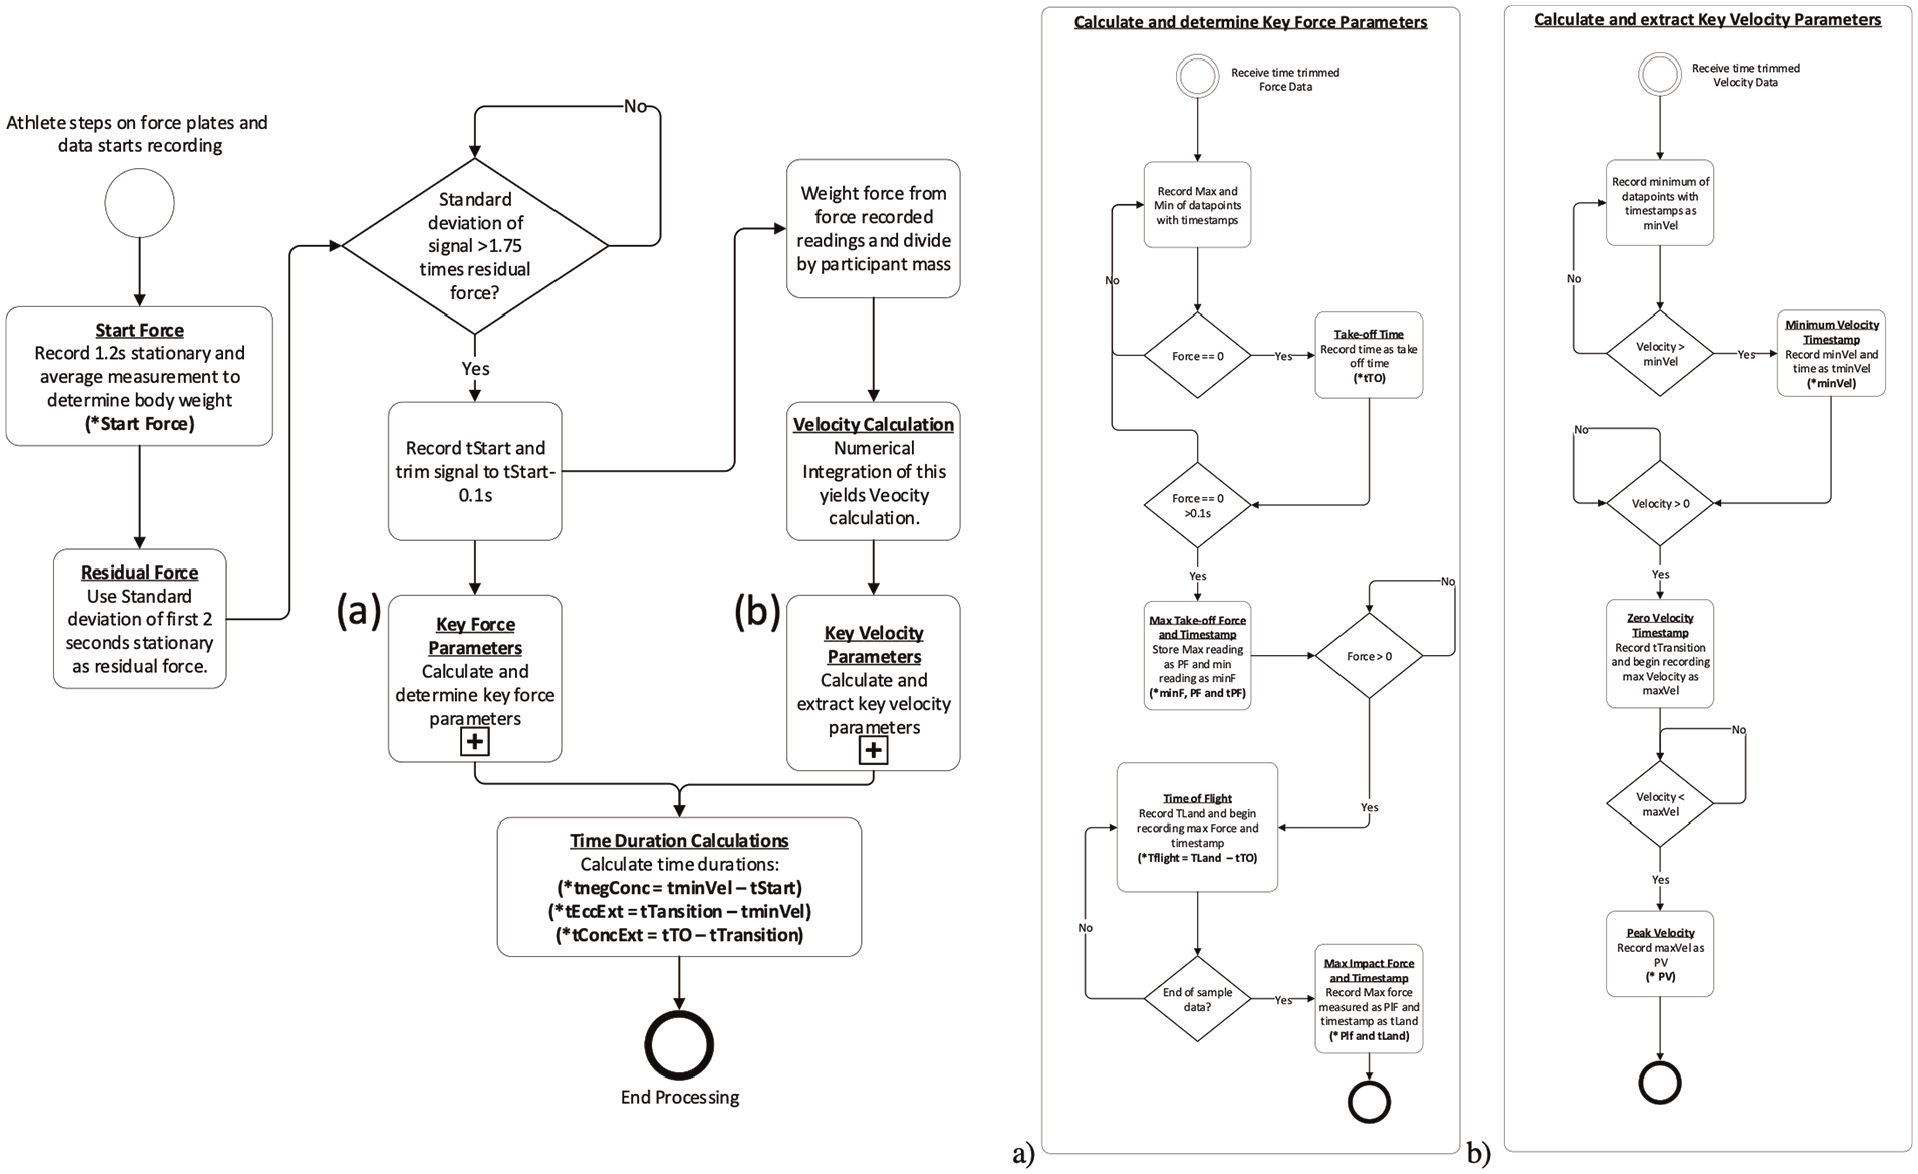
Pseudocode for extraction of features; overview left, subprocess for key force parameter calculation (a), key velocity parameters (b).
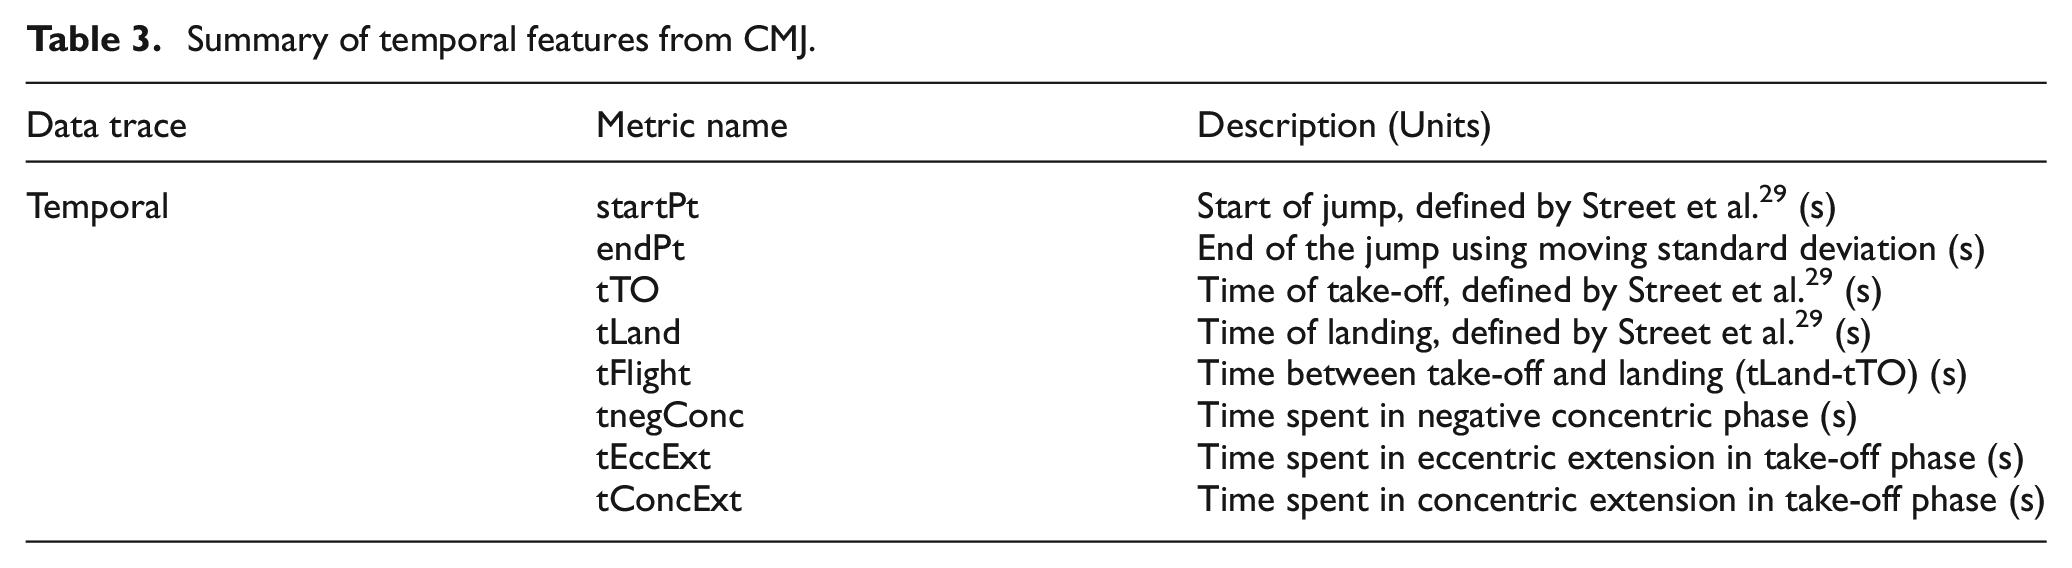
The time spent in the negative, concentric extension phase (tnegConc) is defined as the time from the start point to the maximum negative (i.e. downward) velocity, where the athlete accelerates toward the ground. The time in the eccentric phase (tEccExt) is defined as the time between the maximum negative velocity and the first zero crossing in velocity. The time in concentric extension (tConcExt) is defined as the difference in time between the first zero crossing in velocity and the time of take-off (tTO). The athlete’s velocity is positive (i.e. upward) and increasing during the tConcExt phase. Figure 6 highlights some of the performance metrics derived from the force and velocity traces summarised in Table 3.
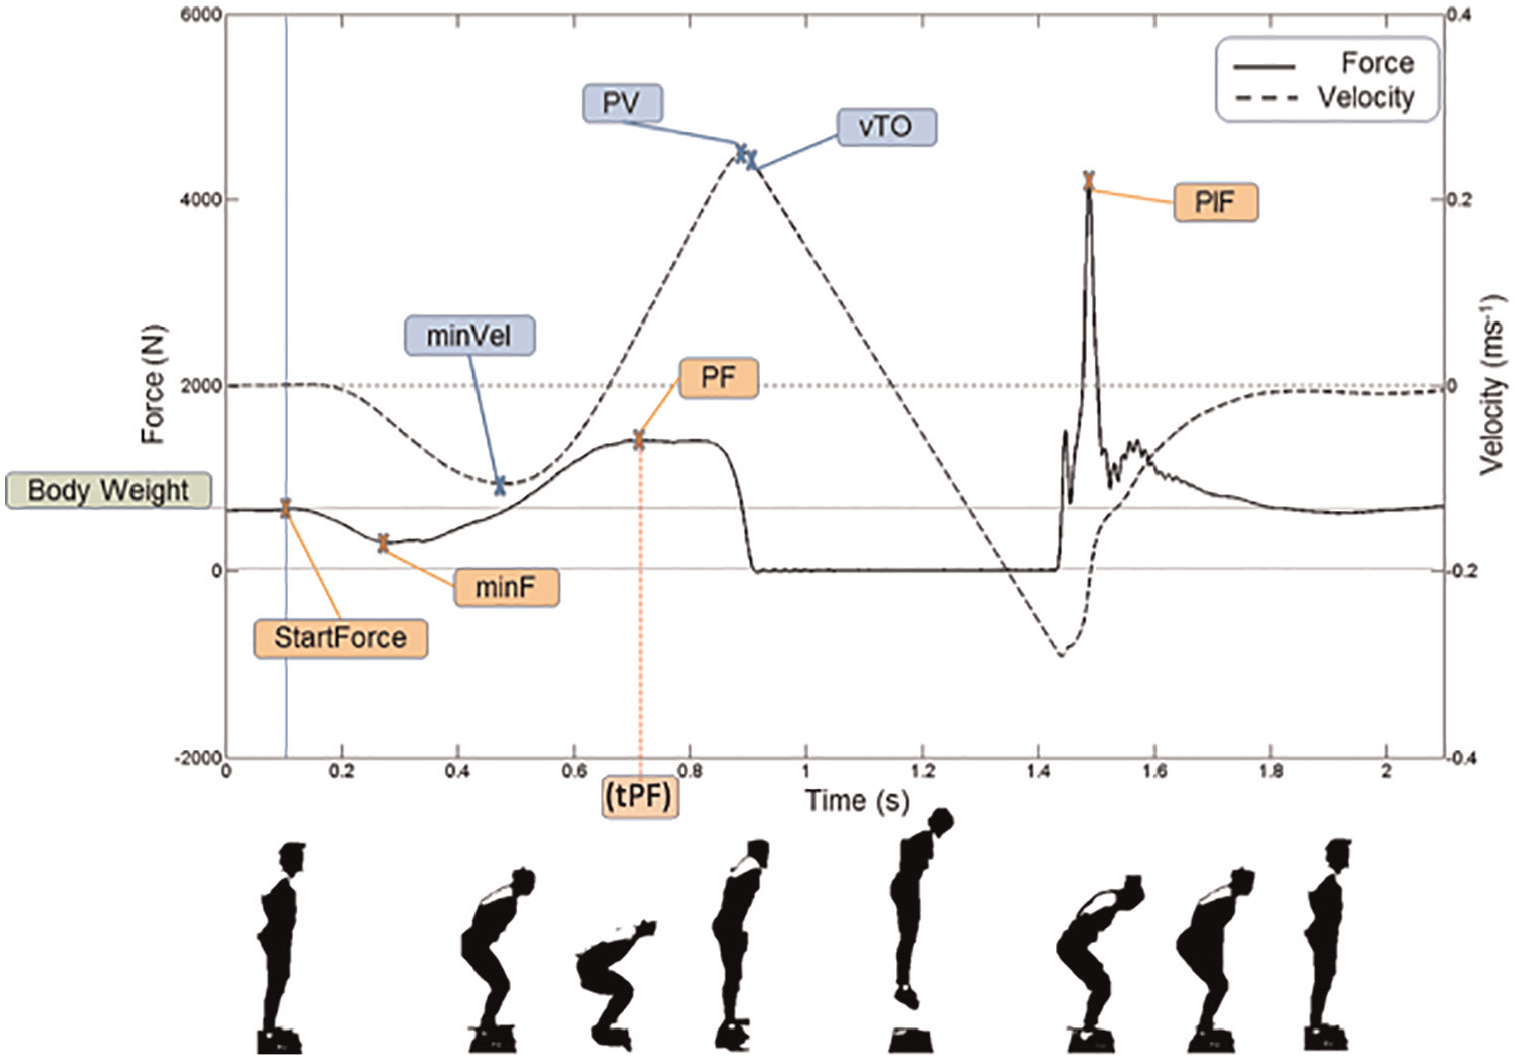
Performance metrics determined from the force and velocity curve. For abbreviations, see Table 4.
Summary of temporal features from CMJ.
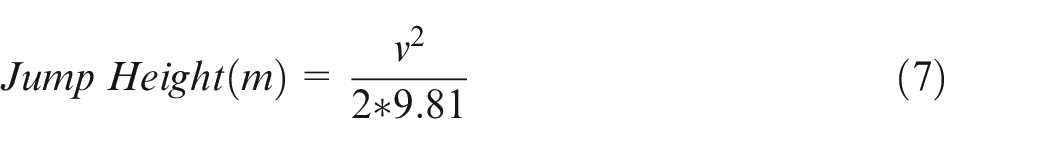
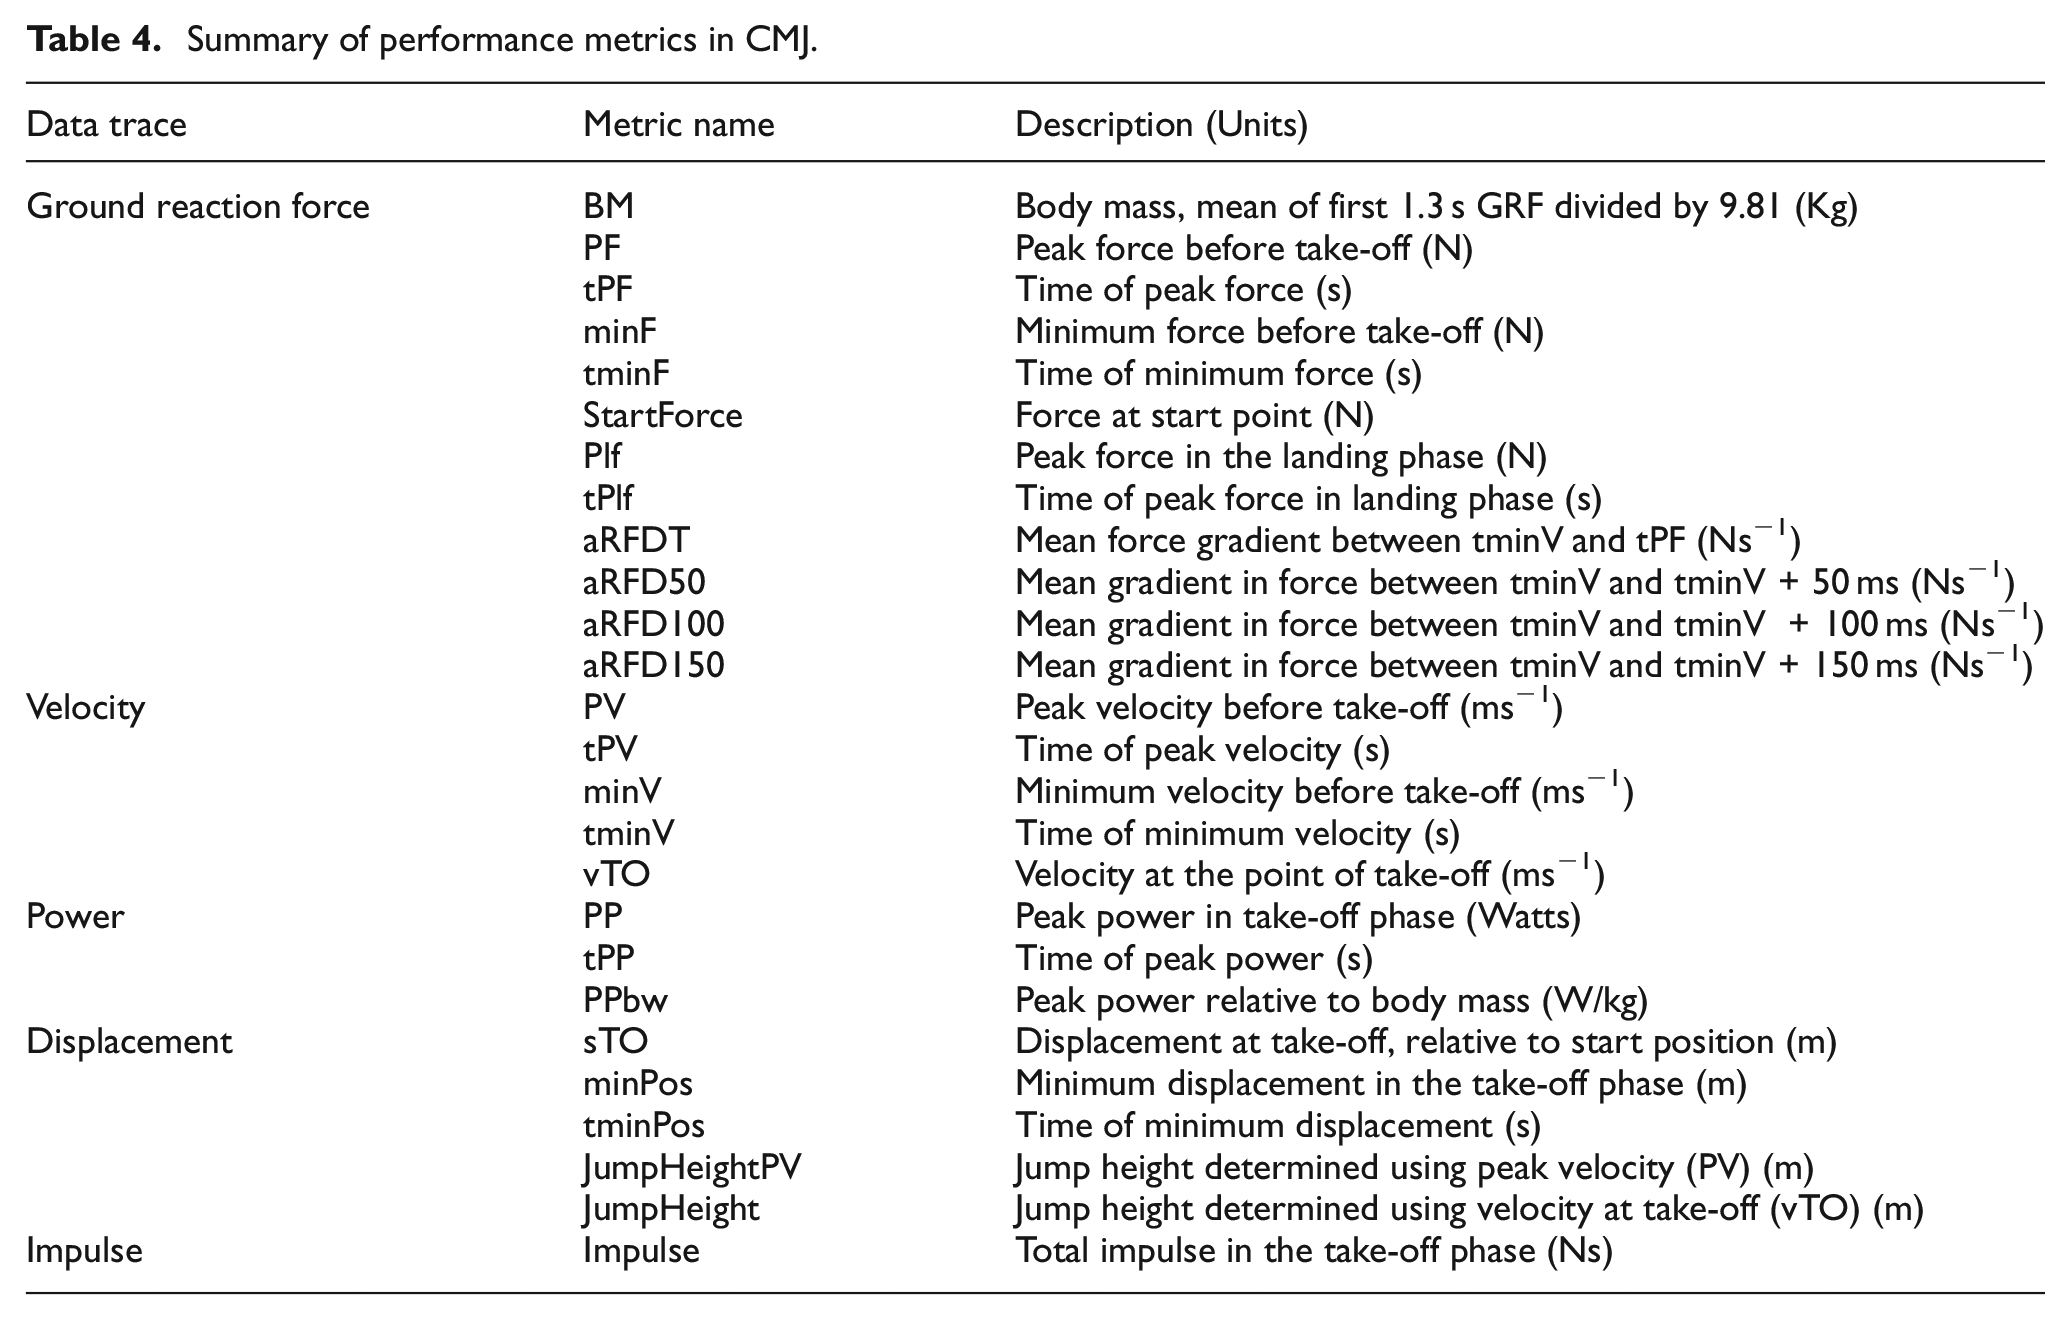
Peak landing force (PlF) is defined as the maximum force produced at the time of landing. Peak force before take-off (PF) is the maximum force generated before the time of take-off. Minimum force in the counter-movement phase (minF) is defined as the minimum force before the time of peak force (tPF). Peak velocity (PV), velocity at take-off (VTO) and minimum velocity (minVel) in the counter-movement phase are also recorded. Average rate of force development (aRFD) was defined as the mean gradient of the force curve between the minVel and tPF. Mean gradients in the force-time curve were calculated using the mean gradient in the 50, 100 and 150 ms intervals following the time of minimum velocity to generate aRFD50, aRFD100 and aRFD150 parameters, respectively, since aRFD has been found to relate to vertical jump displacement with a significance of p < 0.05. 16 Peak power (PP) was defined as the maximum power generated before take-off and is calculated from equation (6). Specific peak power (PPbw) was defined as the peak power divided by body weight (bw) in accordance with guidelines as detailed in Figure 5. Minimum displacement (mpos) in the counter-movement phase is defined as the minimum value of displacement before take-off. The displacement at take-off (sTO) is the displacement of the centre of mass (CoM), approximated as the waist height of the participant, at take-off relative to the starting position of the CoM. Jump height was calculated using equation (7) and is dependent on VTO.

The total impulse in the take-off phase (impulseTO) was defined as the area under the force curve, bounded by the start point and time of take-off. Preformance metrics have been summarised in Table 4.
Summary of performance metrics in CMJ.
Results
Of the 78 derived parameters (35 Total, 35 Asymmetry, 8 Shear), nine were found to exhibit non-normal distributions (p < 0.05). These include aRFD50 from the Total GRF and eight asymmetry parameters (i.e. PEccf, tPEccF, tPV, tminV, tEccExt, tTotalExt, tPF and minF). Non-normality may have been the result of the relatively small number of subjects in this study (n = 15 skewing the distributions and it is likely that if more subjects had participated, the data would represent a normal distribution, as has been reported in similar research studies. 26 Since the majority of parameters were normally distributed, parametric methods were used for this analysis. Variability was quantified by calculating the SEM and CV. 28
Reliability
Table 5 shows a selection of key parameters comparing the group means, standard deviations and change in mean (in absolute values and expressed as a percentage of the mean) between the two sessions. For the Total analysis, percentage changes in mean values for all of the parameters, except aRFDT and aRFD50 associated with rates of change, were small (typically <3%), indicating that the participants were of similar physical fitness in both test sessions. The reliability of Total parameters has been included to provide a comparison for Asymmetry and Shear (X and Y) parameters.
Change in mean for select parameters derived from total, asymmetric and shear analysis.
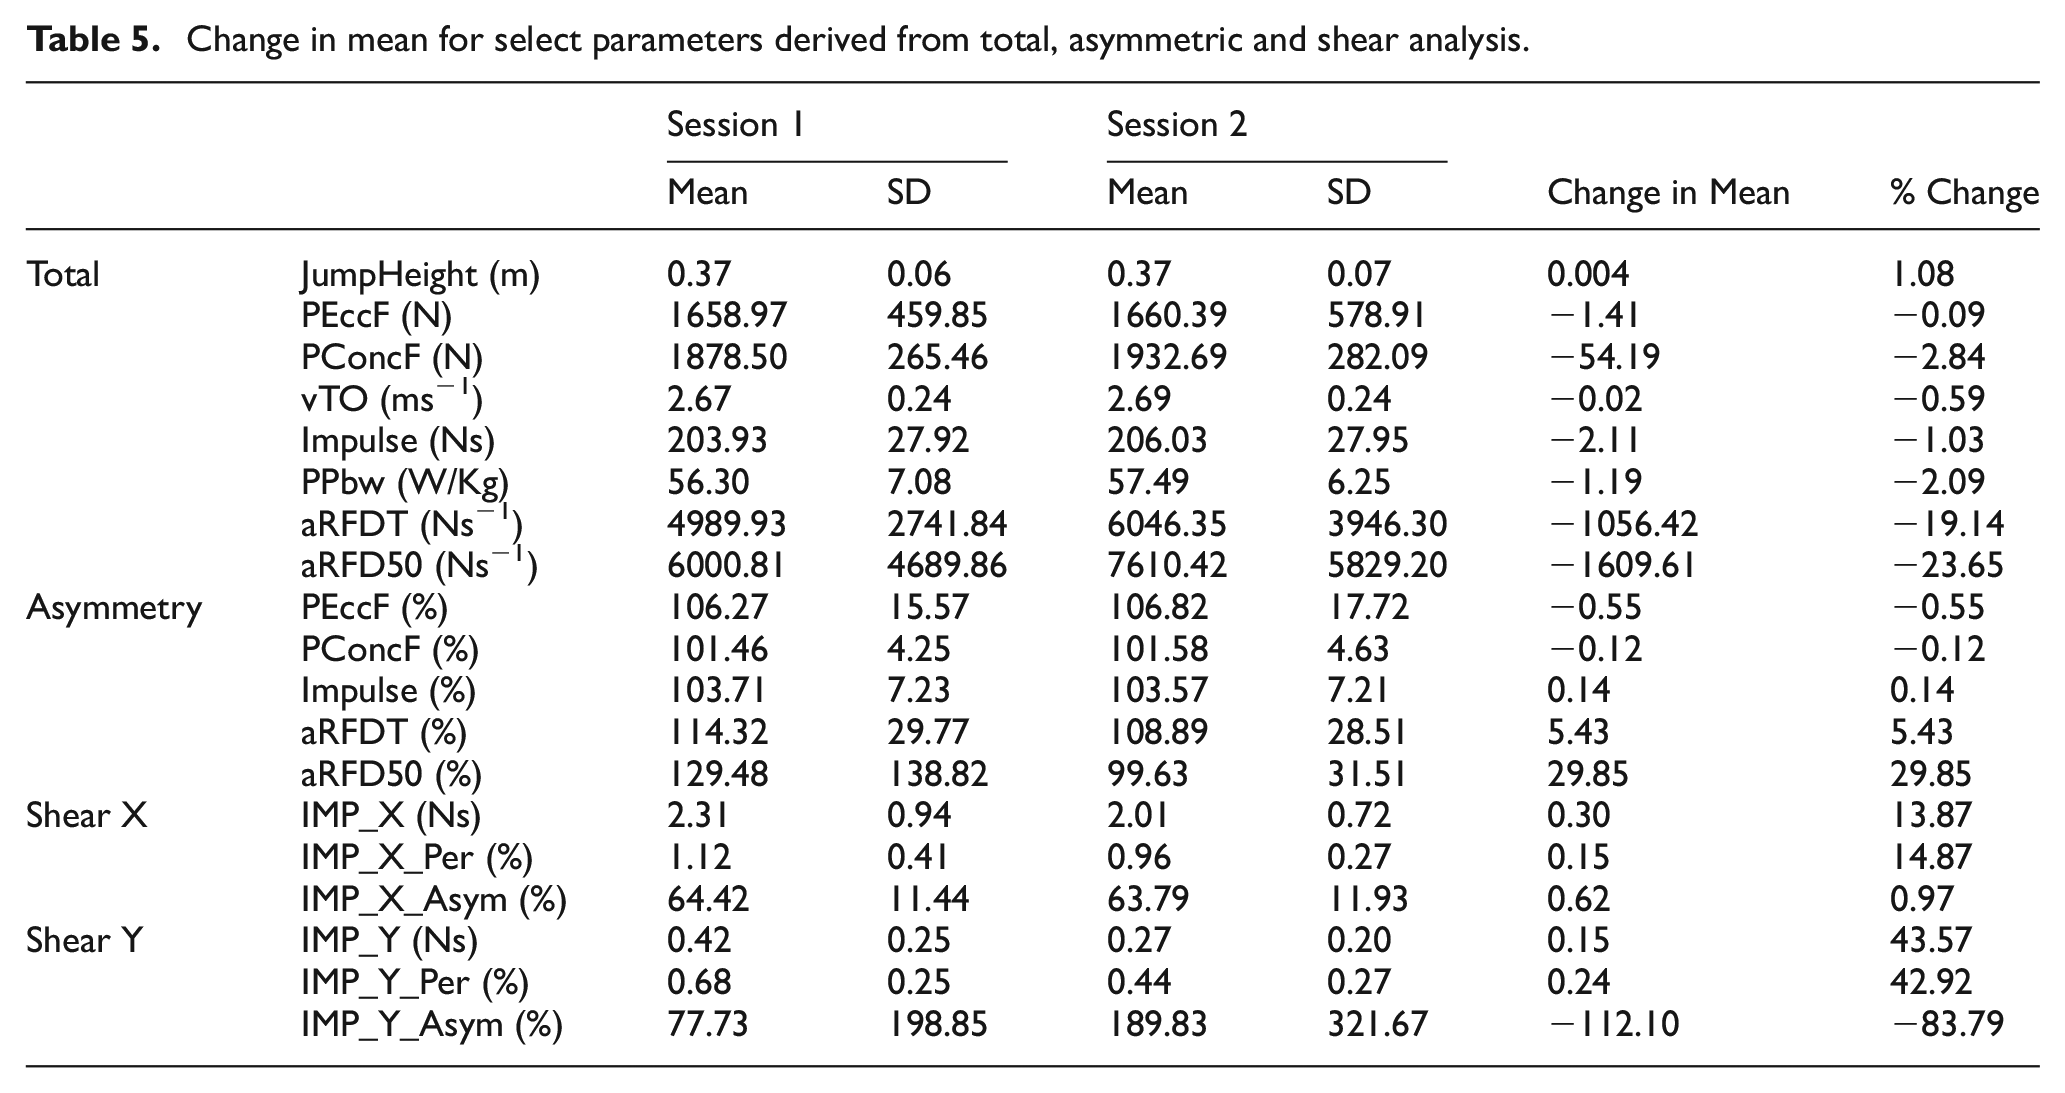
Figure 7 shows a comparison of the three methods of calculating CV including (a) inter-session CV comparing the mean of each session, (b) inter-session CV comparing the maximum from each session and (c) intra-session CV for each of the parameters derived from the Total GRF analysis. An acceptable reliability limit of 10% variation in CV is included on the diagram to highlight which parameters are acceptable and which would be considered too variable to produce reliable information.
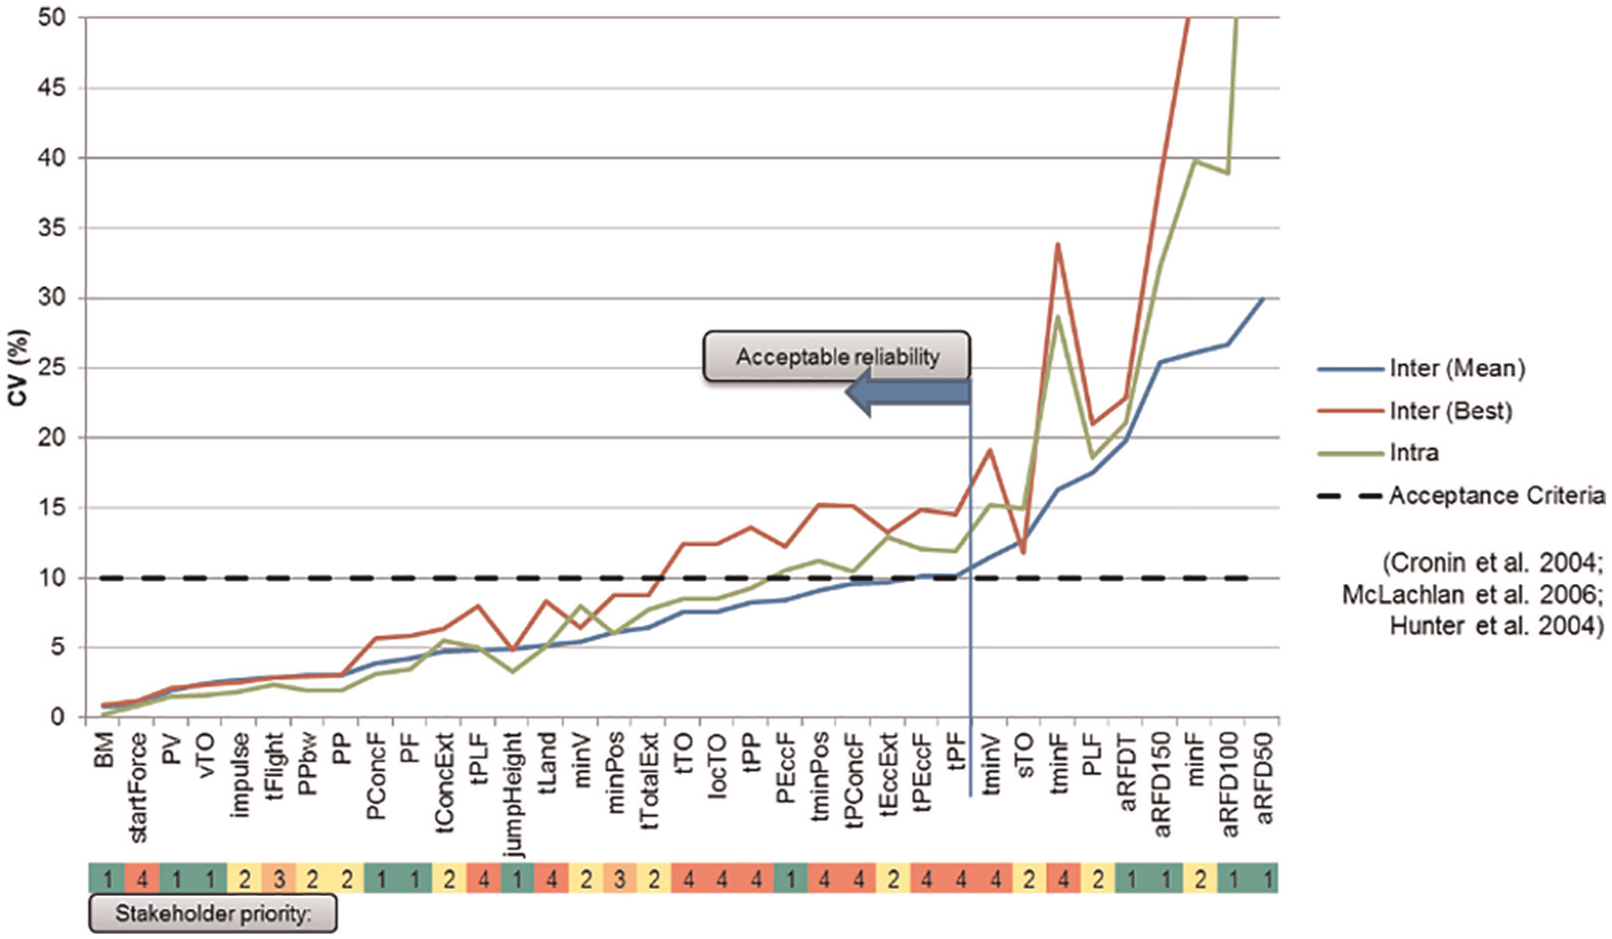
Inter- (mean, best) and intra-session CV (total parameters). Acceptable reliability is identified using the meaninter-session CV.
Body mass showed the lowest CV. Intra-session CV (0.27%) was lower than inter-session CV using best and mean methods (0.87%, 0.9%). Inter-session variation in body mass may have been caused by the athlete being more or less hydrated between the two test sessions, although the protocol was designed to limit this effect. During each session, the athletes did not consume any food or water, so intra-session body mass should not have been affected by these variations. Peak velocity (PV) and velocity at take-off (vTO) showed a lower intra-session CV (1.5% and 1.6%, respectively) compared with inter-session variability (Mean = 1.6% and 2.4%, Best = 2.1% and 2.4%). Rate of force parameters (aRFDT, aRFD50, aRFD100, aRFD150) had a CV greater than 15%. These results are consistent with previous research studying rate of force development. 16 Minimum force (minF) had a lower magnitude of CV compared with either peak eccentric (PEccF) or peak concentric force (PConcF). Note: this variation is exaggerated when expressed as a percentage of the mean, as minimum force (e.g. 200 N) is typically an order of magnitude smaller than peak forces (e.g. 8000 N). These CV values are consistent with reliability values (typically<10%) as reported in literature.12,15,16 Figure 8 shows a comparison of inter- and intra-session variability for Asymmetric parameters.
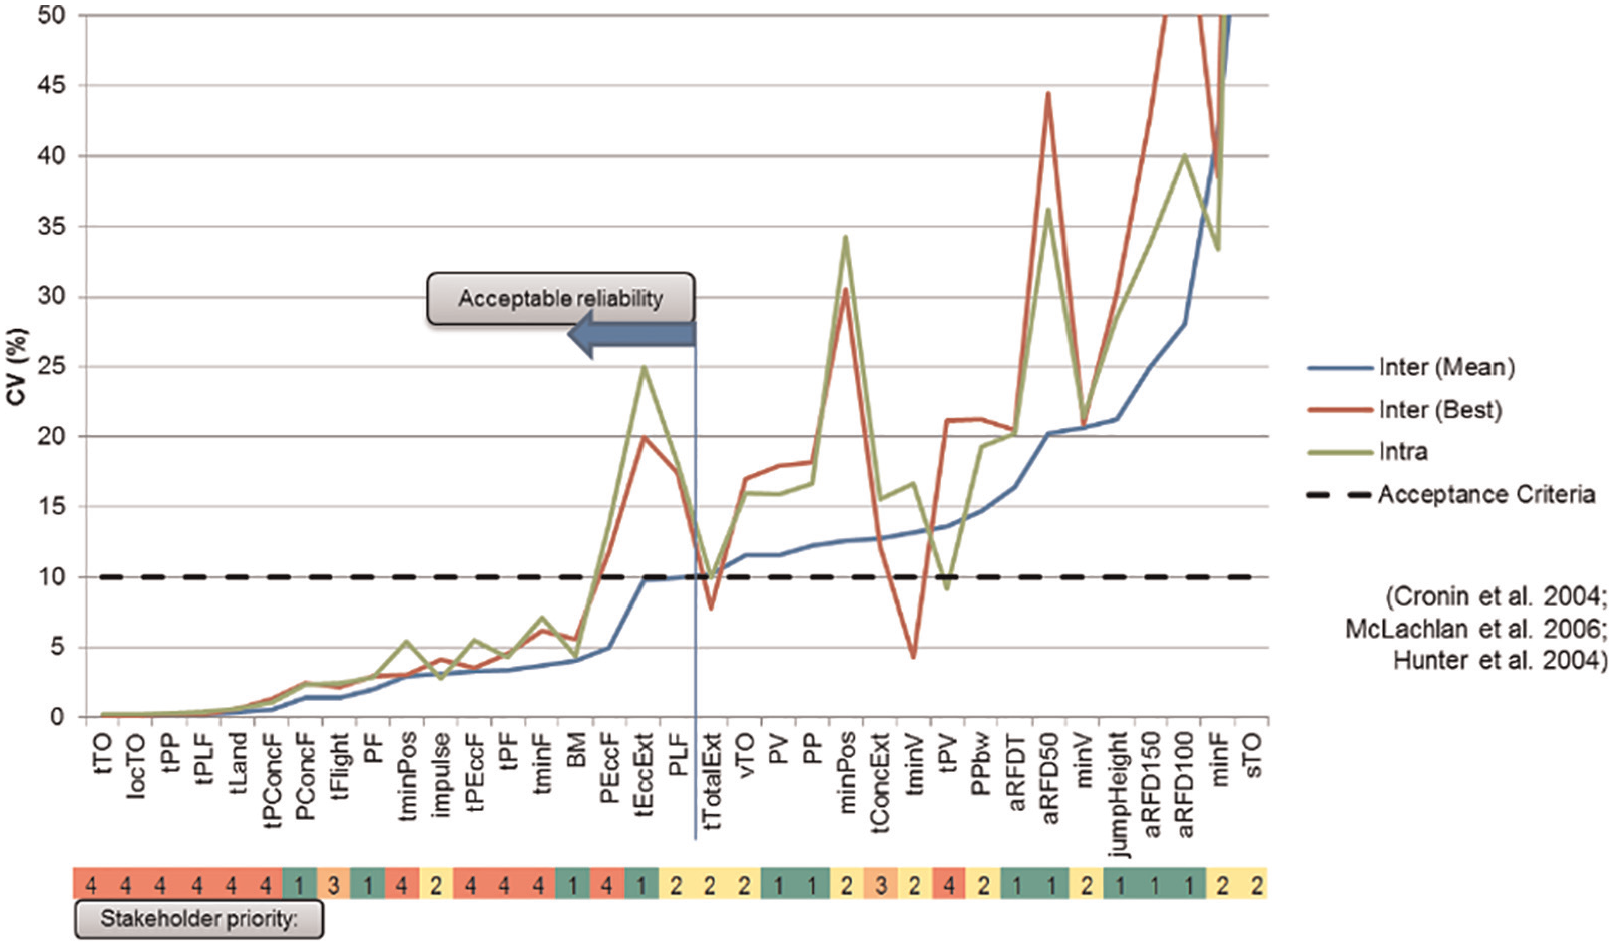
Comparison of inter- and intra-session CV for performance metrics in CMJ, asymmetric parameters. Acceptable reliability is identified using the mean inter-session CV.
Twenty-one of the 35 parameters describing Asymmetry had a CV (for the mean) lower than 10%. Asymmetric temporal features (i.e. time variant features split between the two force plates) showed a low variability (i.e.<5%). Asymmetric body mass (BM), a static measure of the athlete’s weight distribution prior to starting the jump, showed a CV of 4.3%, which was considerably higher than the Total BM (0.8%). Impulse, peak eccentric and peak concentric forces are dynamic measures of asymmetry. All of these dynamic measures showed low CVs. In ascending order, the CVs were peak concentric (1.5%), impulse (3.2%) and peak eccentric force (3.7%). As with the Total GRF analysis, the rate of force parameters had high variabilities. Parameters using velocity or displacement terms had higher Asymmetric CVs compared to Total GRF CV. Figure 9 shows the intra- and inter-session CVs for shear impulse parameters. High CV (i.e. >10%) were observed for all of the shear impulse parameters (i.e. IMP_X, IMP_Y, IMP_X_Per, IMP_Y_Per, IMP_X_Asym and IMP_Y_Asym). It is to be noted that CVs for shear impulses in the x-axis (i.e. left and right) were lower (11–27%) than equivalent measures in the y-axis (i.e. backward and forward) (greater than 35%).
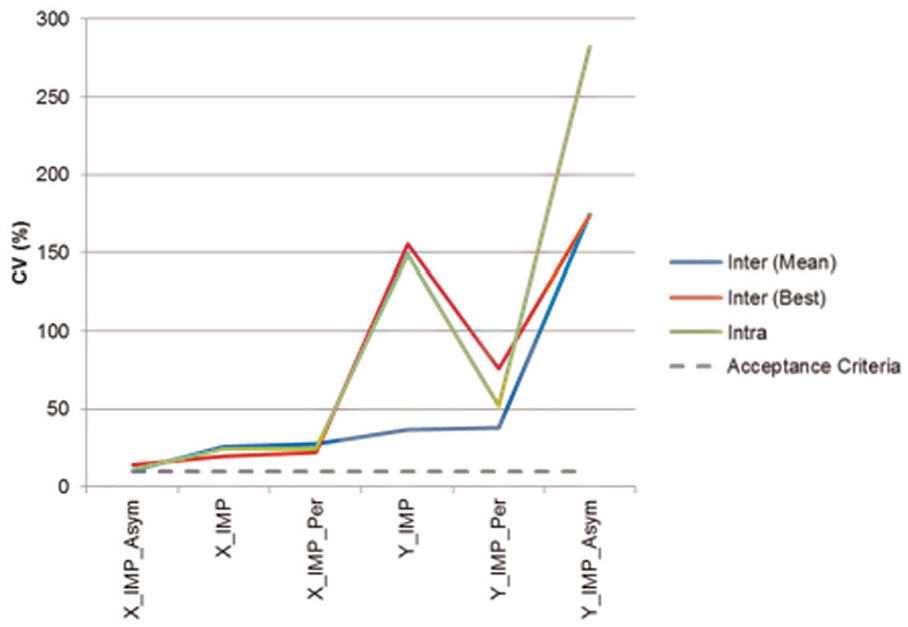
Inter- (mean, best) and intra-session CV for shear impulse parameters.
Relationship between asymmetry, shear impulse and CMJ performance
The secondary aim of this investigation was to investigate the effect of asymmetry and shear impulses on CMJ performance. The relationship was investigated by applying Pearson’s product-moment correlation, 30 with significance set at p < 0.05. The magnitude of correlation has been classified according to Evans 30 as 0–0.19 = very weak, 0.20–0.39 = weak, 0.40–0.59 = moderate, 0.60–0.79 = strong and 0.80–1 = very strong. Table 6 shows the correlation coefficient for shear variables which showed significant correlation (p < 0.05) with Total impulse in the Z (vertical) direction.
Pearson’s correlation coefficient for shear variables showing significant correlation (p < 0.05) to total impulse.
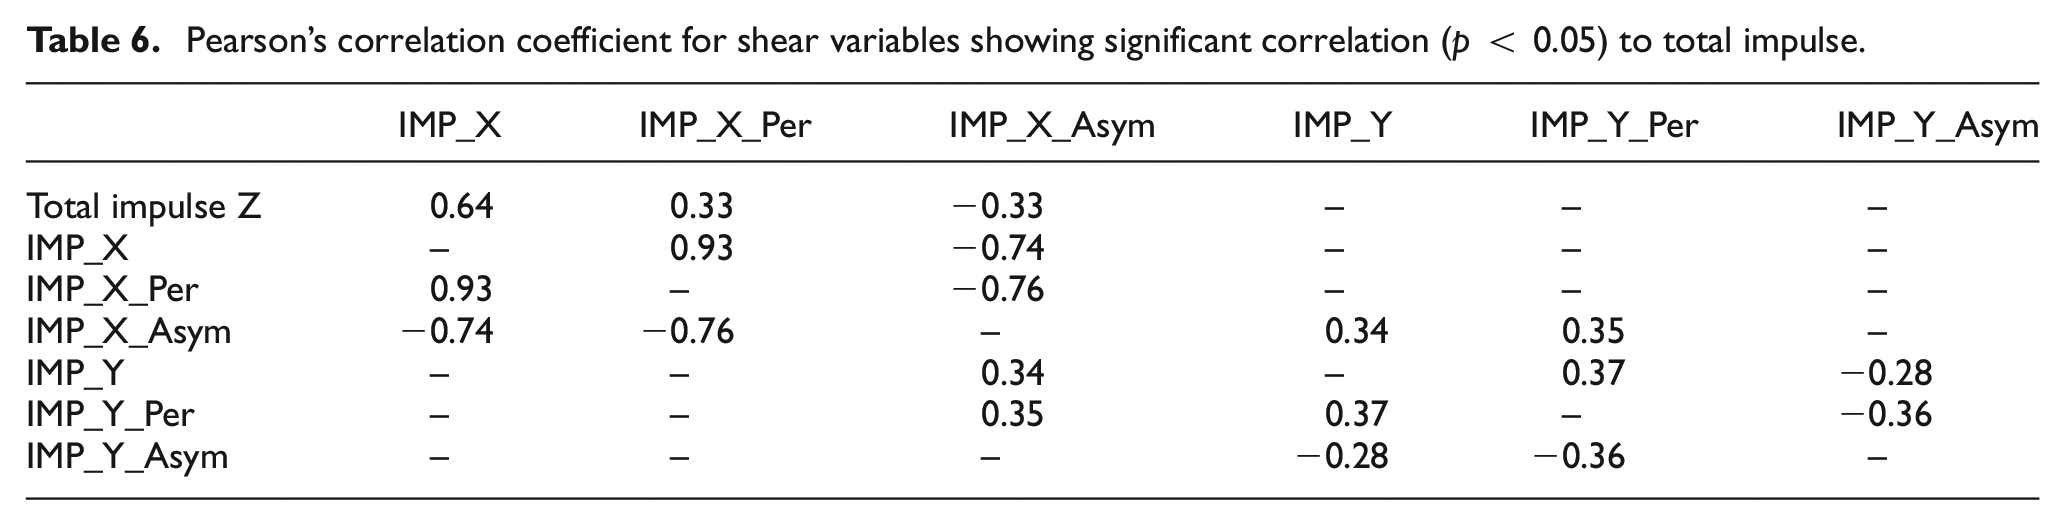
Significant relationships (p < 0.05) were found between measures of shear impulse in the x-axis and Total impulse in the z-axis. The lateral impulse, ‘IMP_X’ showed strong positive relationships with ‘Total Impulse Z’ (R = 0.64) and ‘IMP_X_Per’ (R = 0.93) and a strong negative relationship with ‘IMP_X_Asym’ (R = −0.74). No significant relationships were found between measures of shear impulse in the y-axis (i.e. backward and forward) ‘IMP_Y’ and total impulse in the z-axis, ‘Total Impulse Z’. Weak positive and weak negative relationships were observed between impulses in the x- and y-axes (R = −0.37 to 0.37). Kinetic parameters (e.g. peak eccentric force (PEccF)) were normalised relative to body mass (BM) when comparing the relationship between asymmetry and performance characteristics. Table 7 shows significant (p < 0.05) correlations between Asymmetric parameters and parameters derived from Total GRF.
Showing significant correlations (p < 0.05) between asymmetric parameters and parameters derived from total GRF.
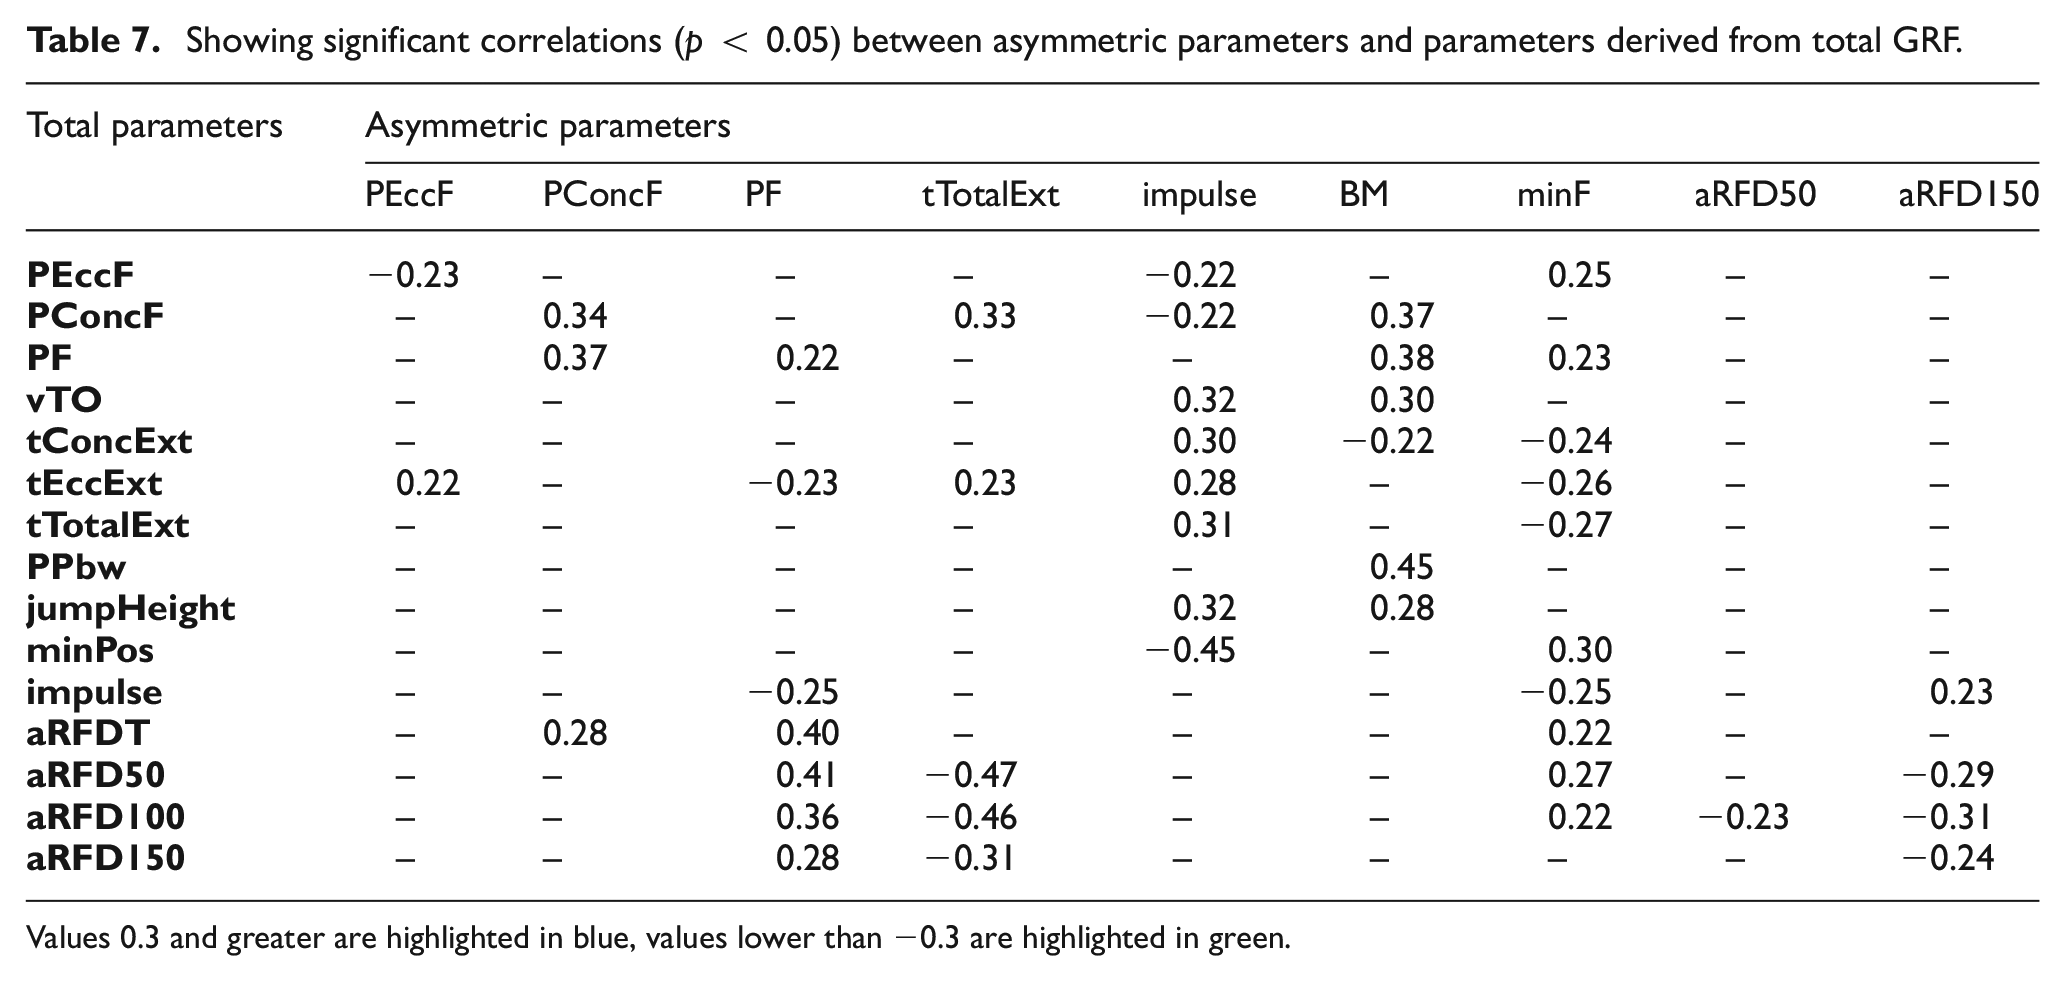
Values 0.3 and greater are highlighted in blue, values lower than −0.3 are highlighted in green.
None of the relationships observed were classified above moderate according to Evans. 30 The strongest negative relationship (moderate) observed was between Total aRFD50 and Asymmetric tTotalExt (R = −0.47), whilst the strongest positive relationship (moderate) was between Total PPbw and Asymmetric BM (R = 0.45). A weak negative relationship was found between asymmetric peak eccentric force and peak eccentric force (R = −0.23). Positive moderate relationships were observed between asymmetric peak concentric force, total peak concentric force and total peak force (R = 0.34, 0.37). Asymmetric peak force showed moderate positive correlations to total rate of force, and rate of force at 50 and 100 ms (R = 0.40, 0.41 and 0.36, respectively). Asymmetric time of total extension showed a moderate positive relationship with peak concentric force (R = 0.33) and a moderate negative relationship with rate of force development at 50, 100 and 150 ms (R = −0.47, −0.46 and −0.31, respectively). Asymmetric impulse showed a moderate negative relationship with minimum position (R = −0.45) and weak positive relationships with velocity at take-off, time of concentric extension, time of total extension and jump height (R = 0.32, −0.30, −0.31 and 0.32, respectively). Asymmetric weight distribution (BM) showed weak to moderate positive relationships with peak concentric force, peak force, velocity at take-off and specific peak power (R = 0.37, 0.38, 0.30 and 0.45, respectively). Asymmetric minimum force showed a weak positive correlation with minimum position (R = 0.30), whilst asymmetric rate of force at 150 ms showed a weak negative correlation to rate of force at 100 ms (R = −0.31).
Figure 10 shows the 84 CMJs recorded in this study arranged by (a) asymmetric peak power and (b) asymmetric impulse. No significant difference was found between groups of asymmetries as reported by Bell et al. 20 This may be due to the relatively low number of subjects used in this study (n = 15) compared with that of Bell et al. (n = 167). 20
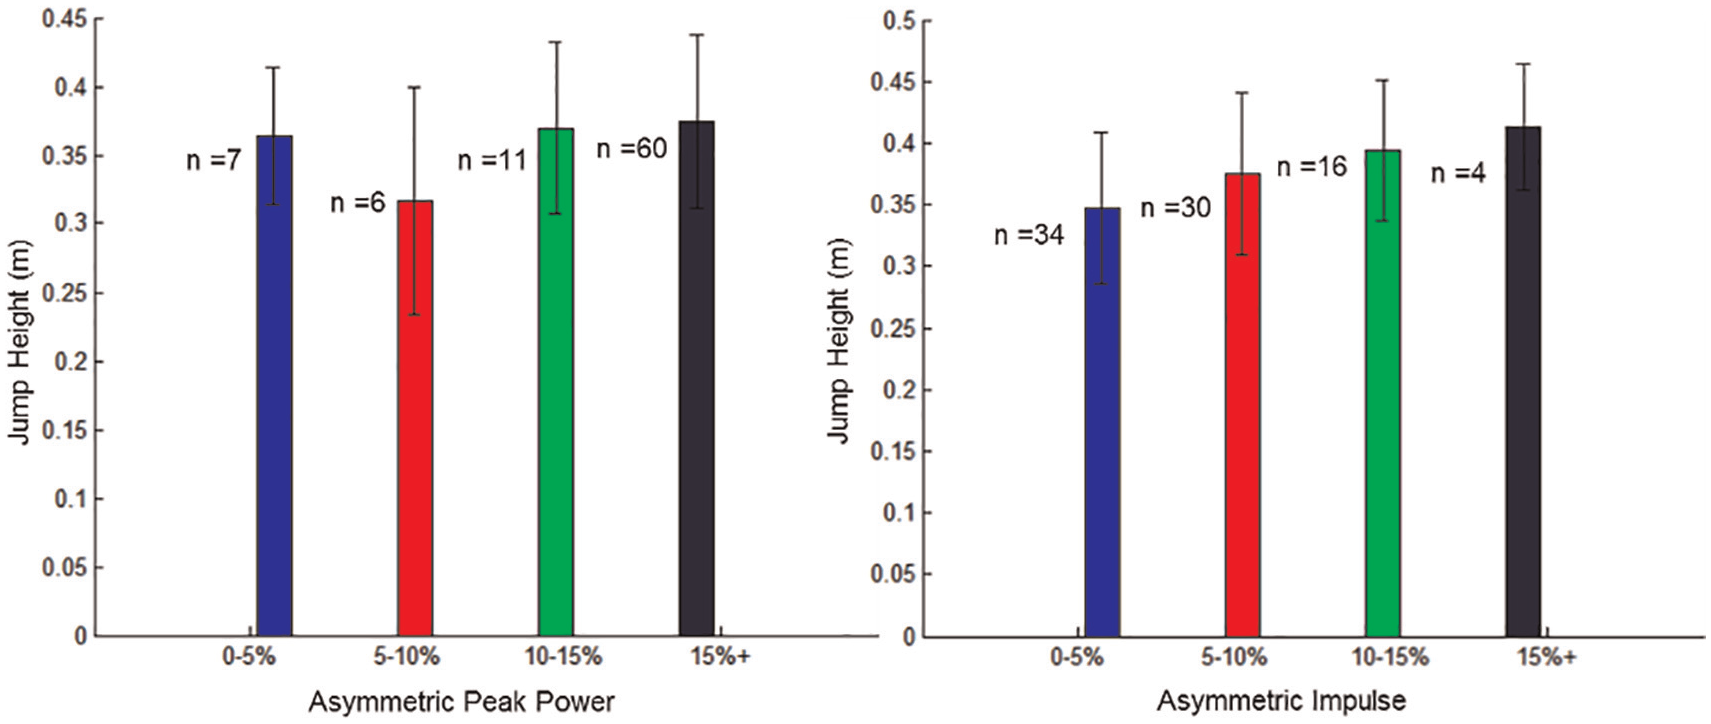
Jump height arranged by: (a) asymmetric peak power and (b) asymmetric impulse.
Discussion
The primary aim of this study was to quantify the reliability of a number of parameters which represent bilateral asymmetry and shear force production in the CMJ. Twenty-six parameters from the Total analysis had a CV lower than 10%, compared with 21 of the Asymmetric parameters. Asymmetric temporal parameters showed a lower CV (0.2%–6%) compared with equivalent parameters from the Total analysis (6%–10.2%). Similarly, peak force, eccentric force and concentric force showed a lower CV in the Asymmetric (1.5%–3.7%) compared with the Total (3.9%–8.4%) analyses. This suggests that these parameters may be more consistent in Asymmetric than Total CMJ performance.
Parameters using or derived from the velocity trace (i.e. vTO, PV, PP, tConcExt, PPbw, tminV, minPos, tPV, minV and sTO) showed a higher CV in the Asymmetric analysis compared with the Total analysis. Velocity is calculated by integrating the acceleration trace, which is the force trace divided by the body mass. In an Asymmetric analysis, the mass on each platform is not constant (see Figure 3). For this analysis, the static weight distribution was used to determine the proportion of bodyweight on each platform. However, the weight distribution was not constant throughout the exercise, which would introduce errors into the derived velocity trace. The assumption of the static weight distribution being constant is the main source of the variability in parameters derived from the velocity trace in the Asymmetric analysis. The results indicate that temporal, kinetic and impulse terms, rather than terms which depend upon static parameters, should be used when evaluating and expressing quantitative measures of asymmetry.
The secondary aim of this study was to investigate the relationship between asymmetric, shear parameters and vertical CMJ performance. A strong positive relationship was observed between impulse in the x-axis (i.e. lateral impulse) and Total impulse in the z-axis (i.e. vertical). Furthermore, a weak relationship was observed when impulse in the x-axis was expressed as a percentage of Total impulse in the z-axis. These findings suggest that in order to maximise the Total impulse in the z-axis, athletes also produce an impulse in thex-axis from each foot in equal magnitude, but opposing directions.
The hypothesis that an increase in asymmetry would result in a decrease in CMJ performance would indicate that negative correlations would be expected between Asymmetric parameters and performance metrics. However, no significant negative relationships were found between jump height and Asymmetric parameters. Conversely, significant but weak positive correlations were found between jump height and Asymmetric impulse and Asymmetric weight distribution. This suggests that asymmetry did not adversely affect jump height.
McLellan et al. 16 showed that rate of force development parameters are important in determining CMJ height. In the present study, the Rate of force variables (i.e. aRFD50, aRFD100 and aRFD150) showed negative correlations with Asymmetric time of total extension (tTotalExt), meaning that the Rate of force production is reduced as the extension duration is increased or vice versa. Since temporal differences between the right and left side may be caused by characteristics such as poor coordination, Asymmetric variations can be targeted and reduced by introduction of specific training exercises, specified by the strength and conditioning coach. Therefore, if an athlete improves their temporal asymmetry, they should be able to increase their total rate of force production and resulting jump height.
A number of Asymmetric variables produced positive correlations with their Total performance variable counterparts. For example, Asymmetric peak concentric force was positively correlated (weak R = 0.34) with peak concentric and (weak R = 0.37) peak force. Similarly, Asymmetric peak force was positively correlated (moderate R = 0.40) with the Total rate of force development and the rate of force parameters at 50 ms (moderate R = 0.41), 100 ms (weak R = 0.36) and 150 ms (weak R = 0.28) (aRFDT, aRFD50-150). It is unlikely that these weak positive correlations are indicative of an increase in asymmetry directly enhancing performance variables in a CMJ. It is more likely that this relationship is an artefact of the sampling distribution, rather than a genuine relationship. However, Bell et al. 20 found that one of the highest jumps in their study (jump height = 51 cm) was from an athlete who had a large asymmetry (>15%). Whilst no obvious outliers were present in the group of athletes who participated in this study, the relatively small sample size (n = 15) may contribute to these counter intuitive results.
The data presented in this paper suggests that asymmetry alone does not determine CMJ performance. However, this could be due to differences in the sample population. Eight sprint athletes and seven high jump athletes were used, of which four were female. The sample number was deemed too low to subdivide athletes based on gender or sporting background, but these factors may have had an influence on results. Furthermore, the low number of trials performed per athlete (total of six CMJs) was too low to investigate intra-athlete correlations between asymmetry and performance. The number of trials obtained per session is limited due to external factors, such as fatigue and motivation. Thus, a longitudinal study is in progress to monitor individual athletes over a sustained period of time to investigate intra-athlete correlations. Additionally, further work with more homogeneous participant groups is required to develop discipline and gender specific recommendations. Despite limitations, the research presented in this paper may serve as a method for further assessment.
Practical implications
When assessing asymmetry in strength and conditioning exercises, practitioners should express data in ratio form (e.g. equation (5)) rather than interval form. This allows typical reliability to be calculated, which enables the practitioner to determine whether a significant improvement has been achieved. Asymmetric parameters using or derived from the velocity trace (
Footnotes
Declaration of conflicting interests
The author(s) declared no potential conflicts of interest with respect to the research, authorship, and/or publication of this article.
Funding
The author(s) received no financial support for the research, authorship, and/or publication of this article.