
Abstract
Background:
There is a great potential for nitric oxide (NO) eluting biomaterials in biomedical applications. These include the development of cardiovascular implants, wound healing products, or applications in cancer and respiratory therapy. While the potential of these materials as a therapy is becoming clearer, the real-time monitoring of NO is not easy and the success in the development of such materials depends on the accurate quantification of NO release.
Method:
To emphasize on the importance of a measurement technique on the outcome of an experiment, we compared total NO released from S-nitroso-N-acetyl-
Results:
We found that the total amount of NO measured by the amperometric technique was 35.8% of the theoretical amount. Similarly, on measuring NO release from the bypass grafts, we demonstrated that the chemiluminesence technique detected NO at a relatively higher level.
Conclusions:
The results of this study clearly demonstrate the relative difference between analysis techniques for accurate NO detection that can be applied to distinct experimental models associated with NO-eluting cardiovascular implants.
Introduction
The physiological and regulatory roles of nitric oxide (NO) influence nearly every organ and tissue of the human body. This role has led to the development of exogenous sources of NO as therapeutic agents [Carpenter and Schoenfisch, 2012; Riccio and Schoenfisch, 2012]. Different delivery systems of NO donors with examples of polymeric scaffolds, microcarriers and nanocarriers have been developed in recent years for cancer therapy, wound healing and as antithrombogenic cardiovascular biomaterials, as well as antimicrobial coatings for biomedical devices [Handa et al. 2014; Li and Lee, 2010; Lu et al. 2013; de Mel et al. 2012; Stevens et al. 2010]. For example, there is a great interest in developing NO-eluting cardiovascular implants such as bypass grafts in order to optimize blood–material interactions [de Mel et al. 2011; Naghavi et al. 2013]. The efficacy of such systems depends on delivering physiological dosages in a controlled manner, effectively over a period of time to the target tissues.
The biological effect of NO is concentration dependent and usually spans the picomolar to micromolar range in physiological environments [Hall and Garthwaite, 2009]; for example, in the vasculature, NO is released at fluxes ranging from 0.5 mol/cm2/min to 4 × 10⁻¹⁰ mol/cm2/min, conveying thromboresistant properties to the blood vessels [Vaughn et al. 1998]. Hence, in designing NO-releasing cardiovascular implants, the rate and the amount of NO released from the surface of blood contact under physiological conditions should be studied in detail so that NO would be solely performing a protective role and not exerting cytotoxic or desensitization of the host tissue. An effective analytical technique that can accurately quantify the rate of production and duration of NO release over time, which mimic dynamic physiological conditions, is therefore highly desirable in developing a functional material/surgical implant that presents the benefits of NO.
Our group recently reviewed different strategies and delivery systems of diazeniumdiolate (NONOates) and S-nitrosothiol (RSNO) donors, incorporated polymeric materials, and microparticles and nanoparticles used in the development of cardiovascular implants such as stents and bypass grafts [Naghavi et al. 2013]. Depending on the sensitivity of the measurement method used for each system, the rate and the duration of NO release varies with key differences in reporting data, making comparison between the systems very difficult. For example, the release rates have been reported in parts per billion per mg (ppb/mg), nmol/cm2/min, mass/surface area and % total release [Coneski and Schoenfisch, 2012; Naghavi et al. 2013]. There is a need for clarity over NO release profiles to quantify accurately the total dosage of NO that is available to a localized area of a physiological system of interest.
Much research to date has employed a range of methods to measure NO release, some of which include the Griess assay [Mowery et al. 2000; Zhang et al. 2002], chemiluminescence [Coneski et al. 2011; Riccio et al. 2012] and electrochemical techniques [Frost et al. 2002; Jiang et al. 2013]. To establish which methodology is more suitable for a particular scaffold and application, it is essential to understand the properties of each technique such as sensitivity, response time, detection limit and selectivity for NO over other species [Hetrick and Schoenfisch, 2009]. The Griess assay is a simple technique which indirectly measures NO based on the detection of nitrite (NO2−), a product of NO’s autooxidation. However, the detection limit of the Griess reagent is approximately 0.5 µM and its sensitivity varies depending on the solution composition NO is measured in, which results in inconsistent NO release reports [Bryan and Grisham, 2007; Tsikas, 2007].
In contrast, the chemiluminescence technique provides direct detection of very low concentrations of NO over extended time periods. The detection range of chemiluminescence varies from 0.5 ppb to 500 parts per million (ppm) and, due to the real-time monitoring of NO and the minimal response to interfering species, it is known as a very accurate and reliable technique [Coneski and Schoenfisch, 2012; Hetrick and Schoenfisch, 2009].
Electrochemical sensors are another direct technique which their low cost, ease of fabrication, and ability to measure low concentrations of NO, as well as their dynamic linear that ranges from 0.2 nM to 4.0 µM, has made them promising modes of NO detection in almost any experimental setting [Coneski and Schoenfisch, 2012; Shin et al. 2008]. For example, they have proven flexible when monitoring in situ NO release from tubular polymeric structures under a hemodynamic condition [Coneski and Schoenfisch, 2012; de Mel et al. 2014]. In addition, due to their spatial and temporal resolution and their ability to be miniaturized, electrochemical sensors more than any other detecting method provide the parameters essential for the in vivo NO measurement in challenging biological milieus from sources as small as single cells to more complex environments such as blood and brain [Coneski and Schoenfisch, 2012; Privett et al. 2010]. However, the sensitivity and selectivity of electrochemical sensors can widely vary depending on the permselective membrane used in the electrode design. Care must be therefore taken to choose a sensor that is selective for NO over numerous interfering species to minimize erroneous in reporting data [Privett et al. 2010].
Based on these differences, Schoenfisch’s group recently compared the NO release profile from a diazeniumdiolated NO donor and a NO-releasing xerogel in a series of biological media to highlight the importance of a measurement technique on the accuracy of NO analysis [Hunter et al. 2013]. According to their findings, there was a significant discrepancy between analysis techniques, with the Griess assay being the most inaccurate in many of the sample media and chemiluminescence providing the most precise kinetic information in most of the samples. This finding emphasizes the importance of measuring NO payload from NO donors for the accurate assumption of payload versus total release.
Our group has developed a family of nanocomposite polymers suitable for biomedical applications ranging from small conduits for lacrimal ducts to tracheal implants and nasal/ear reconstruction [Chaloupka et al. 2011; Jungebluth et al. 2011; Nayyer et al. 2014]. It is based on the attachment of polyhedral oligomeric silsesquioxanes (POSS) nanoparticles as pendant chain functional groups to a poly(carbonate urea)urethane (PCU) backbone. POSS-PCU has shown promising mechanical and antithrombogenic properties for cardiovascular applications such as small diameter (5 mm) vascular grafts [de Mel et al. 2014; Ahmed et al. 2011] and heart valves [Rahmani et al. 2012].
We recently reported on the development of NO-releasing POSS-PCU bypass grafts as a suitable method of enhancing the antithrombogenic properties of this material. The S-nitrosothiol type NO donor, S-nitroso-N-acetyl-
Materials and methods
All chemicals and reagents were purchased from Sigma Aldrich, Gillingham, UK, unless otherwise specified.
SNAP synthesis
SNAP was synthesized following previously published protocols [Chipinda and Simoyi, 2006; Riccio et al. 2011]. Briefly, N-acetyl-d-penicillamine (NAP) (0.478 g, 2.5 mmol) was dissolved in 5 ml methanol. While stirring, 5 ml 1 N HCl and 0.5 ml concentrated H2SO4 were added to the solution and the solution was ice-cooled. Sodium nitrite (0.345 g, 5 mmol) was dissolved in 2 molar excess in 5 ml deionized water containing ethylenediaminetetraacetic acid (EDTA) (1 mM) and then added to the NAP solution. The mixture was stirred on ice in the dark for 30 min and the green crystalline product was formed on the wall of the reaction flask. The product was collected by filtration under suction, washed with EDTA solution and vacuum dried for 30 min while shielded from light.
Preparation of SNAP solution
Standard stock SNAP solution (100 µM) was prepared by dissolving 5.5 mg SNAP in 250 ml ultrapure high-pressure liquid chromatography (HPLC) grade water containing EDTA (1 mM). A series of dilutions were prepared from the standard solution to yield the final concentrations of 50, 25, 10, 5 and 1 µM. The solutions were prepared fresh every time prior to the experiment and kept on ice while shielded from light.
Synthesis of POSS-PCU nanocomposite polymer
The synthesis of POSS-PCU nanocomposite polymer has been described in detail previously [Sarkar et al. 2009]. Briefly, polycarbonate polyol, 2000 Mwt (Bayer MaterialScience GmbH) and trans-cyclohexanechloroydrinisobutyl-silsesquioxane (Hybrid Plastics Inc., Hattiesburg, MS, USA) were placed in a 250 ml reaction flask equipped with a mechanical stirrer and nitrogen inlet. The mixture was heated to 135°C to dissolve the POSS cage into the polyol and then cooled to 70°C. Flake 4,4′-methylenebis(phenyl isocyanate) (MDI) was added to the polyol blend and then reacted, under nitrogen, at 75–85°C for 90 min to form a prepolymer. Dimethylacetamide (DMAC) was added slowly to the prepolymer to form a solution which was then cooled to 40°C. Chain extension of the prepolymer was carried out by the dropwise addition of ethylenediamine in DMAC to form a solution of POSS-modified polycarbonate urea urethane (POSS-PCU) in DMAC.
Incorporation of SNAP into POSS-PCU
The SNAP-POSS-PCU polymer was prepared by passively incorporating SNAP into the polymer at 0.25, 0.5, 1, 2 and 3 weight percent (wt%) of the total POSS-PCU solution. The relevant mass weight of SNAP was first dissolved in DMAC, which is the solvent used for the synthesis of POSS-PCU. This solution was added to POSS-PCU and mixed using a homogenizer for 5 min at 1 min intervals while kept on ice and shielded from light at all time. The polymer mixture was degassed using a vacuum chamber degassing pump and prepared for bypass graft fabrication.
Manufacturing NO-eluting POSS-PCU small diameter cardiovascular bypass graft
Small diameter (5mm) grafts were fabricated using a polymer extrusion phase inversion technique, documented in detail elsewhere [Ahmed et al. 2011, 2014; de Mel et al. 2014; Sarkar et al. 2009]. In brief, 4 g of polymer containing the relevant wt% of SNAP was injected into the polymer chamber of a benchtop automated phase inversion polymer extruder and driven vertically through a 5 mm stainless steel mandrel and out via a 7 mm exit aperture into a vertical column of coagulant solution which was placed below the polymer chamber. The coagulant solution contained ice-cold water consisting of phosphate-buffered saline (PBS) (pH = 7.4) and EDTA (1 mM), which was used as a chelating agent to prevent donor decomposition by trace metals during solvent exchange and phase separation. The grafts were kept undisturbed in the coagulant reservoir for 30 min, whereupon solvent exchange with water took place and the polymer crystallized. Thereafter, the grafts were removed from the mandrel and washed further with deionized water containing PBS and EDTA for a period of 1 h. Finally, the grafts were placed in a fresh coagulant solution and left for a period of 15 h until all DMAC was removed. The grafts were shielded from light and kept in the fridge for further use.
Real-time monitoring of NO
Amperometric technique
An ISO-NOP NO detecting sensor (2 mm in diameter) connected to a one-channel free radical NO analyzer (NOA) instrument, Apollo 1000 purchased from WPI (Stevenage, Hertfordshire, UK), was used to measure NO generated from both SNAP solutions and SNAP-POSS-PCU grafts. In advance of the experiment, the voltage potential of 865 mV was applied, and the current and the temperature were set at nano-amplitude (nA) and 37°C, respectively. The instrument was calibrated using a standard solution of NaNO2 with 0.1 M H2SO4 and 0.1 M KI as instructed by the manufacturer. The analogue output was recorded by MacLab data acquisition software (ADI Instruments Ltd, Oxford, UK) and the calibration curve was plotted.
To a dark vial containing 1 ml PBS solution (pH = 7.4) under stirring were added deoxygenated solutions of copper sulfate (CuSO4) (1 ml, 1 µM) and ascorbic acid (1 ml, 1µM). CuSO4 and ascorbate are known to be a catalyst for RSNO decomposition. 1 ml deoxygenated solution of SNAP at the relevant concentration was injected into the catalytic solution and NO released was measured. The POSS-PCU vascular graft incorporated SNAP at the relevant wt% was also placed in a dark vial containing a standard solution of PBS under stirring. The probe was located vertically inside the vascular graft and equilibrated in PBS to obtain steady current background measurements before proceeding with the experiment. As soon as the current showed a stable baseline, the deoxygenated solutions of CuSO4 (1 ml, 1 µM) and ascorbic acid (1 ml, 1 µM) were injected to the vial to facilitate the decomposition of SNAP from the polymer. NO release was measured over time and NO concentration was calculated according to the calibration curve. A minimum of three measurements was performed for each sample and values were reported as mean ± standard deviation (SD).
Chemiluminescence technique
A Sievers chemiluminescence nitric oxide analyzer (NOA) model 280i (Boulder, CO) was used for the real-time NO release measurement. Calibration was performed before each experiment using a Sievers NO zero filter and 90 ppm NO gas in N2. The value for converting instrument response (ppb) to moles of NO was obtained through the conversion of known concentrations of nitrite standards to NO in a 1% w/v solution of KI in acetic acid. The flow rate of nitrogen was set to 200 ml/min with a cell pressure of 7.5 torr and an oxygen pressure of 6.0 pounds per square inch (psi). Catalytic solutions of CuSO4 (1 ml, 1 µM) and ascorbic acid (1 ml, 1 µM) were injected into the reaction flask containing 1 ml PBS solution (pH = 7.4) and a stream of nitrogen was bubbled into the solution. The vessel was shielded from light and the temperature was set at 37°C; 1 ml deoxygenated SNAP solution at the relevant concentration was introduced into the flask and the NO released was continuously swept from the headspace of the reaction flask and purged with the bubbling nitrogen into the NOA. The release of NO from SNAP-POSS-PCU bypass grafts was measured likewise as explained above following placement of the grafts into deoxygenated PBS and injection of the deoxygenated catalytic solutions of CuSO4 and ascorbic acid to the reaction vessel. To evaluate the effect of heat on NO release profile, NO release from 0.25 and 3 wt% grafts was measured on exposure of the grafts to PBS (pH = 7.4) at 37 °C.
A minimum of three measurements were performed for each sample and values were reported as mean ± SD.
SNAP leaching study
The SNAP leaching study was performed on the coagulant solutions in which the grafts were fabricated to quantify the amount of SNAP leachate from the polymer. This method was adapted from that of Jolish and colleagues [Joslin et al. 2013]. A series of standard solutions of SNAP (1 nM to 10 μM) in PBS (pH = 7.4) and EDTA (1 mM) was prepared and the calibration curve plotted. The coagulant solutions were analyzed after soaking the grafts for 30 min, 1 h and 15 h periods of time. After filling a 1 ml quartz cuvette with 300 μl of the relevant coagulant solution, the absorbance was measured at 339 nm, which is the λmax associated with S-NO moiety of the SNAP molecule. All readings were performed on a V-630 UV–visible spectrophotometer (JASCO UV-Vis V-630, JASCO CO. Ltd, Tokyo, Japan).
A minimum of six measurements were performed for each sample and data presented as mean ± SD.
Surface wettability assessment
Measurements of static water contact angle were carried out on the external and the cross-sectional surfaces of the test samples by the captive bubble method according to a standard procedure using a KRÜSS DSA 100 (KRÜSS, Hamburg, Germany). Measurements were taken on 6 further occasions for each of the prepared samples (n = 4). The angle between the surface of the bubble and the polymer was measured using circular algorithm technique, implemented in the KRÜSS drop shape analysis software. In this particular system, a contact angle θ < 90º indicates hydrophobicity and an angle θ > 90º indicates hydrophilicity.
Data collection and statistical analysis
All experimental results were analyzed using GraphPad Prism 6.0c software. All data were expressed as mean ± SD and analyzed for statistical significance by one-way analysis of variance (ANOVA) using Bonferroni post hoc tests, with significance accepted at the 5% level.
Results
NO release from SNAP solution
The total NO release from SNAP solution at different concentrations analyzed under physiological conditions (pH = 7.4 and 37°C) was examined via both amperometric and chemiluminescence techniques (Table 1) and compared with the theoretical amount of NO for that concentration. As expected, increasing the SNAP concentration from 1 to 50 µM resulted in a significant increase in the total amount of NO detected; chemiluminescence resulted in the totals ranging from 0.90 ± 0.01 to 47.40 ± 0.67 nmol (p < 0.001) and amperometric results varied from 0.39 ± 0.16 to 19.10 ± 1.10 nmol (p < 0.0001), although there was no significant difference between 1 and 5 µM solutions. The solutions measured via chemiluminescence technique resulted in the greatest total NO release, which was approximately 91.88% ± 2.79 of the theoretical amount for all concentrations. The total amount of NO measured via amperometric method for all concentrations was nearly 35.84% ± 3.18 of the theoretical amount (p < 0.001) and 39% of that measured by chemiluminescence detection (p < 0.001).
Total NO released from the SNAP solution (1 ml) at different concentrations exposed to catalytic Cu2+/ascorbic acid solutions at physiological conditions (in PBS at pH = 7.4 and 37°C) determined via amperometric and chemiluminescence techniques. Theoretical amounts of SNAP for the relevant concentrations are also presented. Values are reported as mean ± SD for n = 3.

NO, nitric oxide; PBS, phosphate-buffered saline; SD, standard deviation; SNAP, S-nitroso-N-acetyl-d-penicillamine.
NO release from SNAP-POSS-PCU bypass grafts
Table 2 compares the total amount of NO released from SNAP-POSS-PCU grafts (2 cm in length, 5 mm internal diameter, surface area = 120.95 cm2) at different wt%, measured via amperometric and chemiluminescence, with the theoretical amount of NO for that wt%. In both techniques, while no significant difference was observed between 2 and 3 wt% grafts, an increase in the amount of SNAP from 0.25 to 2 wt% showed that the total NO payload scaled proportionally with the amount of incorporated SNAP into the polymer. For example, total NO released measured via chemiluminescence ranged from 271.35 ± 29.67 to 1424.79 ± 22.23 nmol (p < 0.0001), being 34.95 ± 10.02% of the theoretical amount of SNAP incorporated into the polymer (p < 0.001) and those detected by the amperometric method yielded totals that were 14.11 % ± 5.25 of the theoretical payload (p < 0.001), ranging from 117.29 ± 58.92 to 474.85 ± 44.82 nmol (p < 0.0001). Comparison of the total NO release from both techniques revealed that chemiluminescence detected NO at a significantly higher level (~40%) than amperometric method (p < 0.001).
Total NO released from the SNAP-POSS-PCU bypass grafts (2 cm in length, 5 mm internal diameter, surface area = 120.95 cm2) at different wt%, exposed to catalytic Cu2+/ascorbic acid solutions at physiological conditions (in PBS at pH = 7.4 and 37°C) determined via amperometric (A) and chemiluminescence (B) techniques. Theoretical amounts of SNAP for the relevant wt% are also presented. Values are reported as mean ± SD for n = 3.

NO, nitric oxide; PBS, phosphate-buffered saline; PCU, poly(carbonate urea)urethane; POSS, polyhedral oligomeric silsesquioxanes; SD, standard deviation; SNAP, S-nitroso-N-acetyl-
Figure 1 compares the flux of NO released from the grafts over time measured by the two techniques of interest. Grafts evaluated for NO release with both techniques demonstrated a burst release within the first few minutes, followed by a nearly steady release over time until all NO was eluted.

Real-time NO release profiles from SNAP-POSS-PCU grafts (2 cm in length, 5 mm internal diameter, surface area = 120.95 cm2) exposed to Cu2+/ascorbic acid in PBS at 37 °C, as measured by (A) chemiluminescence and (B) amperometric methods.
The complete set of kinetic parameters including maximum NO release, [NO]m, time to the maximum release, tmax, NO release half-life (t1/2) and the total release time were also extracted from the NO release profile of SNAP-POSS-PCU (Table 3). A similar trend to the total amount of NO was observed when comparing the maximum NO release from the grafts, where an increase in the amount of SNAP from 0.25 to 2 wt% resulted in the significant increase in [NO]m in both amperometric (p < 0.01) and chemiluminescence (p < 0.0001) methods. However, there was no significant difference observed when comparing 2 and 3 wt% samples. Comparison of the two methods revealed that all grafts measured via chemiluminescence released about 30% higher [NO]m than the ones measured by amperometric method (p < 0.001), although no significant difference was observed between the 0.25 and 0.5 wt% samples.
Comparison of NO release parameters measured via amperometric (A) and chemiluminescence (B) techniques from the SNAP-POSS-PCU bypass grafts (2 cm in length, 5 mm internal diameter, surface area = 120.95 cm2) at different wt%. Values are reported as mean ± SD for n = 3.

NO, nitric oxide; PCU, poly(carbonate urea)urethane; POSS, polyhedral oligomeric silsesquioxanes; SD, standard deviation; SNAP, S-nitroso-N-acetyl-
The total release time also scaled proportionally on increasing the wt% of SNAP from 0.25 to 2. However, when wt% was increased to 3%, there was a reduction in release time in both techniques, with amperometric reducing from 4.5 to 3.1 h and chemiluminescence from 10.6 to 7.5 h. A significant difference of p < 0.001 in total release time was observed when comparing the two techniques.
As provided in Table 3, approximately the same level of tmax and t1/2 were observed in both experiments, regardless of the wt% of SNAP incorporated into the polymer.
Figure 2a evaluates the effect of heat on NO release profile from 0.25 and 3 wt% grafts as measured by the chemiluminescence technique for a period of 24 h. Upon exposure of the grafts to simulated physiological conditions (pH = 7.4, 37°C), the samples showed a sustained flux of NO release. The average flux of NO for 0.25 wt% grafts was found to range from 6.29 to 7.12 × 10⁻¹⁰ mol/cm2/min and the 3 wt% samples showed a NO flux of 1.82–2.35 × 10⁻¹⁰ mol/cm2/min.

Real-time NO release profiles from 0.25 and 3 wt% SNAP-POSS-PCU grafts (2 cm in length, 5 mm internal diameter, surface area = 120.95 cm2), measured under physiological conditions (pH = 7.4 and 37°C) by chemiluminescence method for (A) 24 h time period and (B) 5 h time period after 7 days of storage.
Figure 2b shows the NO release flux from the same wt% grafts measured for a 5 h time period, after 7 days of storage; 0.25 wt% grafts showed a flux of 1.76–2.27 × 10⁻¹⁰ mol/cm2/min and 3 wt% grafts released NO with the average flux of 5.18–6.55 × 10⁻¹⁰ mol/cm2/min.
SNAP leaching study
To investigate the amount of donor leachate from the grafts, a SNAP leaching study was performed on the solutions in which the grafts were fabricated at different time points of 30 min, 1 h and 15 h (Table 4). The total SNAP presented in the soaking solution within the first 30 min was significantly higher than the amount of SNAP released during the 1 h and 15 h time points, accounting for nearly 88–98% of the total leachate for 0.25–3 wt% samples (p < 0.001). When considering the total amount of donor leachate, the percentage of SNAP detected during the next 1 h was approximately 1–10% of the total SNAP released for the 0.25–3 wt% grafts. No considerable amount of SNAP leached out from the polymers during the final soaking time.
SNAP leaching study performed on 0.25–3 wt% SNAP-POSS-PCU bypass grafts soaked in the coagulant solution at different time points of 0.5, 1 and 15 h. Data presented as mean ± SD for n = 6.

NO, nitric oxide; PCU, poly(carbonate urea)urethane; POSS, polyhedral oligomeric silsesquioxanes; SD, standard deviation; SNAP, S-nitroso-N-acetyl-
Surface wettability assessment
The external surface of 3 wt% SNAP-POSS-PCU grafts had a significantly higher captive bubble contact angle of 70.76 ± 8.34º compared with 2 wt% and control POSS-PCU grafts (60.58± 3.87º and 39.85 ± 4.11º, respectively)(p < 0.05) (Table 5). However, no significant difference was observed between the water contact angle measurements performed on the cross-sectional surfaces of 2 and 3 wt% SNAP incorporated grafts.
Water contact angle measurements (θ) performed on the external and cross-sectional surfaces of POSS-PCU and SNAP-incorporated POSS-PCU bypass grafts. Data are presented as mean ± SD for n = 6.
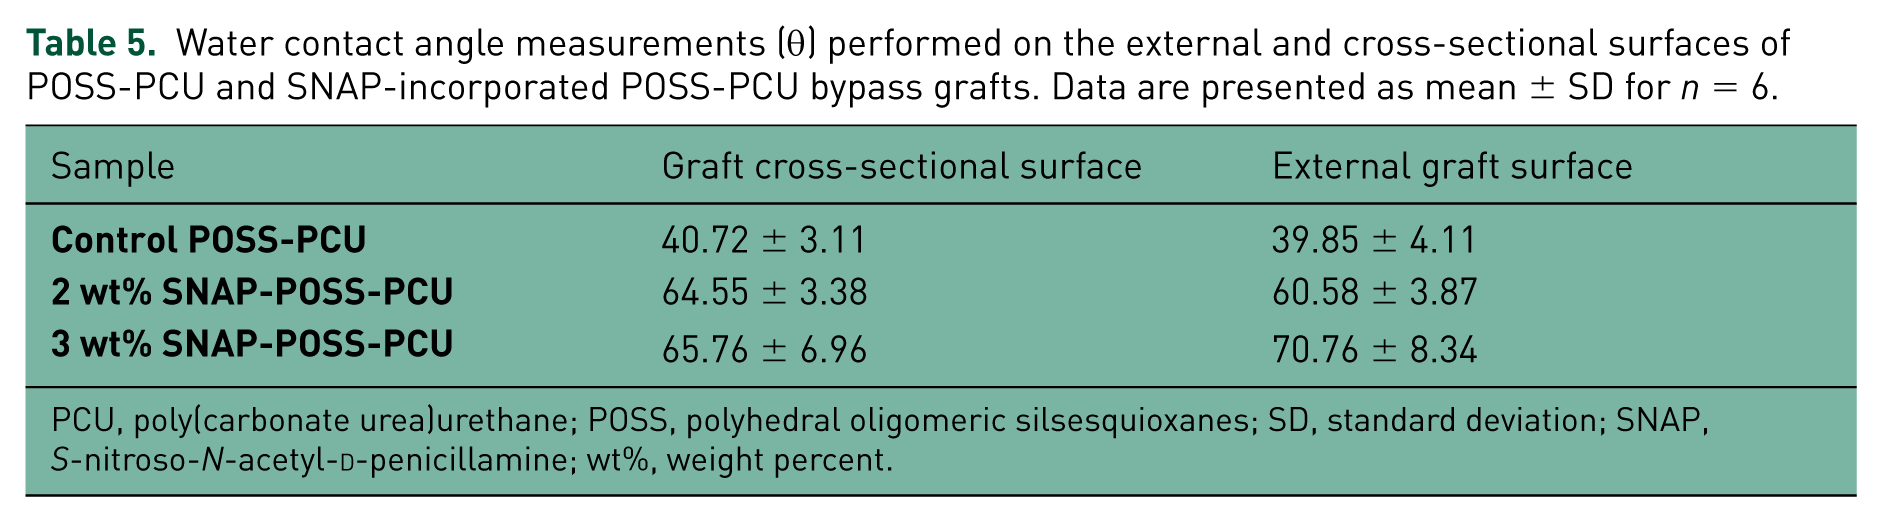
PCU, poly(carbonate urea)urethane; POSS, polyhedral oligomeric silsesquioxanes; SD, standard deviation; SNAP, S-nitroso-N-acetyl-
Discussion
Success in developing NO therapeutic materials depends on the accurate quantification of NO donors and this in turn relies on the analytical technique used for NO measurement. Therefore, to focus on the importance of a measurement technique, we quantified NO released from an S-nitrosothiol type NO donor, SNAP and SNAP incorporated POSS-PCU polymer in the form of bypass grafts, using two different detection methods: amperometric and chemiluminescence.
Chemiluminescence and amperometric techniques were chosen as the preferred methods for comparison in this study since they have been previously reported as the two most reliable and accurate techniques for NO measurement, although showing different sensitivities and detection limits [Coneski and Schoenfisch, 2012]. Chemiluminescence is specific for and sensitive to NO and has a detection limit of approximately 0.5 ppb in PBS [Hetrick and Schoenfisch, 2009]. As shown in Figure 3, when the samples are placed inside the reaction flask, NO released from the sample is carried by the continuous flow of nitrogen to the instrument where it reacts with ozone and produces nitrogen dioxide (NO2) in the excited state. The decay of the NO2 back to the ground state leads to the emission of a photon proportional to the amount of NO released from the sample that is then measured by a photomultiplier tube [Bryan and Grisham, 2007]. As any changes in the cell pressure during the experiment will affect NO release kinetics, care was therefore taken when measuring NO from the samples to keep the cell pressure at a constant rate of 7.5 torr as suggested by the manufacturer.
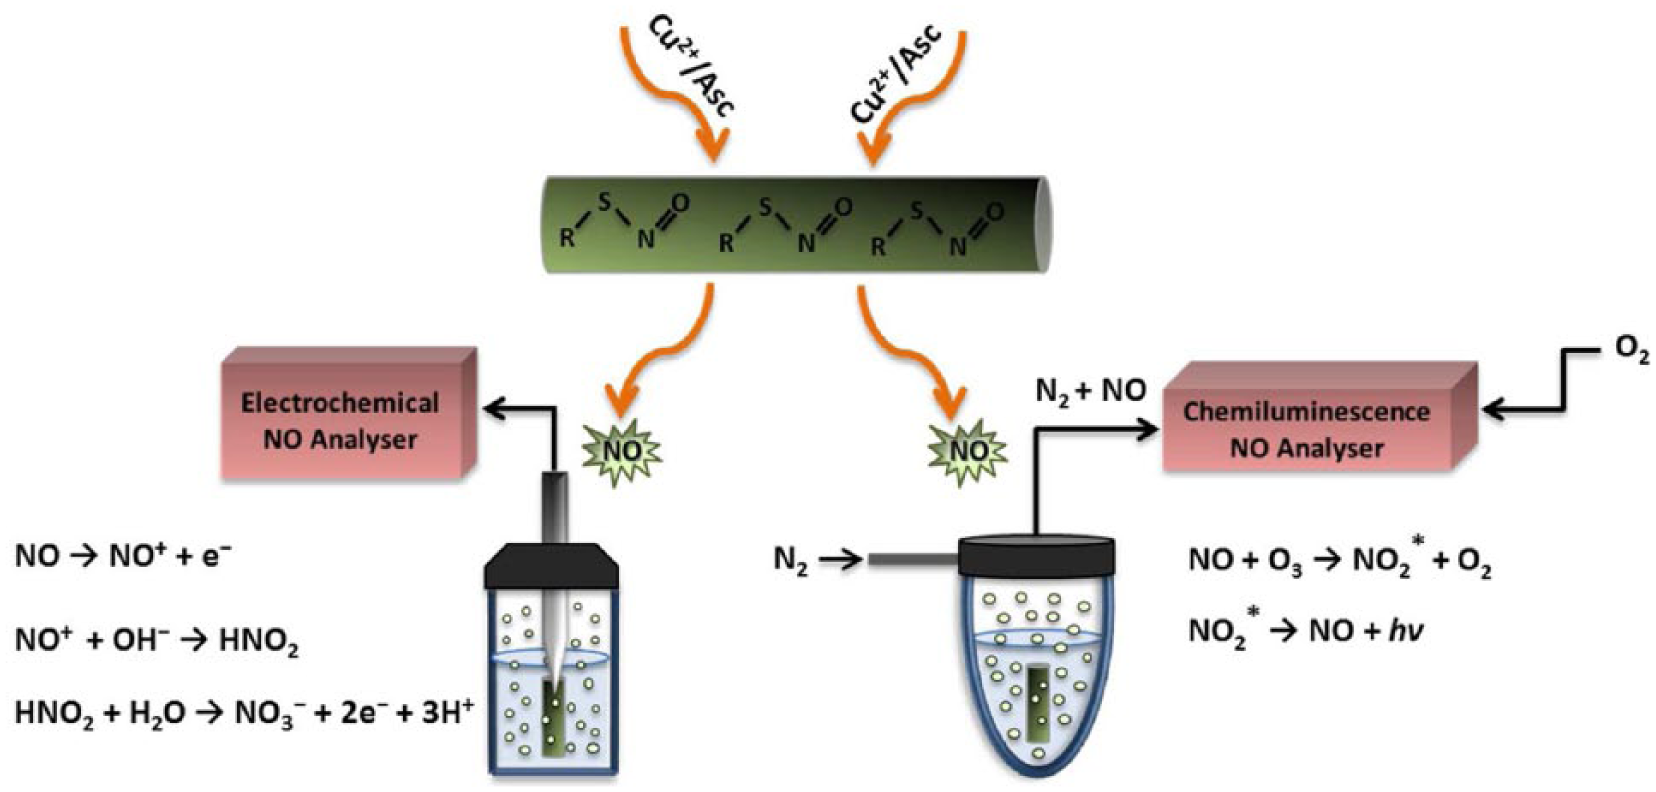
Schematic diagram of amperometric and chemiluminescence based nitric oxide (NO) analyzers. When the NO sensor is placed within the graft lumen, NO released from the graft diffuses through the electrode membrane, where the three-step electrooxidation of NO takes place. The final redox current that is proportional to the amount of NO released from the material is measured by the amperometric machine. In the chemiluminescence system, NO produced from the material is carried by the flow of nitrogen from the flask to the reaction cell, where NO reacts with ozone and the resulting photon produced from the reaction is detected by the machine.
An ideal NO detecting electrode should be selective for NO and insensitive to other interfering species; this is usually obtained by coating the electrode surface with a permselective membrane [Privett et al. 2010]. With the use of a 2 mm platinum coated NO sensor (ISO-NOP, WPI), the amperometric response of both SNAP solution and SNAP-incorporated polymer was evaluated. WPI’s ISO-NOP sensors are designed with a unique membrane surface that enables NO detection while eliminating a numerous range of interfering species such as ascorbic acid, nitrogen peroxide and nitrite. They exhibit sensitivity of 2 pA/nM with the response time of less than 5 s and have the lowest detection limit of approximately 1 nM. When the voltage potential is set at 865 mV versus Ag/AgCl, NO released from the donor diffuses through the gas permeable membrane and oxidizes to NO3– through a three-electron oxidation step, leading to the production of a redox current that is proportional to the amount of NO released from the material (Figure 3).
The experimental designs used here were meant to be distinct as they were intended to simulate conditions that are specific to the applications of the two representative detection methods. Thus, they were used as in their original setup. In particular, there are numerous occasions that require the detection of NO in the absence of a constant stream of nitrogen such as in anastomosed NO-releasing cardiovascular implant in in vivo experimental samples in the presence of proteins (the presence of continuous flow of nitrogen will lead to frothing/foaming).
As a basis for comparison between the two distinct methods over NO detection, we first determined the total NO payload from the SNAP solution at different concentrations and compared them with the theoretical amount of NO for that specific concentration. Before the SNAP solution was introduced to the reaction flasks, aqueous solutions of CuSO4 and ascorbic acid were utilized to initiate NO release. A major mechanism of RSNO decomposition is mediated through catalytic breakdown using Cu2+, which involves the reduction of Cu2+ to Cu+ through reducing agents such as ascorbic acid or trace thiolate anion present in the solution [Frost and Meyerhoff, 2005; Hwang and Meyerhoff, 2008; Wang et al. 2002].
As shown in Table 1, while the chemiluminescence results showed NO payloads that were not significantly different from that of theoretical amount, NO totals from the amperometric method were only 35.84% of those of theoretical payloads. The significant difference in the total amount of NO release between the two techniques suggests that the analytical technique used for NO measurement plays a crucial role in the availability of NO. We attribute the decrease in NO totals observed with the amperometric technique to the electrode geometry and its lower sensitivity, as well as the potential reaction of NO with oxygen, leading to the formation of NO2 which could be further oxidized to nitrite and nitrate in the oxygenated solutions [Broniowska and Hogg, 2012; Williams, 2003]. Deoxygenating the reaction flask with nitrogen gas will eliminate NO’s propensity to react with oxygen. Although both systems were deoxygenated prior to the experiment, chemiluminescence shows an advantage over amperometric since it is a completely closed system and the NO produced from the sample is carried by a continuously flowing stream of nitrogen to the reaction cell, therefore eliminating any depletion of NO via NO2 formation [Coneski and Schoenfisch, 2012]. In addition, due to the specific geometry and the finite surface area of the electrode, only a portion of NO available in the solution can be measured by the electrode, resulting in lower NO concentrations [Hunter et al. 2013; Privett et al. 2010].
To determine NO release from SNAP-modified POSS-PCU polymer, 2 cm tubular shaped scaffolds (internal diameter = 5 mm, surface area = 120.95 cm2) were placed in the relevant reaction flasks while shielded from light. In the case of amperometric study, previous reports have examined the effect of the electrode distance from a NO source on NO measurement and shown that, by increasing the electrode distance from a NO-releasing surface, the analytical accuracy of the sensor decreases [Hunter et al. 2013]. Therefore, to obtain the maximum response during the experiment, the NO sensor was placed inside the graft lumen as shown in Figure 3 and NO release was measured. Of note, analogous to the solution study, the total NO detected was found to be highly dependent on the measurement technique applied with higher amount observed with chemiluminescence, indicating the differences between these analytical techniques for measuring total NO.
The amount of NO that is ultimately available for release from the grafts is highly dependent on the amount of donor that is incorporated into the material. As such, it is important to realize how varying the donor concentration will affect NO release properties, as well as the leaching of the donor from the polymer. To evaluate this, the amount of SNAP incorporated into POSS-PCU was increased from 0.25 to 3 wt%. When considering the wt% of SNAP incorporated, the % total NO released was such a small percentage of the theoretical SNAP reservoir. In addition, although both techniques showed concentration dependent responses, the relative response towards 2 and 3 wt% was quite different and the average NO totals for 3 wt% was statistically the same as the 2 wt% grafts within error (Table 2). There are some possible factors that could contribute to this response pattern; POSS-PCU is a hydrophobic nanocomposite polymer and has a unique porous structure (Kannan et al. 2006), which led us to hypothesize that NO donors can be retained to a greater degree within the polymer matrix. However, given the hydrophilic nature of SNAP [VanWagner et al. 2013] and the passive modification strategy, there would still be a high possibility for donors to leach out from the polymer during the fabrication process, which involves direct contact with aqueous solution. This was confirmed when measuring the amount of SNAP leachate from the solutions in which the grafts were fabricated (Table 4). Increasing the wt% of SNAP would probably result in more donors migrating to the surface of the polymer and being washed away during the fabrication process. Therefore, the trend in total NO between 2 and 3 wt% could be explained by the mass accommodation of the donor within the polymer matrix; 2 wt% may be the optimum amount to fit inside the surrounding polymeric units, resulting in lower leaching when in contact with aqueous environment compared with 3 wt%. The additional wt% of SNAP may crowd the surrounding polymeric units, pushing the donor out of the polymer and resulting in more donors migrating to the surface of the polymer, which could cause higher leaching levels.
To determine the extent of SNAP leaching from the polymer, a SNAP leaching study was performed at different time points of 0.5, 1 and 15 h in the coagulant solutions in which the grafts were fabricated for all wt% grafts (Table 4). A burst of SNAP was leached from the polymer during the first 30 min, which accounted for nearly 88–98% of the total SNAP loss. Washing the grafts for a further 1 h resulted in 1–10% SNAP leachate; during the final wash, no considerable amount of SNAP was found in the coagulant solution. This shows that the majority of the surface-bound SNAP leaches out of the POSS-PCU polymer during the first 0.5–1 h. Preferred localization of SNAP within POSS-PCU was determined with surface wettability study (Table 5). Reduced hydrophobicity of the polymer was influenced by the SNAP molecule.
Upon exposure of the grafts to the catalytic Cu2+/ascorbic acid solutions, all wt% grafts released NO at fluxes exceeding the physiological NO flux of a natural endothelium, which is between 0.5 and 4 × 10⁻¹⁰ mol/cm2/min. The rapid kinetics of NO release from these materials shows that the catalytic decomposition of S-nitrosothiols is an effective way to quantify the total amount of NO stored in the polymer matrix. The extent of NO fluxes exhibited the same fashion as the total NO measured, with the amperometric method detecting lower NO fluxes within shorter time periods than the chemiluminescence technique (Figure 1).
The effect of the measurement technique on several NO release properties including maximum NO release, [NO]max, time to the maximum release, tmax, half-life, t1/2, and total release time are also presented in Table 3. On the basis of monitoring total release time, samples measured by the amperometric method showed release durations for a short period of 1.44–4.5 h. Meanwhile, grafts measured by chemiluminescence maintained release durations of up to 11 h. The shorter release time observed with the amperometric method is probably due to the difference in the detection limit between the two methods [Coneski and Schoenfisch, 2012]. Analogous to the total NO measured, [NO]max was also significantly affected by the wt% of SNAP incorporated into the polymer. However, the time required to reach that maximum point (tmax) did not change significantly upon increasing wt% of SNAP. Under a given wt% of SNAP incorporated, the trend in [NO]max and tmax was chemiluminescence > amperometric for all concentrations. The difference in [NO]max is somewhat expected given the difference in the nature of the chemiluminescence technique and the amperometric method [Hetrick and Schoenfisch, 2009].
The t1/2 of the material was calculated as the time point needed for SNAP to decrease by half compared with its initial concentration [Shin and Schoenfisch, 2008]. It is important to note that, despite varying NO release totals, approximately the same level of t1/2 was observed regardless of the donor concentration. Such fixed NO release kinetics were expected and denote that of the total amount of NO that is liberated, the kinetics of NO release remains constant and only the amount of NO varies in a given time period [Shin and Schoenfisch, 2008]. Of further note, t1/2 measured by the chemiluminescence strategy was markedly bigger than that measured by the amperometric technique at identical SNAP concentration. This behavior is probably attributed to the difference in response time between the two methods [Taha, 2003].
Upon exposure of the lower and upper range wt% grafts (0.25 and 3 wt%) to simulated physiological conditions in the absence of the catalytic solutions, a steady state NO flux was observed over the 24 h measurement time (Figure 2a). The kinetics of NO release were significantly slower than those measured via catalytic decomposition, where an average flux of 6.29–7.12 × 10⁻¹⁰ mol/cm2/min and 1.82–2.35 × 10⁻¹⁰ mol/cm2/min were observed for the 0.25 and 3 wt% grafts, respectively. This effect is attributed to the thermal decomposition of SNAP, which makes the grafts capable of NO release for a longer time period due to the lower NO fluxes that slowly diminish the SNAP reservoir. These data show that POSS-PCU can provide NO release via both catalytic and thermal decomposition.
To further investigate whether the polymer is capable of storing SNAP over an extended time period, 0.25 and 3 wt% SNAP incorporated grafts were stored in the fridge for a period of 7 days and NO release was measured on the last day for a period of 5 h. As shown in Figure 2b, a sustained flux of 1.76–2.27 × 10⁻¹⁰ mol/cm2/min and 5.18–6.55 × 10⁻¹⁰ mol/cm2/min were observed for the 0.25 and 3 wt% grafts, respectively. It would be of interest for future studies to investigate grafts with prolonged sustained release of NO. Currently we are applying modifications to the chemiluminescence reaction vessel to accommodate and examine a range of cardiovascular implants, which release NO within a pulsatile flow system. Despite the relatively lower sensitivity of amperometric method attributed to its design methodology, which is an apparent limitation, it is important for a specific experimental model in cardiovascular research and therefore an indispensible tool.
Conclusion
Thorough analysis and reporting of NO release is rather complex and depends on a suitable measurement technique, which is compatible to the experimental model of interest. This study presents a comparison of NO release from SNAP solution and a SNAP-incorporated POSS-PCU nanocomposite polymer using amperometric and chemiluminescence techniques. We demonstrated that the chemiluminescence technique detected NO at a higher level than the amperometric method, within the experimental conditions which are applicable to determining NO release from cardiovascular implants.
Footnotes
Funding
We would like to thank Royal Free Charity for their kind support in providing funds to purchase equipment for nitric oxide measurements on which this study is based and which is currently impacting a great number of studies. Authors thank Mr Arnold Darbyshire for his advice on support on this study.
Conflict of interest statement
The authors declare no conflicts of interest in preparing this article.