
Abstract
Objectives:
Heart failure is typically preceded by myocardial hypertrophy and remodeling, which can be concentric due to pressure overload (PO), or eccentric because of volume overload (VO). The molecular mechanisms that underlie these differing patterns of hypertrophy are distinct and have yet to be fully elucidated. Thus, the goal of this work is to identify novel therapeutic targets for cardiovascular conditions marked by hypertrophy that have previously been resistant to medical treatment, such as a pure VO.
Methods:
Concentric or eccentric hypertrophy was induced in rats for 2 weeks with transverse aortic constriction (TAC) or aortocaval fistula (ACF), respectively. Hemodynamic and echocardiographic analysis were used to assess the development of left ventricular (LV) hypertrophy and functional differences between groups. Changes in gene expression were determined by microarray and further characterized with Ingenuity Pathway Analysis.
Results:
Both models of hypertrophy increased LV mass. Rats with TAC demonstrated concentric LV remodeling while rats with ACF exhibited eccentric LV remodeling. Microarray analysis associated eccentric remodeling with a more extensive alteration of gene expression compared with concentric remodeling. Rats with VO had a marked activation of extracellular matrix genes, promotion of cell cycle genes, downregulation of genes associated with oxidative metabolism, and dysregulation of genes critical to cardiac contractile function. Rats with PO demonstrated similar categorical changes, but with the involvement of fewer individual genes.
Conclusions:
Our results indicate that eccentric remodeling is a far more complex process than concentric remodeling. This study highlights the importance of several key biological functions early in the course of VO, including regulation of matrix, metabolism, cell proliferation, and contractile function. Thus, the results of this analysis will inform the ongoing search for new treatments to prevent the progression to heart failure in VO.
Introduction
Heart failure (HF) is highly prevalent in the developed world and places a tremendous burden on healthcare systems [Lloyd-Jones et al. 2010]. HF is generally associated with cardiac hypertrophy, which typically occurs in a concentric or eccentric pattern, depending on the nature of the underlying hemodynamic overload [Grossman et al. 1975]. Cardiac hypertrophy is considered to be an initially adaptive response that compensates for hemodynamic stress but eventually progresses to left ventricular (LV) dilatation and HF [Oka and Komuro, 2008]. The last few decades have witnessed great strides in the treatment of HF, but not all forms of the disease respond equally well to the treatments currently available [Borer and Bonow, 2003]. Conditions associated with eccentric remodeling driven by a pure volume overload (VO), such as mitral regurgitation, seem to be resistant to most mainstay HF treatments [Dell’Italia et al. 1997; Perry et al. 2002]. A greater understanding of the molecular mechanisms that underlie cardiac hypertrophy and remodeling in response to the distinctly different stresses of VO or pressure overload (PO), and how each form is similar and different from the other, will be required to develop new therapies [Houser et al. 2012]. In particular, one of the hallmark differences in both processes is that extracellular matrix (ECM) homeostasis is tilted toward production in PO and degradation in VO [Ryan et al. 2007; Chen et al. 2010, 2011].
Concentric hypertrophy is defined by an increase in the wall thickness to chamber diameter ratio [Lorell and Carabello, 2000] and typically develops in conditions marked by PO and elevated afterload, such as aortic stenosis or hypertension [Grossman et al. 1975]. Individual cardiomyocytes respond to the systolic stress of PO by adding sarcomeres in parallel and increasing cell diameter, and this hypertrophy is often accompanied by profound fibrosis [Houser et al. 2012]. Major indices of cardiac function are maintained during the early compensatory phase of PO despite some diastolic dysfunction, but eventually LV dilatation and systolic failure occur. This condition is commonly modeled in rats with transverse aortic constriction (TAC), which creates a stress similar to that of aortic stenosis.
Eccentric hypertrophy is characterized by a dilation of the LV chamber with cardiomyocyte elongation due to sarcomeres being added in series [Houser et al. 2012]. This definition has been recently challenged by the observation of eccentric LV chamber remodeling without an increase in cardiomyocyte length but with significant loss of interstitial collagen, suggesting the occurrence of cardiomyocyte rearrangement or slippage rather than elongation [Ryan et al. 2007]. A pure VO and eccentric hypertrophy can be induced in rats through the creation of an aortocaval fistula (ACF) [Stumpe et al. 1973], and rats with this intervention demonstrate increased filling pressures with LV wall thinning, dilatation, and HF within 8 weeks [Ruzicka et al. 1994; Brower et al. 1996; Ryan et al. 2007; Wei et al. 2012].
Previous studies have reported differences in gene expression profiles in concentric and eccentric cardiac hypertrophy at various stages in either process [Miyazaki et al. 2006; Toischer et al. 2010]. In the present study, the TAC and ACF models were studied at the formative stages of concentric and eccentric hypertrophy and the preservation of load-dependent ejection-phase indices of LV systolic function were carefully documented. Thus, we examined both processes in a relatively compensated state after achieving the typical divergent patterns of LV remodeling, but before LV systolic and diastolic functional decompensation. The results of our analysis are impressive because, despite apparent functional compensation, there was disparate activation of a variety of molecular pathways that have been implicated in cardiac dysfunction [Stumpe et al. 1973; Strom et al. 2004]. Herein we present results of a whole-genome analysis of rats with either PO or VO due to TAC or ACF, respectively, at the subacute 2-week time point. We found that eccentric remodeling has a particularly extensive involvement of matrix turnover, oxidative metabolism, cell proliferation, and ion handling.
Methods
Ethics statement
This study conforms to the Guide for the Care and Use of Laboratory Animals published by the US National Institutes of Health (NIH Publication No. 85-23, revised 1996), and was approved by the University of Alabama at Birmingham’s Institutional Animal Care and Use Committee. All surgeries were performed under isoflurane anesthesia, and all efforts were made to minimize suffering.
TAC
PO was induced in adult male Sprague–Dawley rats (12 weeks of age, 200–250 g) with TAC as described previously [Strom et al. 2004; Houser et al. 2012]. Rats were anesthetized with isoflurane inhalation (1–2%) and a left thoracotomy was made at the second intercostal space and the ribs retracted. The transverse aorta was exposed by blunt dissection and a 3-0 silk suture was placed around the aorta between the innominate and left common carotid arteries. A piece of 18-gauge needle was laid on the aorta and the suture tied snugly around the vessel and the needle. The needle was then pulled out of the ligation and the ends of the suture trimmed. Retraction was then removed, the ribs closed with 5-0 silk suture, and the skin at the thoracotomy site was closed using metallic clips. TAC sham surgeries were performed in control animals and consisted of the same procedure outlined above without the aortic ligation.
ACF
ACF surgery was performed as described previously in our laboratory to produce VO [Wei et al. 2003, 2012; Ryan et al. 2007]. Adult male Sprague–Dawley rats (12 weeks of age, 200–250 g) underwent general anesthesia with isoflurane inhalation (1–2%). The abdominal cavity was opened via a ventral midline incision. The inferior vena cava (IVC) and aorta were gently exposed and then occluded with finger pressure distal to the renal vasculature and proximal to the bifurcation of the aorta. An 18-gauge short-bevel needle was inserted into the ventral aspect of the aorta and then passed through adjacent medial walls of both vessels into the lumen of the IVC. The needle was withdrawn and the insertion wound in the aorta was closed with a drop of cyanoacrylate glue. Fistula patency was verified visually by swelling of the IVC and by the mixing of bright arterial and dark venous blood in the IVC. The peritoneal cavity was closed using 5-0 chromic gut stitches (Ethicon, Incorporated, Somerville, NJ) and the skin was closed using metallic clips. The control animals, ACF sham, underwent general anesthesia, abdominal incision, and vessel exposure without ACF.
Experimental protocol
TAC, ACF, or sham operations were performed in rats. Then 14 days after surgery, echocardiography and hemodynamics were performed in TAC (n = 11), TAC sham (n = 10), ACF (n = 11), and ACF sham (n = 11). At sacrifice, sections of LV were removed and flash-frozen in liquid nitrogen, stored in RNAlater (Qiagen, Germantown, MD) for RNA extraction, or placed in fixative for immunohistochemical analysis, as detailed in the following.
Echocardiography and hemodynamics
Echocardiography and hemodynamics were performed prior to sacrifice using the Agilent Sonos 5500 system (Philips, Bothell, WA) combined with simultaneous high-fidelity LV pressure catheter recordings (Millar Institute, Houston, TX). With the rat under isoflurane anesthesia, a high-fidelity LV pressure catheter was advanced into the LV cavity via a right carotid cut-down. LV pressure and echocardiography dimensions (wall thickness and chamber diameter) were obtained simultaneously.
LV volume was calculated from traced m-mode LV dimensions using the Teicholz formula [Nagatsu et al. 1994]:
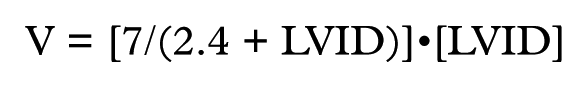
where V = volume and LVID = LV internal dimension.
LV wall stress was calculated from traced m-mode LV dimensions and simultaneous LV pressure data using the equation below.

where LV σ = LV wall stress, LVP = LV pressure, r = LV chamber radius and LVwt = LV wall thickness.
A 2F-combined conductance catheter–micromanometer (Millar, Houston, TX) was advanced retrogradely into the ascending aorta, where arterial pressure waveforms were collected before the catheter was advanced into the LV. Simultaneous pressure and volume measurements were collected at 1000 Hz both at baseline and during reduced loading conditions caused by a transient (3–5 s) occlusion of the IVC at the level of the apex of the heart by a balloon catheter inserted into the right femoral vein. End-systolic and end-diastolic volumes were calculated using the Bullet formula with long- and short-axis dimensions obtained using a B-mode video as described previously in our lab [Marsh et al. 2009]. These values were then used to calibrate the raw data from the conductance catheter. Pressure–volume relations were analyzed using cardiac pressure–volume analysis software (PVAN 3.0; Millar).
RNA extraction and purification
Total RNA for microarray and reverse transcriptase polymerase chain reaction (RT-PCR) analysis was extracted from LV tissue pieces using the Qiagen RNeasy Fibrous Kit (Germantown, MD) per the manufacturer’s protocol. RNA quality was assessed with the Bio-Rad Experion system (Hercules, CA).
Microarray data collection and analysis
Microarray hybridization and intensity data collection were performed as previously reported using Agilent Single-Color 4x44k Rat Whole Genome chips (Palo Alto, CA) on 4 rats per group (except TAC sham, n = 3) [Wagner et al. 2004; Chen et al. 2010, 2011]. Data analysis was performed with GeneSpring 12.1 (Agilent, Palo Alto, CA). A 50th percentile shift was applied to imported data after normalization within and between chips. Genes with significantly altered expression ≥1.5-fold were determined using unpaired t-tests with asymptotic p-value computation. No multiple testing corrections were applied.
Lists of differentially regulated genes were assessed with Ingenuity Pathway Analysis (IPA; Redwood City, CA) as published previously [Chen et al. 2010]. IPA mines the established literature for relationships between genes in the provided data set. Relationships deemed significant by a Fisher’s exact test were output as a network of associated genes. The score for each network considers the total number of network-ready genes in the IPA database, total number of genes in the data set, and the number of genes in the generated network. Descriptions for genes in Tables 5–9 were obtained from GeneCards.org and www.ncbi.nlm.nih.gov/gene.
Real-time PCR validation
RT-PCR was performed on the same RNA samples used for microarray analysis. cDNA was reverse transcribed with the Bio-Rad iScript cDNA Synthesis kit (Hercules, CA) and 26 genes were quantified in animals from various groups (40 total comparisons) using iQ SybrGreen Supermix and the Bio-Rad iCycler (primer sequences shown in Table 1). Standard curves were created with PCR product synthesized with the same primers and iQ Supermix, purified with agarose gel electrophoresis, and isolated via gel extraction with the Qiagen Gel Extraction kit (Germantown, MD). Copy numbers of all targets were normalized by GAPDH expression and fold change was computed for comparison to microarray expression values.
Reverse transcriptase polymerase chain reaction primer sequences.

Immunohistochemistry
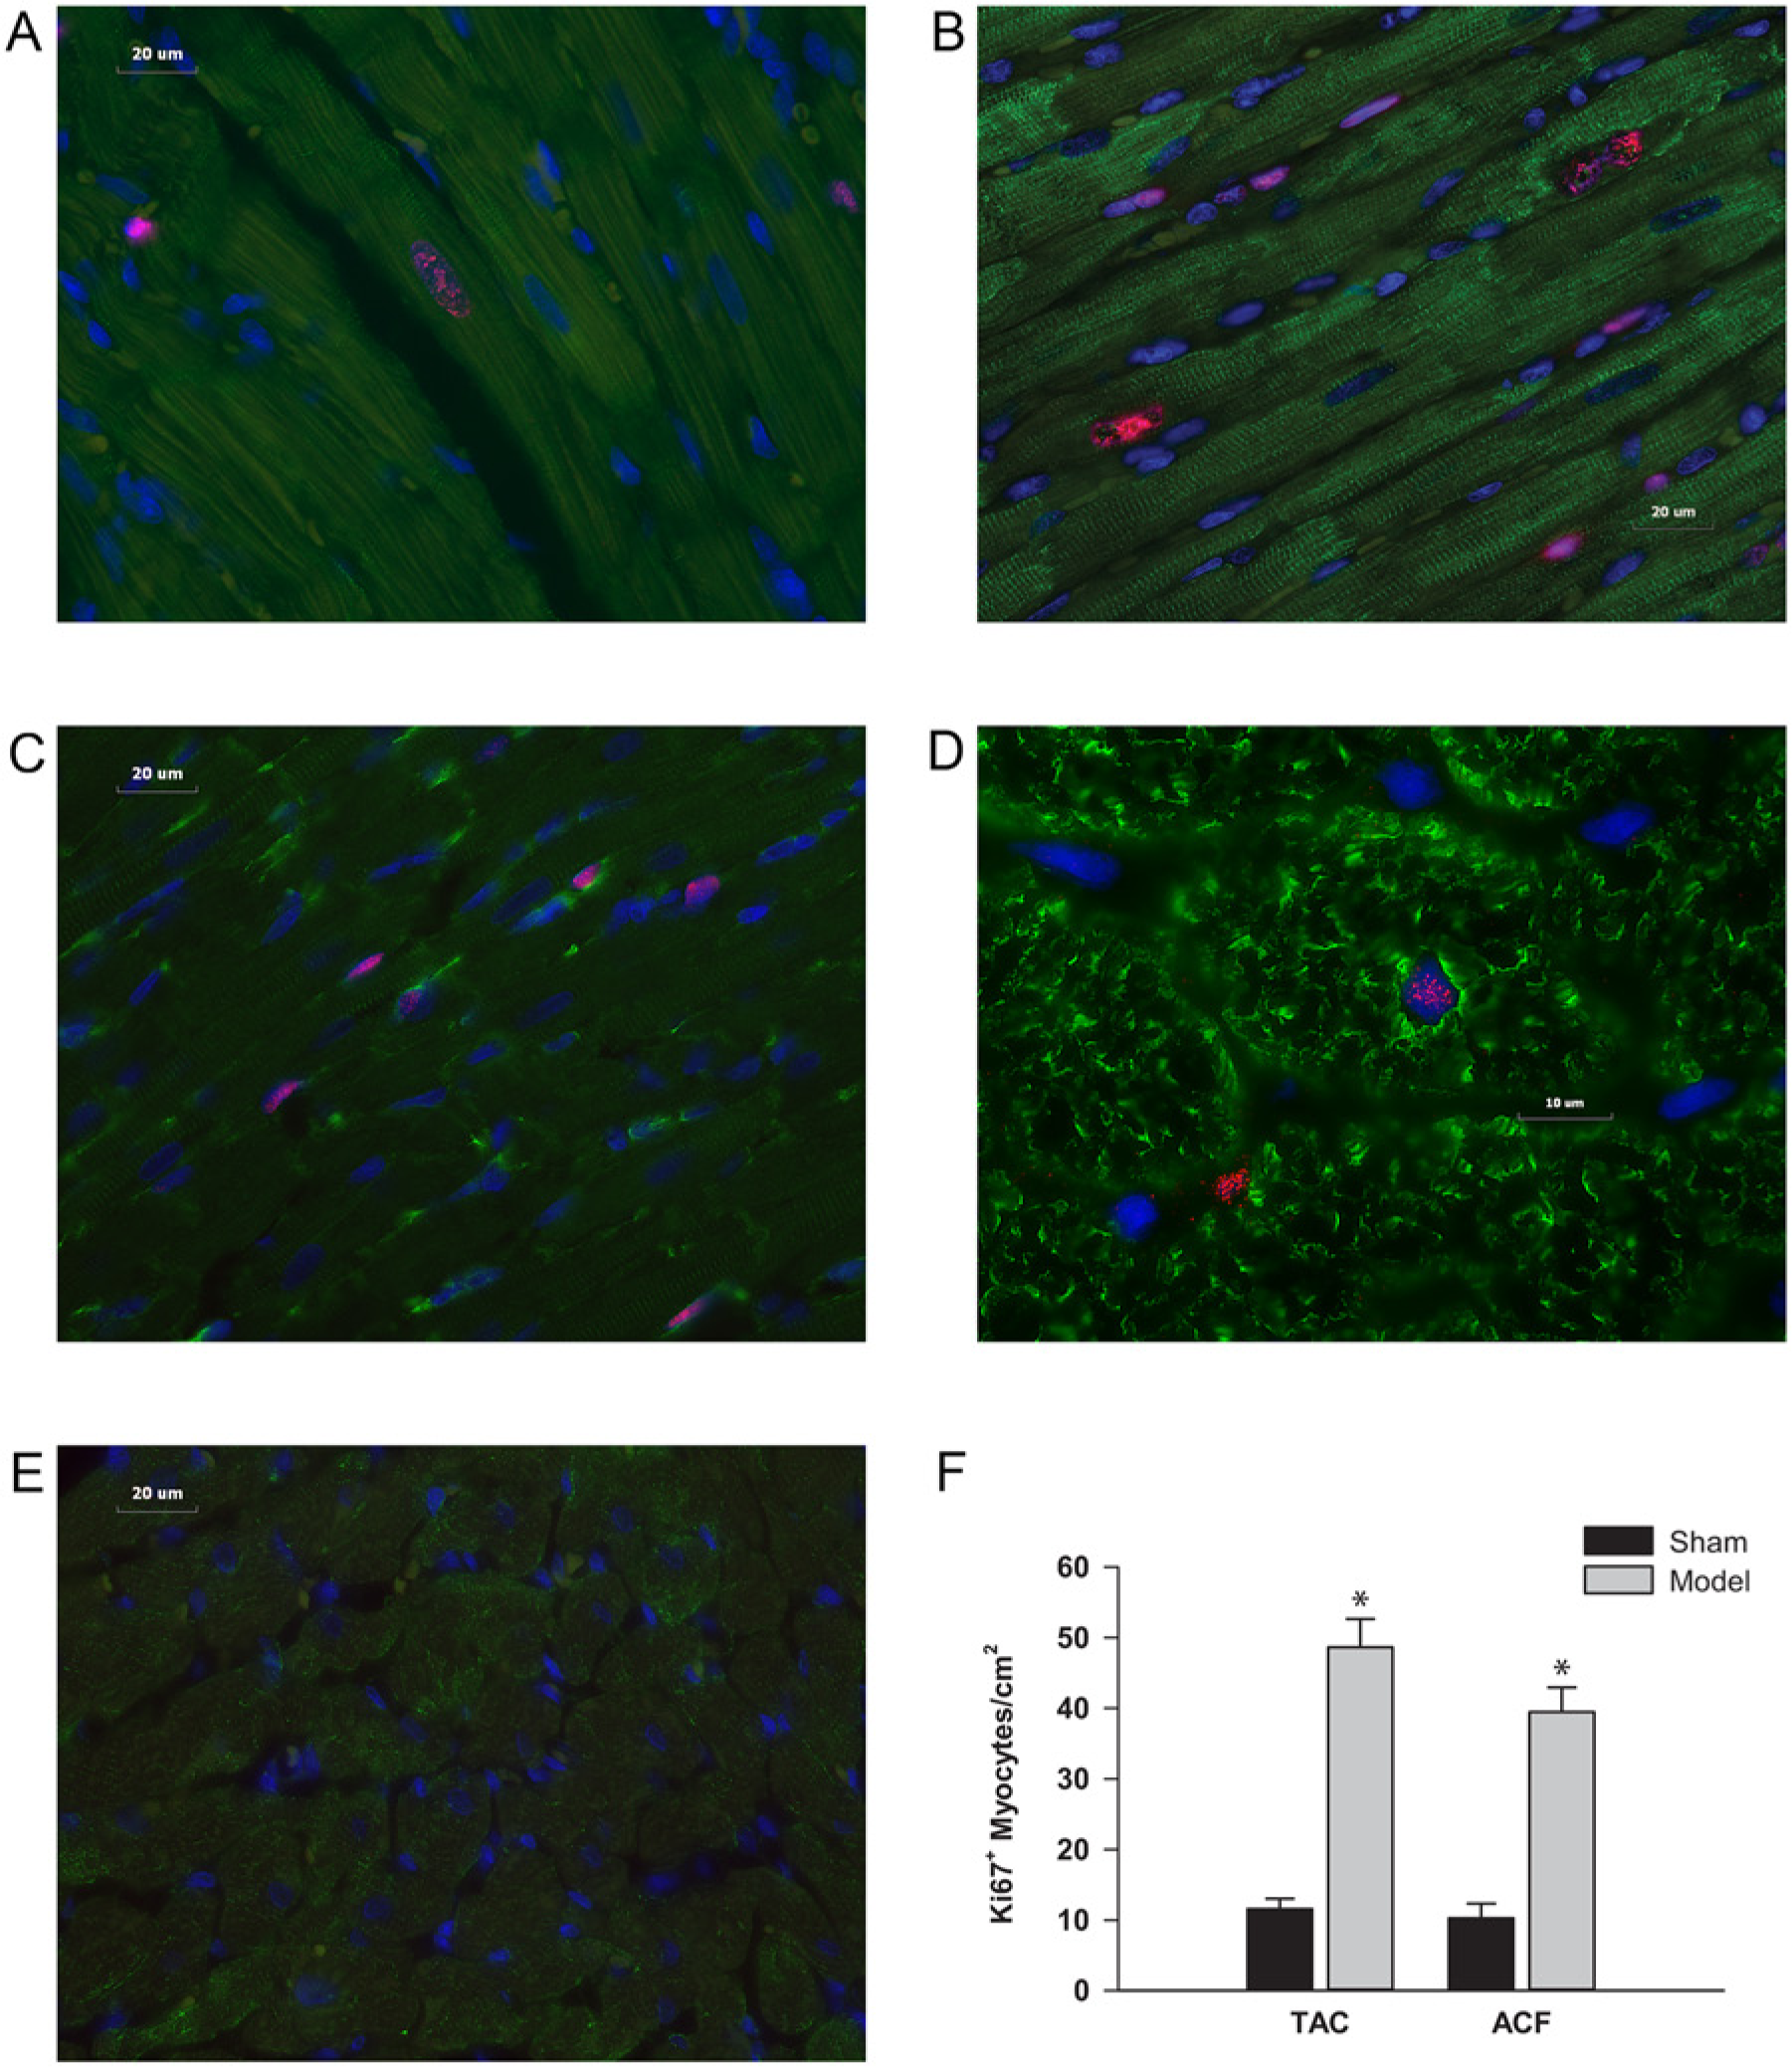
Rat hearts were immersion-fixed in 10% neutral buffered formalin and paraffin-embedded. Then 5 µm sections were mounted on + slides, deparaffinized in xylene and rehydrated in a graded series of ethanol. Heat-induced epitope retrieval was performed with citrate buffer (Vector Laboratories, #H-3300, Burlingame, CA). Sections were blocked with 5% goat serum (in 1% bovine serum/phosphate-buffered saline [PBS]), followed by overnight incubation at 4°C with primary antibody (Ki67: 1:50, Pierce/LabVision RM-9106, Fremont, CA; Aurora B Kinase, 1:500, Abcam ab2254, Cambridge, MA; Desmin: 1:100, Abcam ab6322; Myosin: 1:100, Abcam ab15). Sections were incubated with Alexa Fluor 488- or 594-conjugated secondary antibody (Life Technologies/Molecular Probes, Eugene, OR) to visualize proliferation (red) and cardiomyocyte (green) markers in the tissue, as indicated in figure legends. Nuclei were stained with DAPI (1.5 µg/ml, Vector Laboratories #H-1500, Burlingame, CA). Image acquisition was performed on a Leica DM6000 epifluorescence microscope with SimplePCI software (Compix, Inc., Cranberry Township, PA). Images were adjusted appropriately to remove background fluorescence.
Statistics
All data are presented as means ± standard error of mean (SEM). Morphologic, echocardiographic, and hemodynamic changes between each surgery group and its respective sham group were tested for significance with a Student’s t-test using SigmaStat statistical software (Systat, Chicago, Illinois). p values less than 0.05 were considered significant.
Results
LV morphometry
After 2 weeks of TAC there was an 18% increase in LV mass/BW, while ACF produced a 27% increase in LV mass/BW (Table 2). In addition, ACF rats also demonstrated increases in right ventricular (RV), right + left atria, and lung weights, which are consistent with the physiology of ACF; these parameters were unchanged in rats with TAC. All groups had similar body weights at the time of sacrifice.
Morphometric weights.
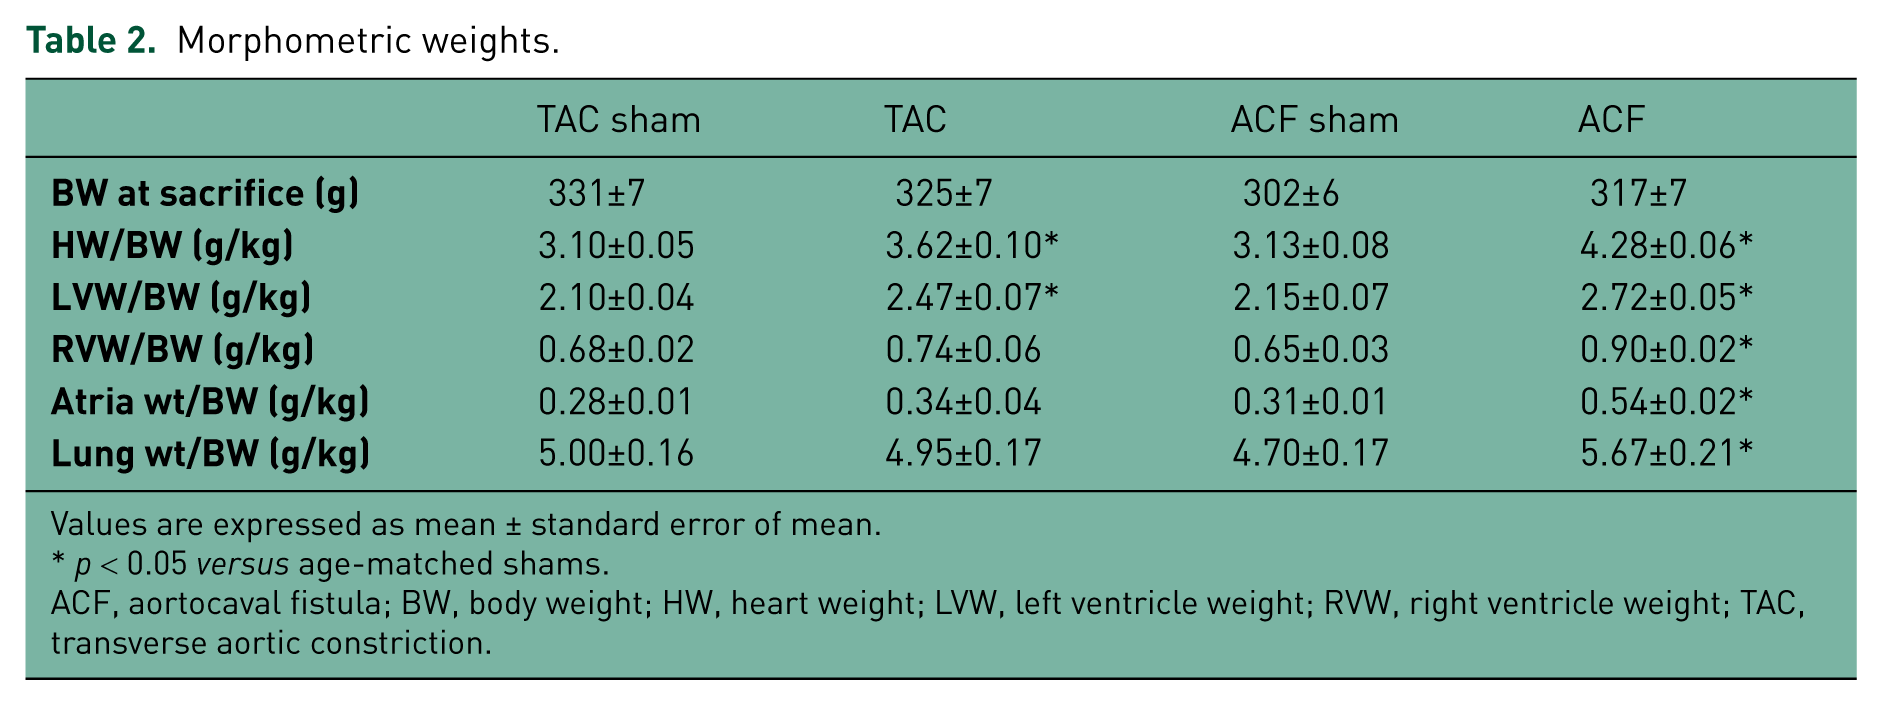
Values are expressed as mean ± standard error of mean.
p < 0.05 versus age-matched shams.
ACF, aortocaval fistula; BW, body weight; HW, heart weight; LVW, left ventricle weight; RVW, right ventricle weight; TAC, transverse aortic constriction.
LV hemodynamics and echocardiography
There were no significant differences in heart rate, mean arterial pressure, dP/dtmax, or dP/dtmin between groups (Table 3). The ACF group demonstrated an increased LV end-diastolic pressure versus ACF sham, while LV end-diastolic pressure did not differ between TAC and TAC sham rats. There was a commensurate decrease in LV end-diastolic and end-systolic dimensions in TAC, while LV end-diastolic dimension increased in ACF versus respective shams. There were opposite trends in LV contractility (LV Ees), with a decrease in ACF and an increase in TAC.
Hemodynamic and echocardiographic results.

Values are expressed as mean ± standard error of the mean.
p < 0.05 versus age-matched shams.
ACF, aortocaval fistula; TAC, transverse aortic constriction; HR, heart rate; MAP, mean arterial pressure; LVEDP, left ventricular end-diastolic pressure; +dP/dt, left ventricular pressure derivative maximum; –dP/dt, left ventricular pressure derivative minimum; LVESD: left ventricular end-systolic dimension; LVEDD: left ventricular end-diastolic dimension; IVS, interventricular septum; Ees: end-systolic elastance.
Changes in LV remodeling and function in PO and VO
TAC rats had significantly reduced LV end-diastolic dimensions and increased LV end-diastolic posterior wall thickness, resulting in a significant decrease in LV end-diastolic wall stress (Figure 1). In contrast, ACF rats demonstrated significantly increased LV end-diastolic dimensions that were not associated with a change in wall thickness or LV end-diastolic wall stress. In TAC, a significant decrease in LV end-systolic wall stress was associated with an increase in LV contraction velocity (VCfr) (Figure 2), while ACF rats displayed no significant changes in LV end-systolic wall stress, VCfr, or fractional shortening compared with ACF shams. However, ACF did lead to increases in stroke volume, stroke work, ejection fraction, and cardiac output compared with shams (Figure 3), all of which were unchanged by TAC at 2 weeks.


Real-time PCR validation of microarray
RT-PCR quantification of 25 target genes (Tables 1 and 4) from the various group comparisons (ACF versus ACF sham, TAC versus TAC sham, ACF sham versus TAC sham) showed close agreement with fold changes derived from microarray analysis, with a resulting Pearson correlation coefficient of 0.92 (Figure 4).
Array and RT-PCR fold change correlation.
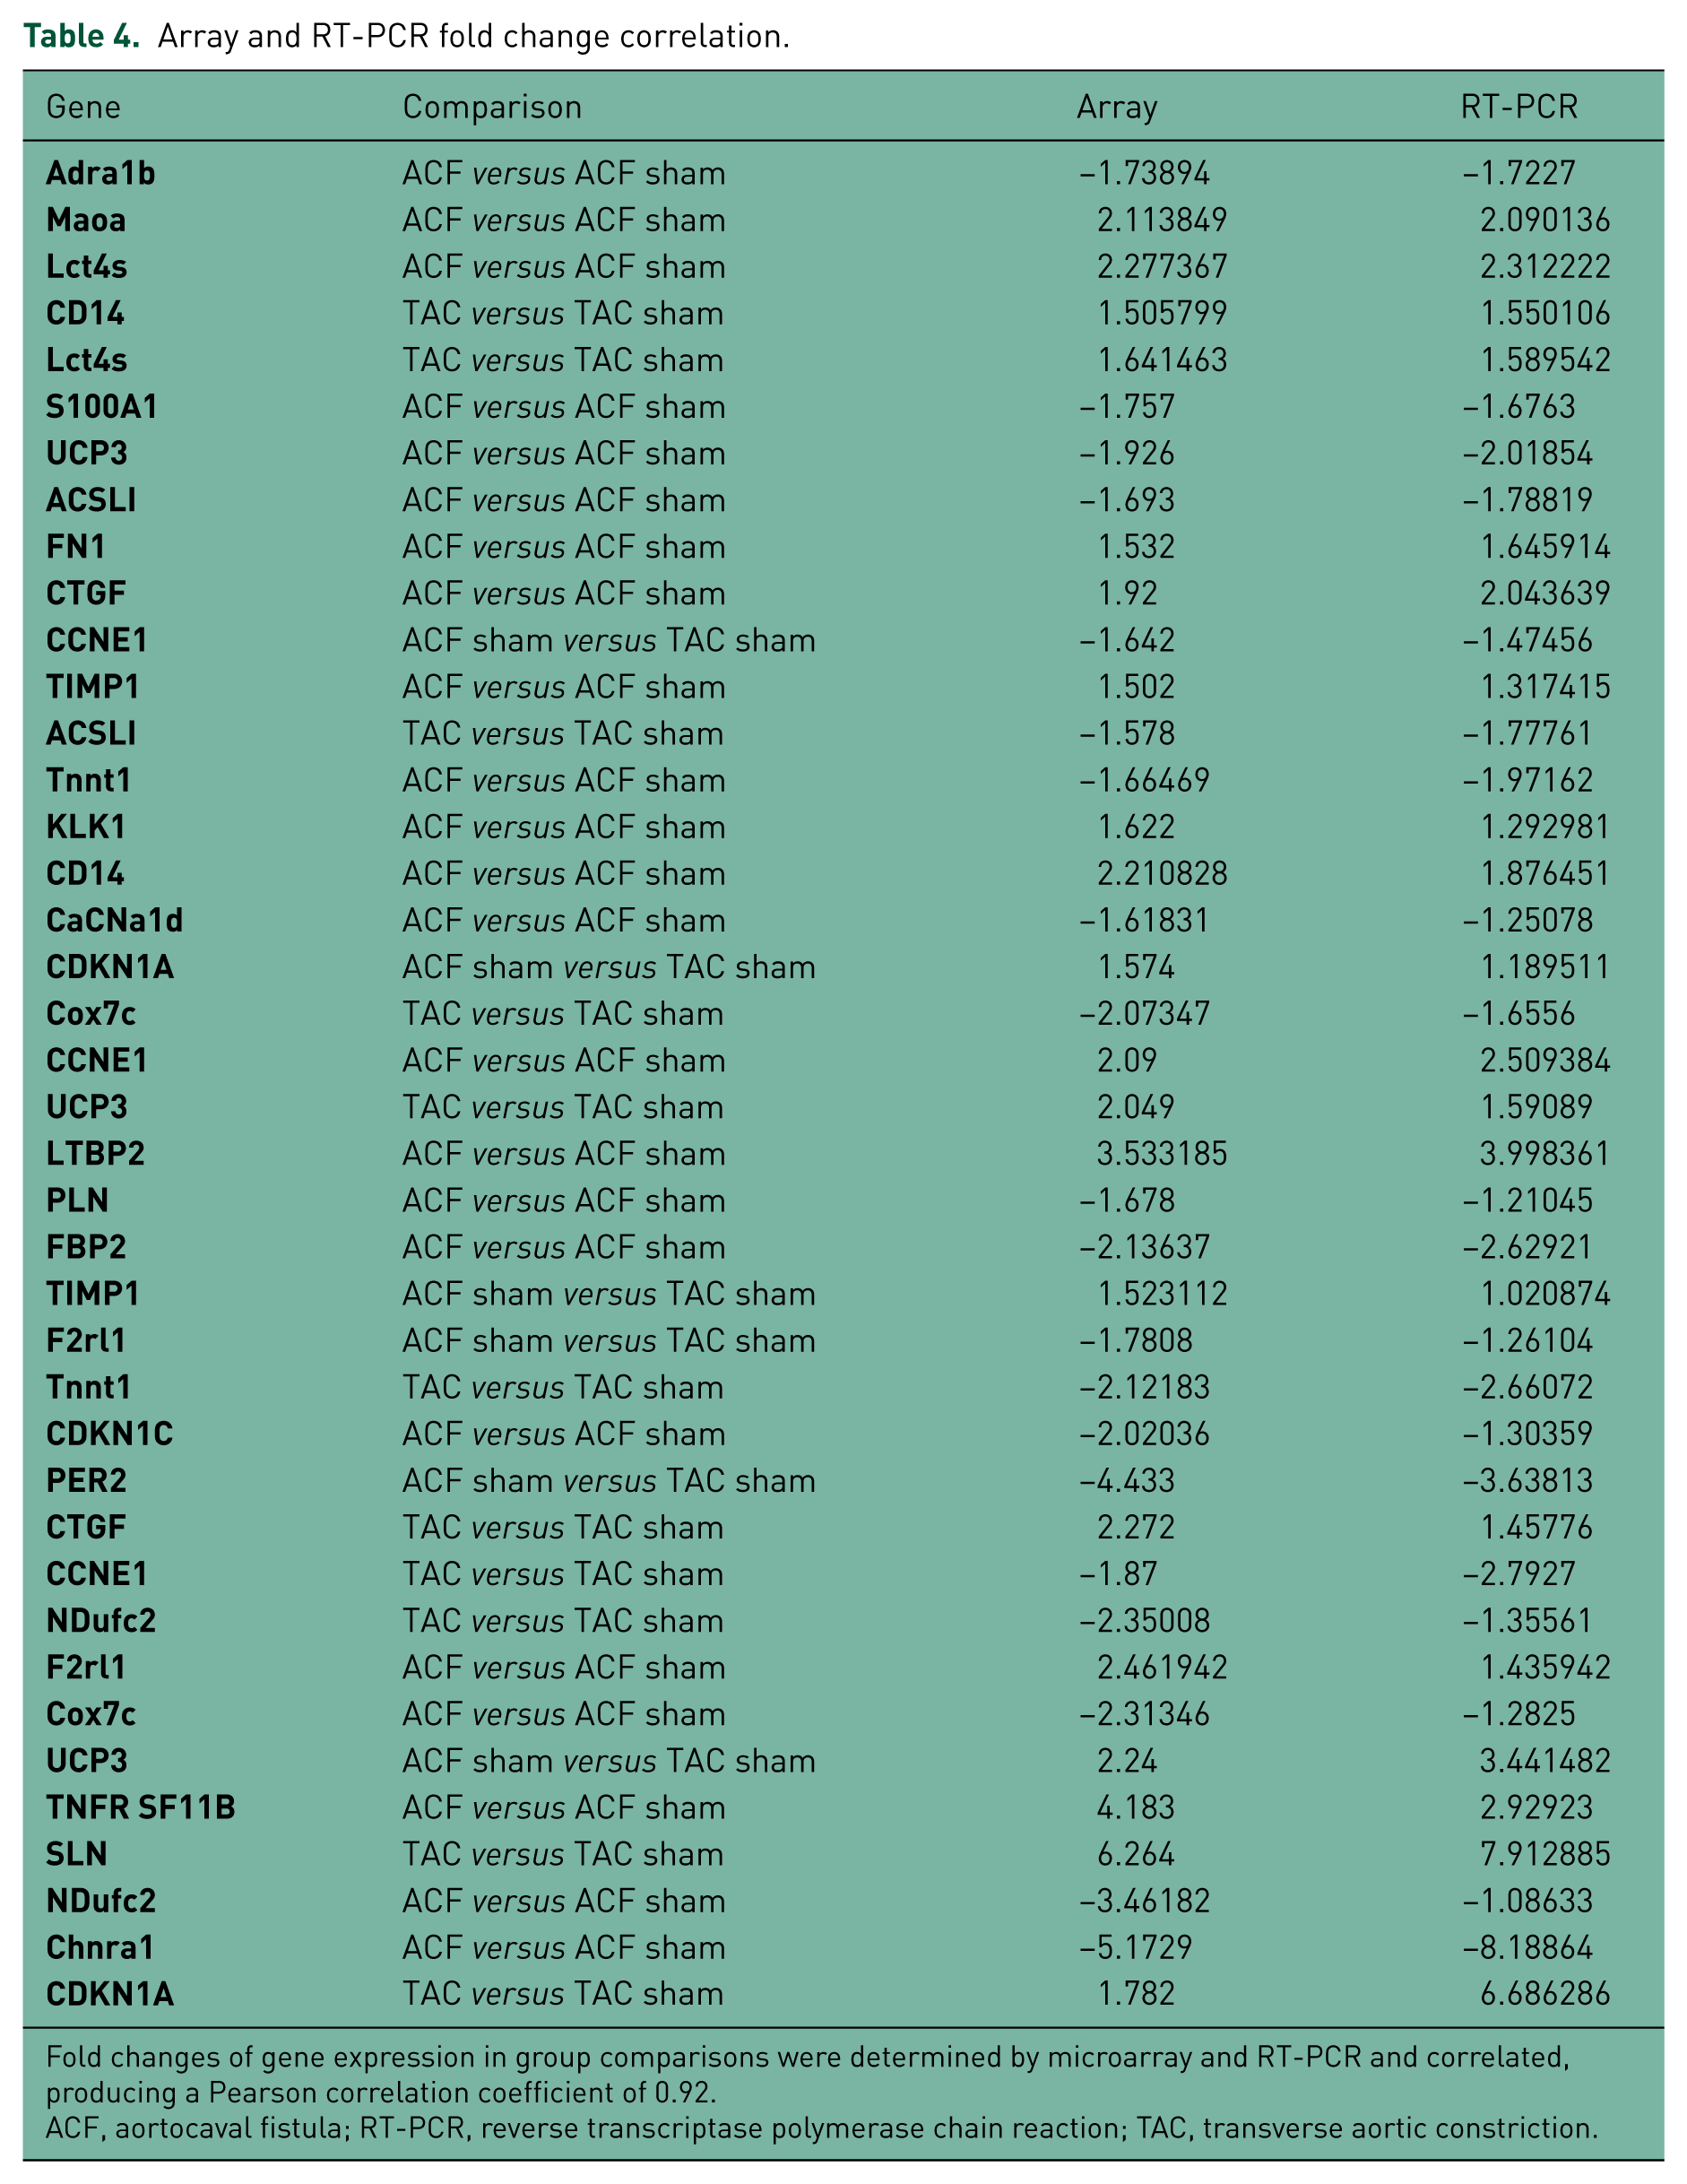
Fold changes of gene expression in group comparisons were determined by microarray and
RT-PCR and correlated, producing a Pearson correlation coefficient of 0.92.
ACF, aortocaval fistula; RT-PCR, reverse transcriptase polymerase chain reaction; TAC, transverse aortic constriction.

Gene expression changes in PO and VO
In the microarray and IPA analyses, TAC and ACF were compared with their respective shams. The microarray identified 479 genes that were differentially regulated at least 1.5-fold in TAC compared with age-matched shams, with 113 of those genes being upregulated and 366 downregulated (Figure 4). In ACF, 1225 genes were altered significantly with 307 upregulated and 918 downregulated compared with respective shams. A total of 193 differentially expressed genes were common to both forms of hypertrophy.
The top-ranking gene network produced by IPA for TAC (network score = 15) was related to behavior, neurological disease, and cellular function and maintenance (Figure 5). Genes in the top ACF network had roles in organismal injury and abnormalities, cellular growth and proliferation, and tissue morphology, and yield a score of 22 (Figure 6).


Upon careful inspection of the differentially regulated genes in TAC and ACF, we found involvement of four key biological categories. Rats with ACF for 2 weeks showed marked differences in expression of ECM genes, generally upregulated compared with sham, whereas rats with PO demonstrated minimal changes in ECM genes (Table 5). Both forms of hypertrophy diminished the expression of genes involved with oxidative metabolism of fatty acids and glucose, but the decreases were much more extensive in VO (Table 6). ACF rats also had marked activation of cell proliferation pathways compared with sham rats; however in TAC rats, the few differentially regulated genes pertaining to the cell cycle were primarily inhibitory (Table 7). Finally, several key regulators of myocyte contractility were substantially decreased in both models compared with their respective shams, but ACF rats had greater involvement of this category compared with TAC rats (Table 8).
Extracellular matrix homeostasis: VO versus PO differences of key genes.
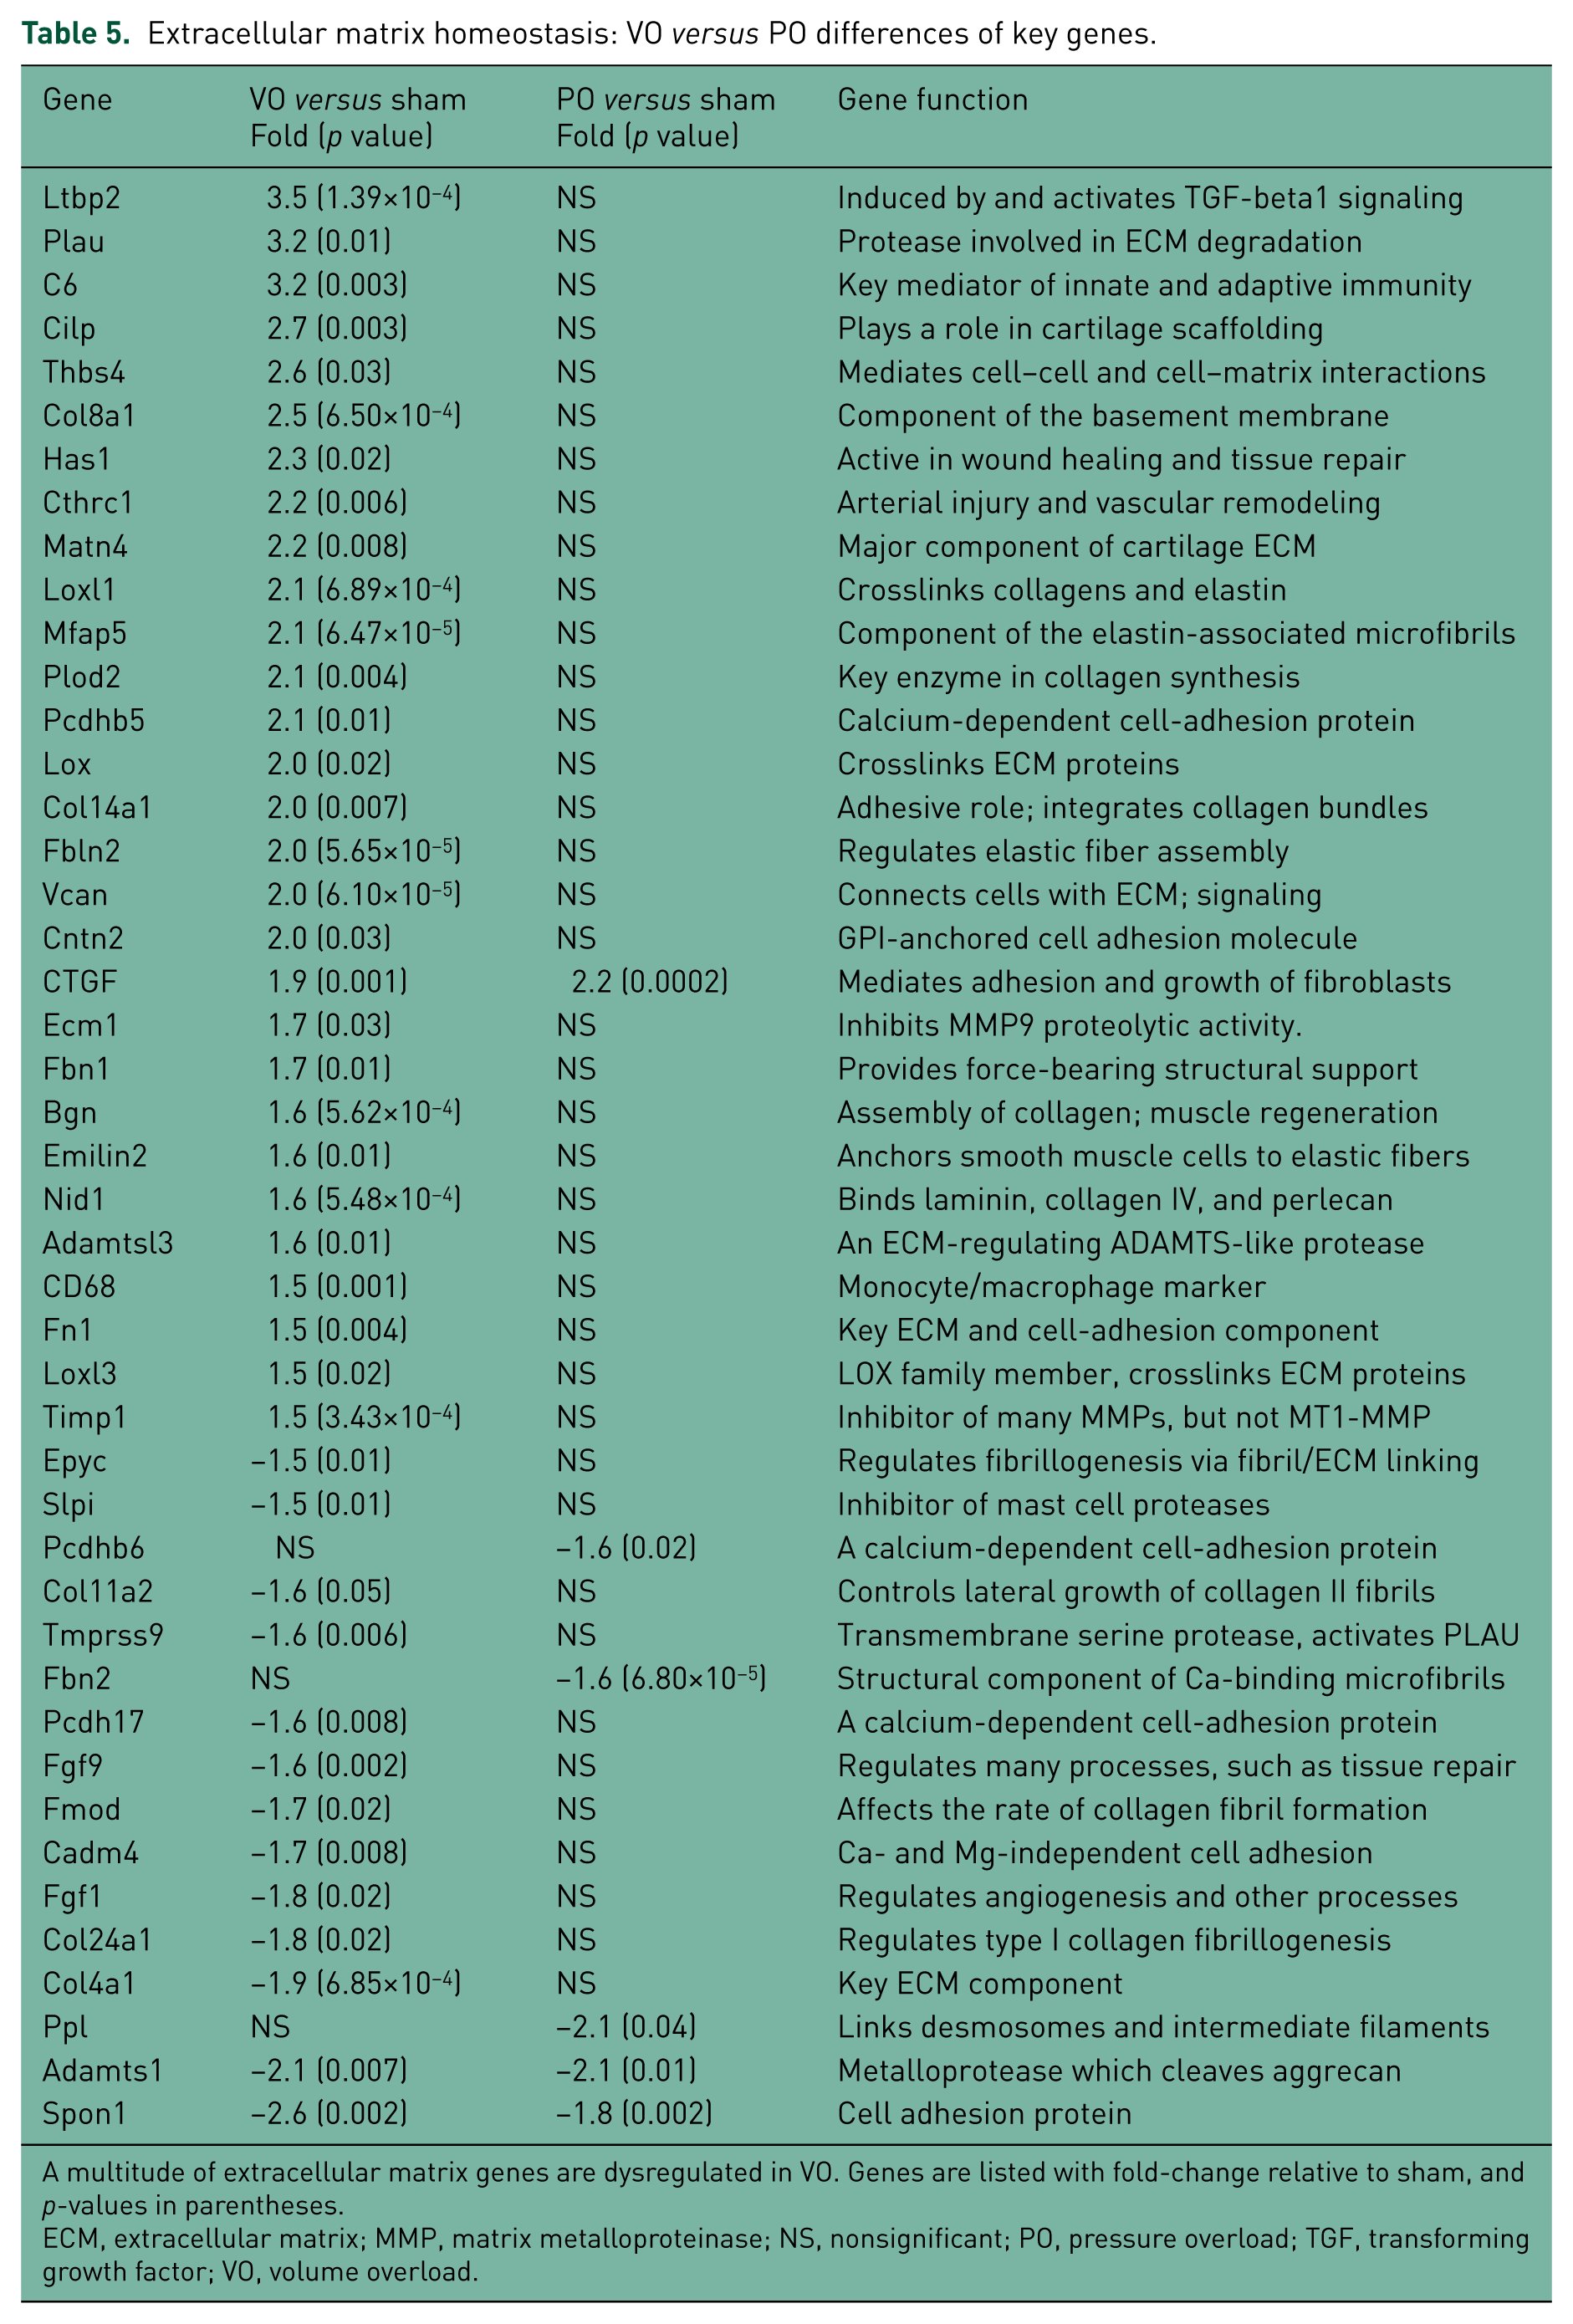
A multitude of extracellular matrix genes are dysregulated in VO. Genes are listed with fold-change relative to sham, and p-values in parentheses.
ECM, extracellular matrix; MMP, matrix metalloproteinase; NS, nonsignificant; PO, pressure overload; TGF, transforming growth factor; VO, volume overload.
Loss of oxidative metabolism: VO versus PO differences of key genes.

Genes contributing to oxidative metabolism of fatty acids and glucose are downregulated in rats with PO and VO. Genes are listed with fold-change relative to sham, and p-value in parentheses.
ADP, adenosine diphosphate; AMP, adenosine monophosphate; AMPK, AMP-activated protein kinase; ATP, adenosine triphosphate; IMP, inosine monophosphate; NS, nonsignificant; PO, pressure overload; VO, volume overload.
Cell cycle and proliferation: VO versus PO differences of key genes.

Cell proliferation genes are markedly induced by two weeks of VO compared with sham rats, whereas gene changes in PO oppose cell cycle progression. Genes are listed with fold-change relative to sham, and p-value in parentheses.
BMP, bone morphogenetic protein; NS, nonsignificant; PO, pressure overload; VO, volume overload.
Dysregulation of contraction: VO versus PO differences of key genes.

Genes with key roles in myocyte contractility are downregulated in rats with ACF. Genes are listed with fold-change relative to sham, and p-value in parentheses.
NS, nonsignificant; PO, pressure overload; SERCA, sarcoplasmic endoplasmic/endoplasmic reticulum Ca2+-ATPase; VO, volume overload.
Gene symbols not defined in the text.

Markers of cell proliferation in PO and VO
There was substantial expression of Ki67 in cardiomyocytes and interstitial cells from both TAC and ACF hearts (Figure 7). However, Aurora B Kinase, a marker of cell division, was seen only in the ACF group. PO rats had an average of 49 Ki67+ nuclei per cm2 while VO rats averaged 40 Ki67+ nuclei per cm2, compared with 10 positive nuclei per cm2 in both sham groups. Despite this indication of nuclear division in myocytes, there was no increase in the number of nuclei per cardiomyocyte in ACF or TAC (data not shown).
Discussion
In this study we compared concentric and eccentric cardiac hypertrophy at the subacute 2-week time point. We found approximately three times as many genes differentially regulated in rats with VO-induced eccentric remodeling compared with rats with the concentric remodeling of PO, suggesting greater molecular complexity in VO. A striking difference was the extensive upregulation of ECM genes in VO compared with PO, despite the known opposing directions of ECM homeostasis in eccentric and concentric hypertrophy. The widespread pattern of ECM upregulation in VO included genes involved in collagen crosslinking (Lox, Loxl1, Loxl3 Plod2) [Molnar et al. 2003; Van Der Slot et al. 2003], elastin formation and its crosslinking with collagen (Fbln2, Loxl1, Mfap5, Emilin2) [Gibson et al. 1998; Molnar et al. 2003; Timpl et al. 2003; Colombatti et al. 2011], and cell–cell or cell–matrix interactions (Col8a1, Vcan, Nid1, Fn1, Thbs4) [Mayer et al. 1998; Hou et al. 2000; Jane-Lise et al. 2000; Narouz-Ott et al. 2000; Wight, 2002]. At the same time, there was an increase in ECM proteases such as urokinase (Plau) that activates MMP-9 [Zhao et al. 2008], but this increase was counterbalanced by inhibitors of MMPs (TIMP1, Ecm1) [Li et al. 2000; Fujimoto et al. 2006]. In particular, upregulation of TIMP 1 and fibronectin (FN1) have been associated with cardiac fibrosis [Jane-Lise et al. 2000; Varo et al. 2000]. Osteoprotegerin was increased 4-fold and has been reported to have a protective effect in fibrosis in the failing heart [Ueland et al. 2005]. Taken together, the marked upregulation in ECM genes and preservation of collagen at 2 weeks of ACF (data not shown) was most likely a response to the net loss of interstitial collagen known to occur at earlier time points [Ryan et al. 2007; Chen et al. 2010]. In contrast, as concentric hypertrophy progresses beyond 2 weeks, interstitial collagen is preserved [Stewart et al. 2010] and ECM genes were generally unchanged after 2 weeks of PO. How the global increase in ECM gene expression in ACF translates into a subsequent decrease in ECM at 5 weeks remains an open question [Chen et al. 2011].
Both TAC and ACF had an increase in CTGF, which was consistent with Ki67-positive fibroblasts and myocytes [Kothapalli and Grotendorst, 2000; Hayata et al. 2008]. However, in VO there was more extensive upregulation of genes associated with all phases of cell proliferation, including genes involved in G1/S phase transition and DNA replication (Ccne1, Cdc7, Mcm3, Mcm8, Prim1, Chaf1b, Rrm2) [Koff et al. 1992; Kaufman et al. 1995; Shiratori et al. 1995; Maiorano et al. 2006; Malumbres, 2011; Lu et al. 2012], G2/mitosis (Ccnb1) [Galaktionov and Beach, 1991], centromere assembly (Cenpm, Cenpw) [Foltz et al. 2006; Kim et al. 2009], and regulators of cytokinesis (Kif20a, Prc1, Racgap1) [Jiang et al. 1998; Hirose et al. 2001; Gruneberg et al. 2004]. Inhibitors of cell growth and proliferation were upregulated in PO (Cdkn1a, Gadd45b) [Harper et al. 1993; Vairapandi et al. 2002] and unchanged in VO. Most importantly, and consistent with the gene expression pattern, the cell division marker Aurora B kinase was found only in VO. These findings support the well-established association of inflammation with cell proliferation [Lien et al. 2006]. However, the current study cannot determine whether the increased cell cycle events were from resident myocytes or interstitial cells, or an influx of stem cells.
The connection between inflammation and cardiac remodeling is well established [Kuwahara et al. 2004; Weber, 2004; Lien et al. 2006] and was prominent in VO, given the induction of Cathepsin S (CTSS) [Cheng et al. 2006], complement 6 (C6) [Ito et al. 1996], and the macrophage marker CD68 [Barry, 1994]. Secretory leukocyte peptidase inhibitor (Slpi), an endogenous inhibitor of several cathepsins [Taggart et al. 2001] and other immune cell proteases [Walter et al. 1996], was downregulated. We have previously reported an intense inflammatory cell infiltration at 24 hours and 2 weeks in the ACF model [Chen et al. 2010, 2011], and this is consistent with the upregulation of gene clusters involved in ECM turnover and cell proliferation identified by our microarray. It is of interest that we have previously shown proliferation is absent after 5 weeks of ACF but there is further LV hypertrophy [Chen et al. 2011]. However, at 5 weeks of ACF collagen is decreased and does not keep pace with cardiac hypertrophy, despite upregulation of the renin–angiotensin system [Ruzicka et al. 1994; Wei et al. 2012].
Approximately 40% of the genes with altered expression in PO were also altered in VO. These genes primarily pertain to lipid metabolism and their downregulation in both models implies they have roles common to cardiac hypertrophy [Strom et al. 2004; Chen et al. 2011]. There was downregulation of ACSL1, which synthesizes long-chain acyl-CoA for fatty acid oxidation, and Pecr which is involved in fatty acid synthesis [Das et al. 2000]. Deletion of ACSL1 induces hypertrophy in mice [Ellis et al. 2011]. The decrease of metabolic gene expression in VO also included genes involved in fatty acid oxidation, such as Acox1 and Acsbg1 [Finck. and Kelly, 2002], and genes involved in glucose oxidation including Fbp2 and the pyruvate dehydrogenase complex component Pdha1 [Kitamura and Uyeda, 1987; Patel and Korotchkina, 2006]. The reduced expression of several components of the electron transport chain (Sdhb and Cox7c) [Hederstedt and Rutberg, 1981; Kadenbach and Merle, 1981; Procaccio et al. 1998] further demonstrates a global loss of oxidative metabolism in VO. The effect on cardiac metabolism was more extensive in ACF than in TAC and may be related to the greater sympathetic nervous system activation that is required in VO to maintain a high stroke volume [Kitamura and Uyeda, 1987].
IPA further highlighted alterations in genes associated with ECM and cell proliferation in VO (Figure 6). Nuclear factor kappa-B (NF-kB) is a key regulator of ECM with its role in activation of fibronectin and TIMP1 [Reddy et al. 2008; Bommarito et al. 2011]. In contrast, the PO IPA network implicates genes essential for preservation of contractility (Figure 5), consistent with the increased LV VCfr and LV end-systolic pressure volume relation. While α-adrenergic receptor (Adra1d) is downregulated in rats with TAC, upregulation SGK1 potentiates α-receptor signaling and promotes hypertrophy [Lister et al. 2006]. SGK1 also alters sodium channel expression in concentric hypertrophy [Das et al. 2012], and upregulation of SCNA1/Nav1.1 promotes exaggerated action potentials in pressure-overloaded hearts [Xi et al. 2009]. Rho family members are also identified in PO and can mediate the upregulation of the sodium/calcium exchanger NCX1 [Maeda et al. 2005]. In contrast, the ACF IPA network suggests Protein Kinase C as a mechanism for the downregulation of genes participating in contraction, specifically S100A1, a key calcium handling protein [Most et al. 2006]. Downregulation of CREB1 can also alter ion channel and pump expression profiles and alter action potential properties [Schulte et al. 2012]. The downregulation of Gja1 (Connexin 43) [Guerrero et al. 1997] and PKP2 [Cerrone et al. 2012], both desmosomal proteins, can also lead to aberrant cardiomyocyte ion handling. Thus, the IPA network genes in PO and VO are consistent with LV systolic function at this time point.
A limitation of the current study is that the 2-week stage for TAC and ACF may not be equivalent with regard to peak molecular responses. In addition, the animal models employed in this study create an abrupt hemodynamic change, whereas the human conditions they attempt to recapitulate are often chronic and develop over years or decades [Houser et al. 2012]. Despite these limitations, both TAC and ACF reached a stable point defined by LV remodeling, with a greater emphasis on ECM remodeling genes in ACF. Also, while the assessment of transcript levels provided by microarray analysis is highly informative, the results may not always extend to the final biological outcome due to post-transcription regulatory mechanisms, such as microRNAs [Duisters et al. 2009; Da Costa Martins and De Windt, 2012]. In addition, there are numerous post-translational modifications that can influence protein function [Molkentin, 2000; Blankesteijn et al. 2008; Laczy et al. 2009; Marber et al. 2011].
While it is clearly important to understand mechanisms and factors that are universally involved in cardiac hypertrophy, the fact that some forms of HF and hypertrophy are refractory to mainstay treatments strongly suggests the need to also consider mechanisms that differ between concentric and eccentric remodeling. The vast upregulation of ECM genes in eccentric remodeling is paradoxical given the eventual loss of ECM in pure VO. The results presented here should prompt further investigation into the feasibility of shifting ECM homeostasis toward a more positive balance, which is the opposite effect of renin–angiotensin system blockade, and further explains the failure of this drug therapy to arrest the remodeling process in a pure VO.
Footnotes
Acknowledgements
We wish to thank Dr Michelle Amaral and Dr David Crossman for access to GeneSpring, and Dr Marcus Bamman for access to IPA.
Funding
This work was supported by the National Heart, Lung, and Blood Institute (NHLBI; grant number RO1-HL-54816 to L. J. Dell’Italia) and a NHLBI Specialized Centers of Clinically Orientated Research Grant in Cardiac Dysfunction (grant number P50-HL-077100).
Conflict of interest statement
The authors declared no potential conflicts of interest with respect to the research, authorship, and/or publication of this article.