
Abstract
Background:
Although the clinical role of bronchoalveolar lavage (BAL) in interstitial lung disease (ILD) has been suggested by previous studies, its clinical utility remains debatable.
Objectives:
We aimed to evaluate the clinical implications of combining quantitative computed tomography (QCT) and BAL fluid cellular analysis in patients with fibrotic ILD.
Design:
This study was a retrospective, single-center study.
Methods:
We analyzed patients with fibrotic ILD who underwent BAL in specific lung locations and used deep-learning-based QCT. Correlations between BAL cellular components and QCT parameters were assessed for both the whole lung and the tested lobe, and survival outcomes and disease progression were evaluated.
Results:
Among 163 patients, no significant difference was observed in BAL cellular analysis between radiologic usual interstitial pneumonia (UIP) and non-UIP groups (for all, p > 0.05). BAL neutrophil levels showed weak positive correlation with fibrosis score (whole lung: r = 0.308, p < 0.001; tested lobe: r = 0.200; p = 0.010). While BAL cellular analysis alone showed no difference in 3-year survival, a high fibrosis score (⩾20%) independently predicted 3-year mortality (hazard ratio 4.62, p = 0.002). In patients with fibrosis score ⩾10%, high BAL neutrophils (>4.5%) indicated greater 1-year fibrosis progression (log-rank test, p = 0.029). In steroid-treated patients, BAL lymphocytosis (⩾15%) was associated with a trend toward an improved prognosis (p = 0.073); however, within this group, those with fibrosis scores ⩾20% had worse outcomes in the 3-year survival rate (median survival: 16.4 months vs not reached, p = 0.039).
Conclusion:
Although BAL fluid cellular analysis alone does not differentiate radiologic patterns or offer prognostic values, elevated BAL neutrophil levels combined with a high fibrosis score on CT may help to identify patients at higher risk of early fibrosis progression.
Plain language summary
Interstitial lung disease (ILD) is a group of conditions characterized by inflammation and fibrosis in the lungs. Clinicians sometimes use a test called bronchoalveolar lavage (BAL), which involves washing a small part of the lung with fluid to collect and analyze cells, to help with diagnosis. However, it is unclear how useful BAL is for predicting how ILD will progress. This study examined whether BAL results, combined with CT scan measurements of lung fibrosis, could provide helpful information about patient outcomes. We reviewed data from 163 patients with fibrotic ILD who had BAL testing and CT scans. On its own, BAL did not distinguish different CT scan patterns (UIP, a key CT pattern in ILD, vs. non-UIP) and did not predict survival or disease progression. However, when patients had both a high burden of fibrosis on CT and increased levels of certain immune cells (neutrophils) in BAL, they were more likely to experience faster progression of lung fibrosis. In conclusion, when BAL results are considered together with CT scan findings, they may help identify patients at higher risk of disease progression.
Introduction
Interstitial lung disease (ILD) is a heterogeneous disease group characterized by inflammation and/or fibrosis of the lung interstitium. 1 Although high-resolution computed tomography plays an important role in the diagnosis of ILD, certain cases remain unclassified, even after multidisciplinary diagnostic efforts.2,3 Idiopathic pulmonary fibrosis (IPF) is one of the most common forms of ILD and is generally associated with a poor prognosis, although clinical variability exists within IPF itself. 4 In addition, certain ILDs with etiologies distinct from IPF may also manifest a progressive fibrosing condition, referred to as progressive pulmonary fibrosis.5,6 Since antifibrotic treatment has demonstrated therapeutic benefit in patients with IPF and progressive pulmonary fibrosis, the identification of patients at risk for disease progression emerges as a clinically significant priority in disease management.7,8
Bronchoscopy with cellular analysis of bronchoalveolar lavage (BAL) fluid has traditionally been regarded as an adjunctive tool in the classification of ILD. 9 Current guidelines recommend performing BAL in patients with patterns indeterminate for usual interstitial pneumonia (UIP) and alternative diagnoses, or when evaluating differential diagnoses that include fibrotic hypersensitivity pneumonitis.6,10 However, the role of BAL in ILD diagnosis is a subject of ongoing debate.11,12 Beyond diagnosis, recent studies have evaluated the associations between cellular analysis of BAL fluid and radiologic features, prognosis, and treatment response.13–15 However, the limitations of previous research include the lack of consideration for the location of BAL sampling and the reliance on visual CT analysis, which is less objective and accurate than automated quantification.16–18 Automated quantitative computed tomography (QCT) analysis has demonstrated significant prognostic value across diverse fibrotic ILD phenotypes, offering objective metrics for disease assessment.19–21 Integration of QCT analysis to identify subsets of patients who could benefit from enhanced diagnostic and prognostic insights through BAL fluid analysis may contribute to improved clinical practice. Therefore, our study aimed to evaluate the clinical implications of combining QCT and BAL fluid cellular analysis in patients with fibrotic ILD, leveraging the specific location of BAL sampling in these patients.
Methods
Study design and population
This was a retrospective, single-center study of patients who underwent BAL as a part of the initial diagnostic workup for ILD at Asan medical center between March 2018 and August 2023. Patients with evidence of fibrosis on baseline chest CT and who underwent BAL for diagnostic purposes were included and retrospectively reviewed. Patients without a CT within 6 weeks of BAL or who received steroids for any reason within 1 week prior to BAL were excluded from the study (Figure 1).

Study flow chart.
All clinical information was obtained during routine patient care. The following data were extracted through review of electronic medical records: demographic data at the time of diagnosis, pulmonary function tests, types of treatment after diagnosis (antifibrotics, steroids, or immunosuppressive therapy), and survival status (censored as of September 2024). This study was conducted in accordance with the Declaration of Helsinki and with all relevant guidelines and regulations, and it adheres to the Strengthening the Reporting of Observational Studies in Epidemiology (STROBE) statement (Supplemental File 1). 22
Bronchoscopy and BAL
BAL was performed in the selected bronchopulmonary segment determined by pulmonologists according to the distribution of ILD and the anticipated fluid recovery rate. The amount of BAL fluid corresponding to 103 cells was centrifuged onto a microscope slide using a Thermo Shandon Cytospin (Thermo Fisher Scientific Inc., Waltham, MA, USA) at 750 rpm for 5 min at room temperature. Differential cell counts that included percentages of neutrophils, lymphocytes, alveolar macrophages, and eosinophils were determined.
The results of BAL fluid cellular analysis were classified according to each threshold for lymphocytes and neutrophils, irrespective of other cellular components: “lymphocytic” was defined as lymphocytes >20% or >15%, and “neutrophilic” as neutrophils >4.5% or >3%, as adopted in a previous study. 23
Chest CT analysis
Patients underwent chest CT at baseline with various protocols, but all available with thin-section chest CT images reconstructed at a section thickness of 1 or 1.25 mm using a high-spatial-frequency reconstruction algorithm (detailed in Supplemental Material). The extents of normal lung, emphysema, consolidation, ground-glass opacity (GGO), reticulation, and honeycombing were evaluated using commercially available and previously validated deep-learning-based quantification software (Aview version 1.1.38.6, Coreline Soft, Seoul, Republic of Korea).24–27 All CT patterns were quantified as percentages, calculated on the basis of the segmented volume of each pattern relative to the total lung volume and the volume of each lobe. The fibrosis score (FS) was defined as the sum of reticulation and honeycombing.28–30
The chest CT images were also independently reviewed by two readers, a pulmonologist (Bora Lee) and a thoracic radiologist (Jooae Choe), who were blinded to all clinical information except the location of the BAL segment. Any conflicts of opinion were resolved by consensus. This evaluation included the presence of a UIP, the presence of emphysema and peribronchovascular fibrosis, and the percentage of GGO in the BAL segment according to visual grading. UIP on CT was defined as either a UIP or probable UIP pattern, while non-UIP was defined as patterns indeterminate for UIP or suggestive of an alternative diagnosis. 31 In addition, the percentage of GGO in the BAL segment was visually categorized into the following four ranges: <5%, 5%–24%, 25%–50%, and >50%. 32
Statistical analysis
All continuous variables are expressed as median (interquartile range (IQR)), and categorical variables as percentages. The Mann–Whitney U-test was used to compare continuous variables, and the chi-square test was used to compare categorical variables. Fibrosis progression was defined as an annualized decrease in predicted forced vital capacity (FVC) greater than an absolute value of 10% and/or death from any cause within 1 year of BAL. 13 The relationships between BAL fluid cellular analysis and QCT metrics were assessed using Pearson’s correlation coefficients. Risk factors for 3-year all-cause mortality were analyzed using Cox proportional hazards analysis. Variables with p < 0.1 in the univariate analysis were entered into multivariable models. Kaplan–Meier estimates and the log-rank test were used for fibrosis progression or 3-year survival analysis, with subgroup analyses stratified by combined BAL cellular profiles and FS in all patients or in patients with steroid treatment. Data analysis was performed using the R statistical package (version 4.4.1; R Foundation for Statistical Computing, Vienna, Austria). p-Values are two-tailed, with statistical significance being set as p < 0.05.
Results
Characteristics of study patients
A total of 163 patients (median age, 66; 144 males (88.3%)) were included in the final analysis. In 158 study patients (96.9%), the interval between baseline CT and BAL was within 7 days. The median follow-up duration for the study patients was 19.6 months. At the time of ILD diagnosis, 104 patients (63.8%) had a UIP pattern on chest CT, and the baseline characteristics according to CT pattern are presented in Table 1. Among the 59 patients showing a non-UIP pattern on chest CT, the most common diagnosis was unclassifiable IIP (33 patients, 55.9%), followed by IPF (15 patients, 25.4%) and connective tissue disease-related ILD (5 patients, 8.5%). The 15 patients diagnosed with IPF were confirmed through surgical lung biopsy and multidisciplinary discussion. The non-UIP group had a lower predicted percentage of diffusing capacity for carbon monoxide (DLco, 53% vs 62%, p = 0.030) compared with the UIP group (Table 1). In the entire study population, both antifibrotic agents and steroids were initiated after BAL. Antifibrotics were more frequently used in the UIP group than in the non-UIP group (80.8% vs 55.9%, p < 0.001), whereas steroids tended to be used more often in the non-UIP group (26.0% vs 40.7%, p = 0.051), although the difference was not statistically significant. Steroids were administered as maintenance therapy in patients with non-IPF ILD with a UIP pattern on chest CT, whereas they were used most in the setting of acute exacerbation in patients with IPF. At 1 year from baseline, fibrosis progression was observed in 24 of 163 patients (14.7%), with 10 patients demonstrating a decline in FVC of ⩾10%. Among these patients, 8 (80%) reported subjective worsening of respiratory symptoms at the time of FVC decline, and 6 (60%) had chest CT findings consistent with radiologic evidence of ILD progression. Three-year all-cause mortality was observed in 28.7% (32/163).
Characteristics of the study patients according to UIP pattern on chest CT.

Data are presented as the median (interquartile range) or number (percentage).
Obstructive lung disorder was defined as a post-bronchodilator FEV1/FVC ratio <0.70 on spirometry.
All patients who received anti-fibrotic therapy were initially treated with pirfenidone, and among them, three patients were switched to nintedanib due to adverse effects.
Among the 27 steroid users in the UIP group, 8 received steroids as maintenance therapy for non-IPF ILD, 14 for acute exacerbations of IPF, and 5 at the discretion of the clinician.
Fibrosis progression was defined as a decline of more than 10% in 1-year FVC or death from any cause within 1 year.
CT, computed tomography; CTD, connective tissue disease; DLco, diffusing capacity for carbon monoxide; FVC, forced vital capacity; HP, hypersensitivity pneumonitis; ILD, interstitial lung disease; IPF, idiopathic pulmonary fibrosis; NSIP, nonspecific interstitial pneumonia; UIP, usual interstitial pneumonia.
Cellular analysis of BAL fluid classified by UIP patterns on CT
According to our classification for cellular analysis of BAL, lymphocytic patterns defined as >20% or >15% were observed in 19.6% and 27.0% of all patients, respectively. Neutrophilic patterns defined as >4.5% or >3% were present in 60.1% and 65.0% of patients, respectively (Figure 2). There was no statistically significant difference in BAL fluid cellular analysis between the radiologic UIP (UIP and probable UIP patterns) and non-UIP groups, including proportion of isolated lymphocytosis (p > 0.05 for all comparisons; Supplemental Table 1).

Distribution of BAL cellular profiles according to radiologic UIP versus non-UIP groups.
Correlations between QCT and BAL fluid cellular analysis
In the correlation analysis between the BAL fluid cellular analysis and QCT results, BAL neutrophil levels showed a weak correlation with reticulation (r = 0.219; p = 0.005), honeycombing (r = 0.286; p < 0.001), and FS (r = 0.308; p < 0.001) in the whole lung, with these results remaining significant in the tested lobe (Figure 3). However, BAL lymphocyte levels did not show significant correlations with QCT values in either the whole lung or the tested lobe (Supplemental Figure 1). QCT results according to 3% and 4.5% cutoff levels for BAL neutrophils are presented in Table 2. In the high neutrophil group, the proportions of reticulation, honeycombing, and the FS were significantly higher than in the low neutrophil group (p < 0.05 for all comparisons).
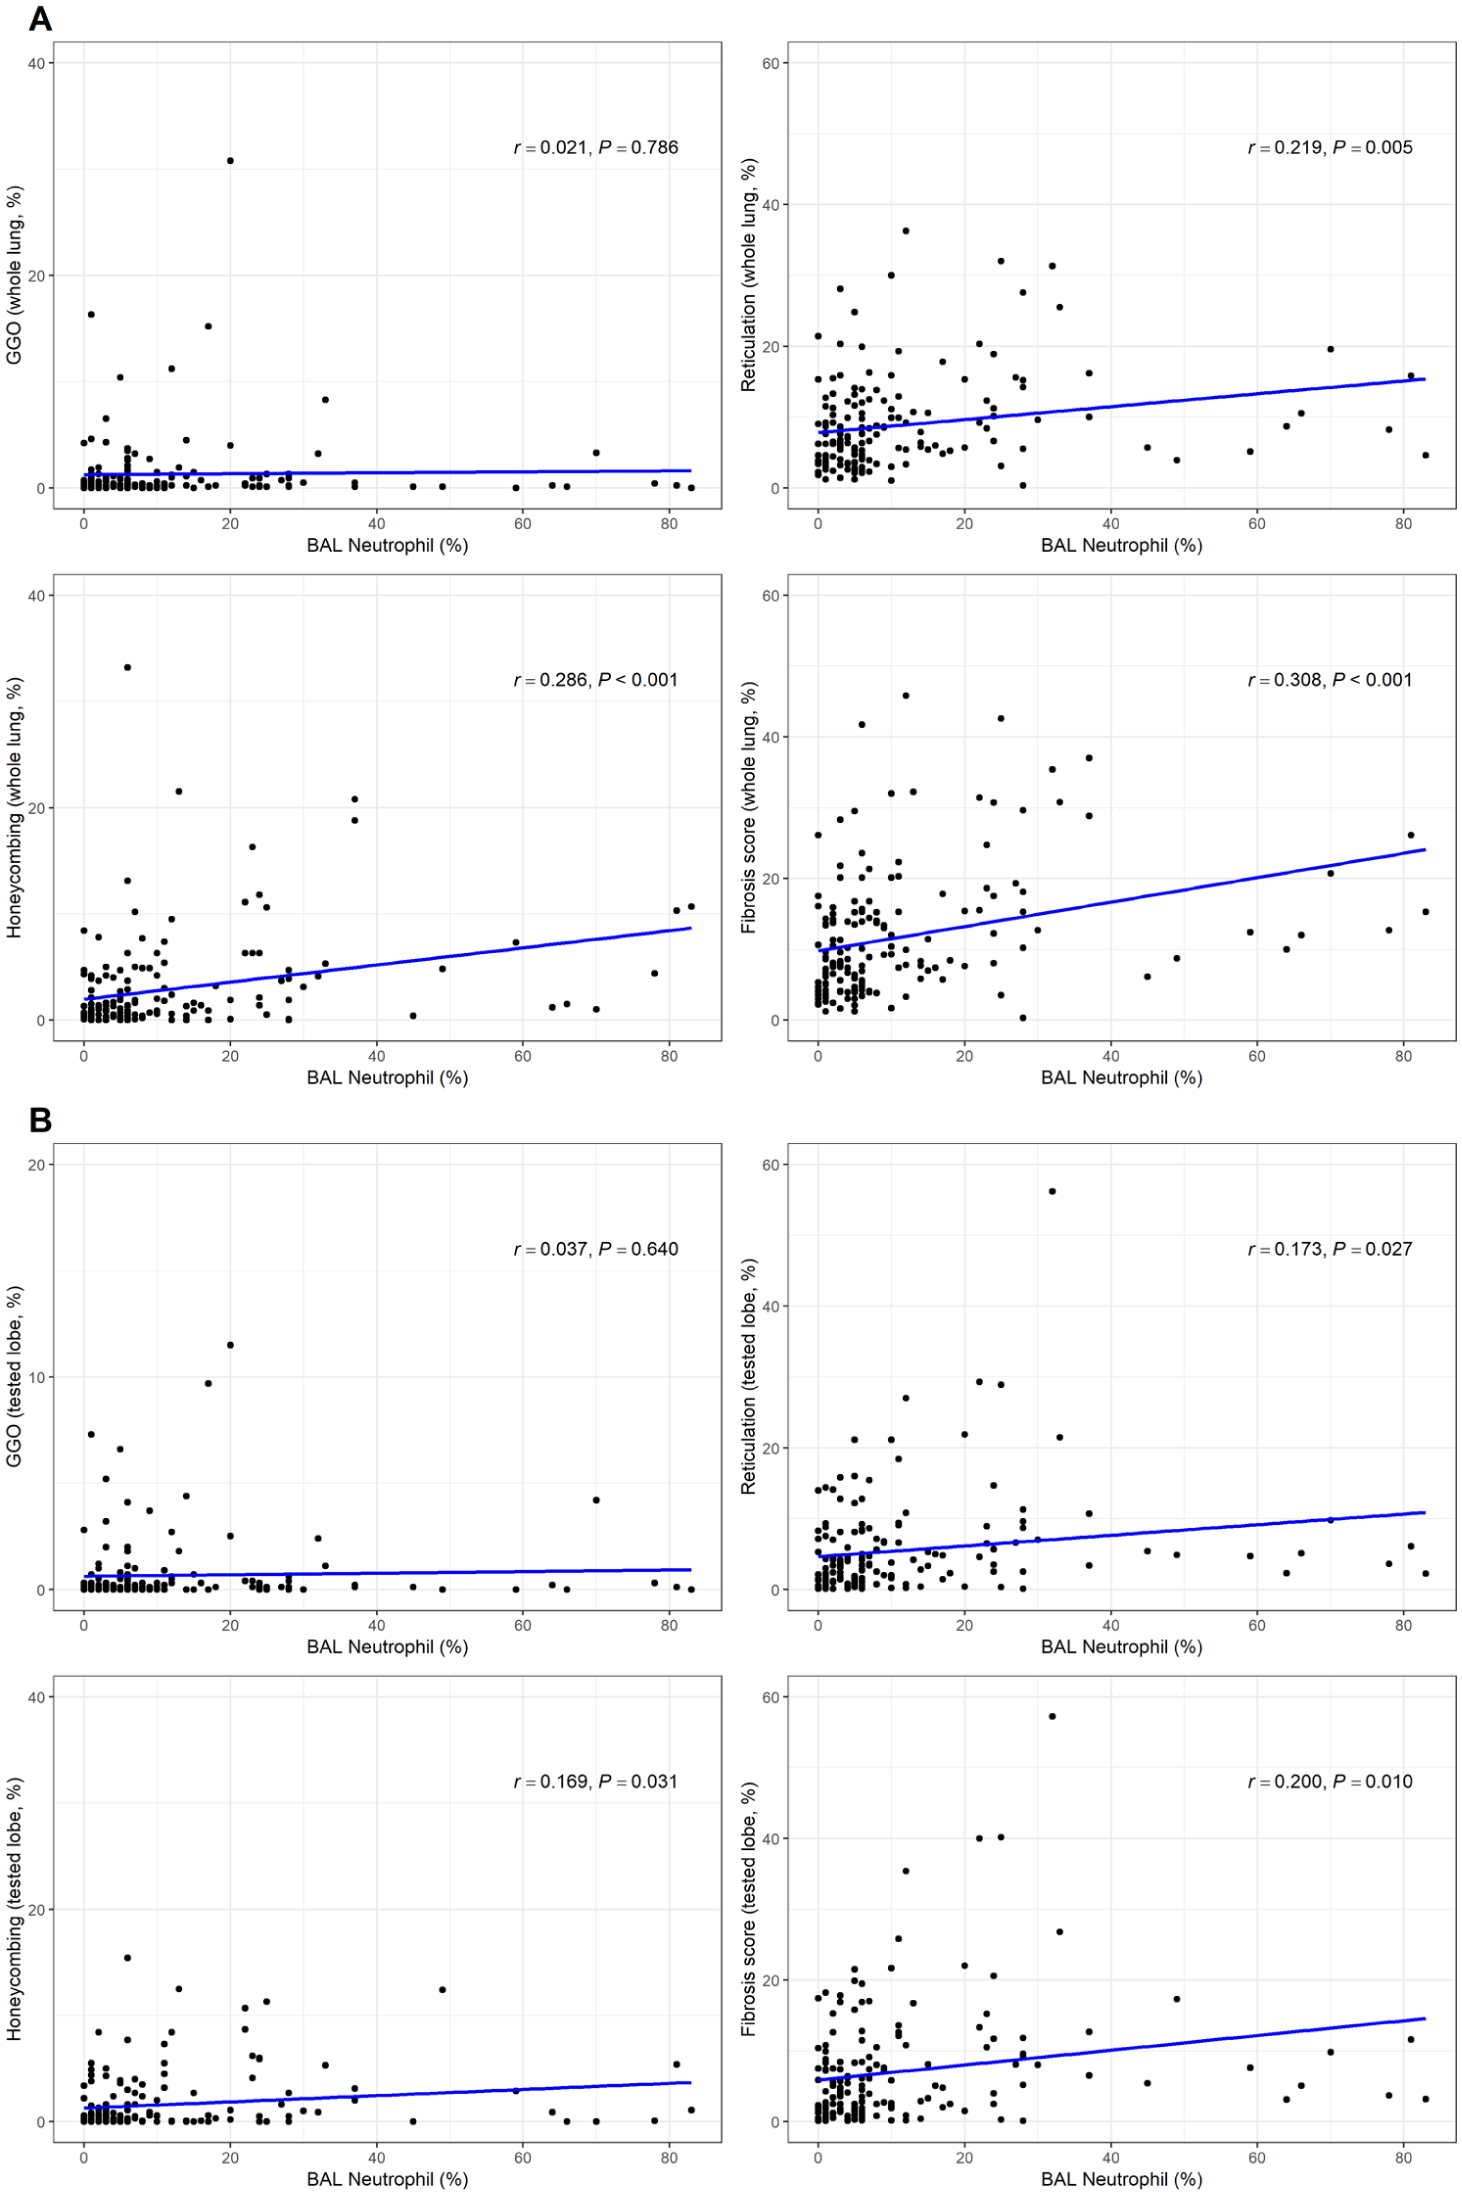
Scatter plot of automated CT quantification results against BAL neutrophil level. (a) QCT metrics analyzed on the whole lung and (b) QCT metrics analyzed on the tested lobe.
Comparison of CT imaging features and quantitative CT results based on neutrophil percentage in BAL.
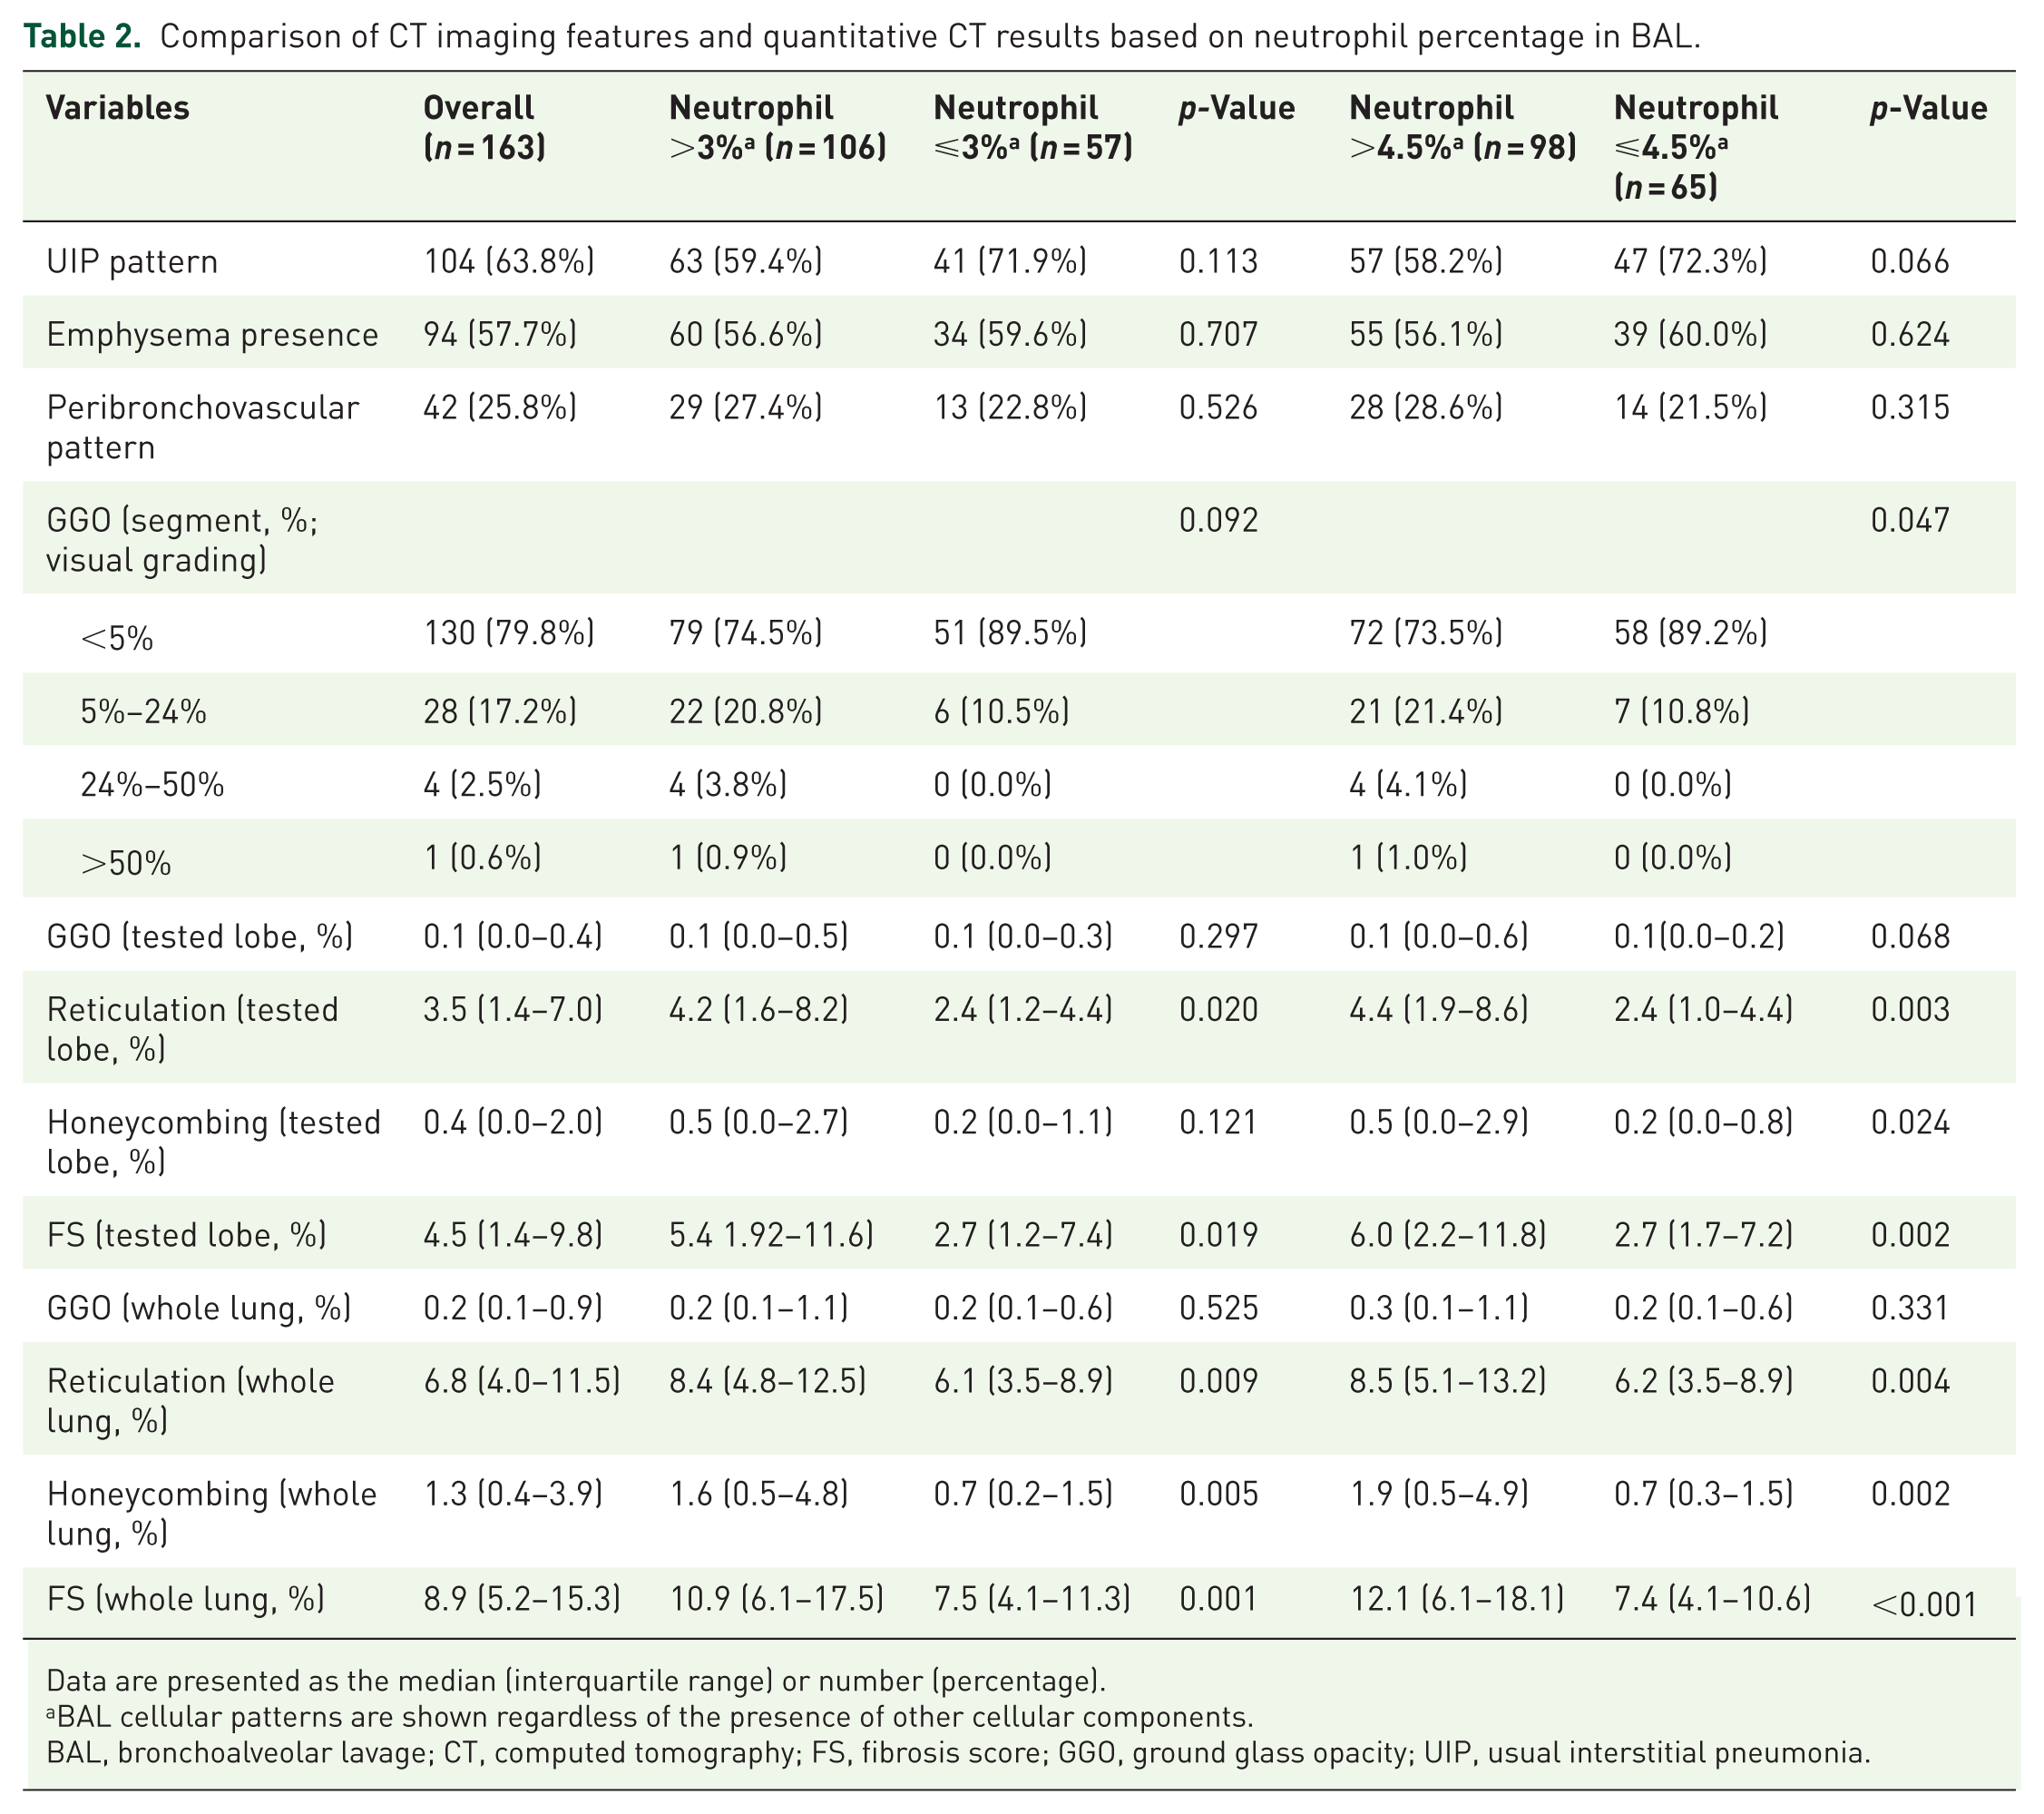
Data are presented as the median (interquartile range) or number (percentage).
BAL cellular patterns are shown regardless of the presence of other cellular components.
BAL, bronchoalveolar lavage; CT, computed tomography; FS, fibrosis score; GGO, ground glass opacity; UIP, usual interstitial pneumonia.
Prognostic factors for 3-year mortality
In the univariable Cox proportional hazard analysis, a lower FVC, lower DLco, and high FS on CT (⩾10% or 20%) were significant risk factors for 3-year all-cause mortality (Table 3). However, BAL neutrophil and lymphocyte levels were not significant predictors of 3-year mortality when converted into binary variables using different cutoff values. In the multivariable Cox proportional hazard analysis, a high FS above a cutoff value of 20% was a significant independent predictor of 3-year mortality (adjusted hazard ratio: 4.62 (95% confidence interval, 1.79–11.93); p = 0.002) (Table 3).
Cox proportional hazard analysis for 3-year all-cause mortality.
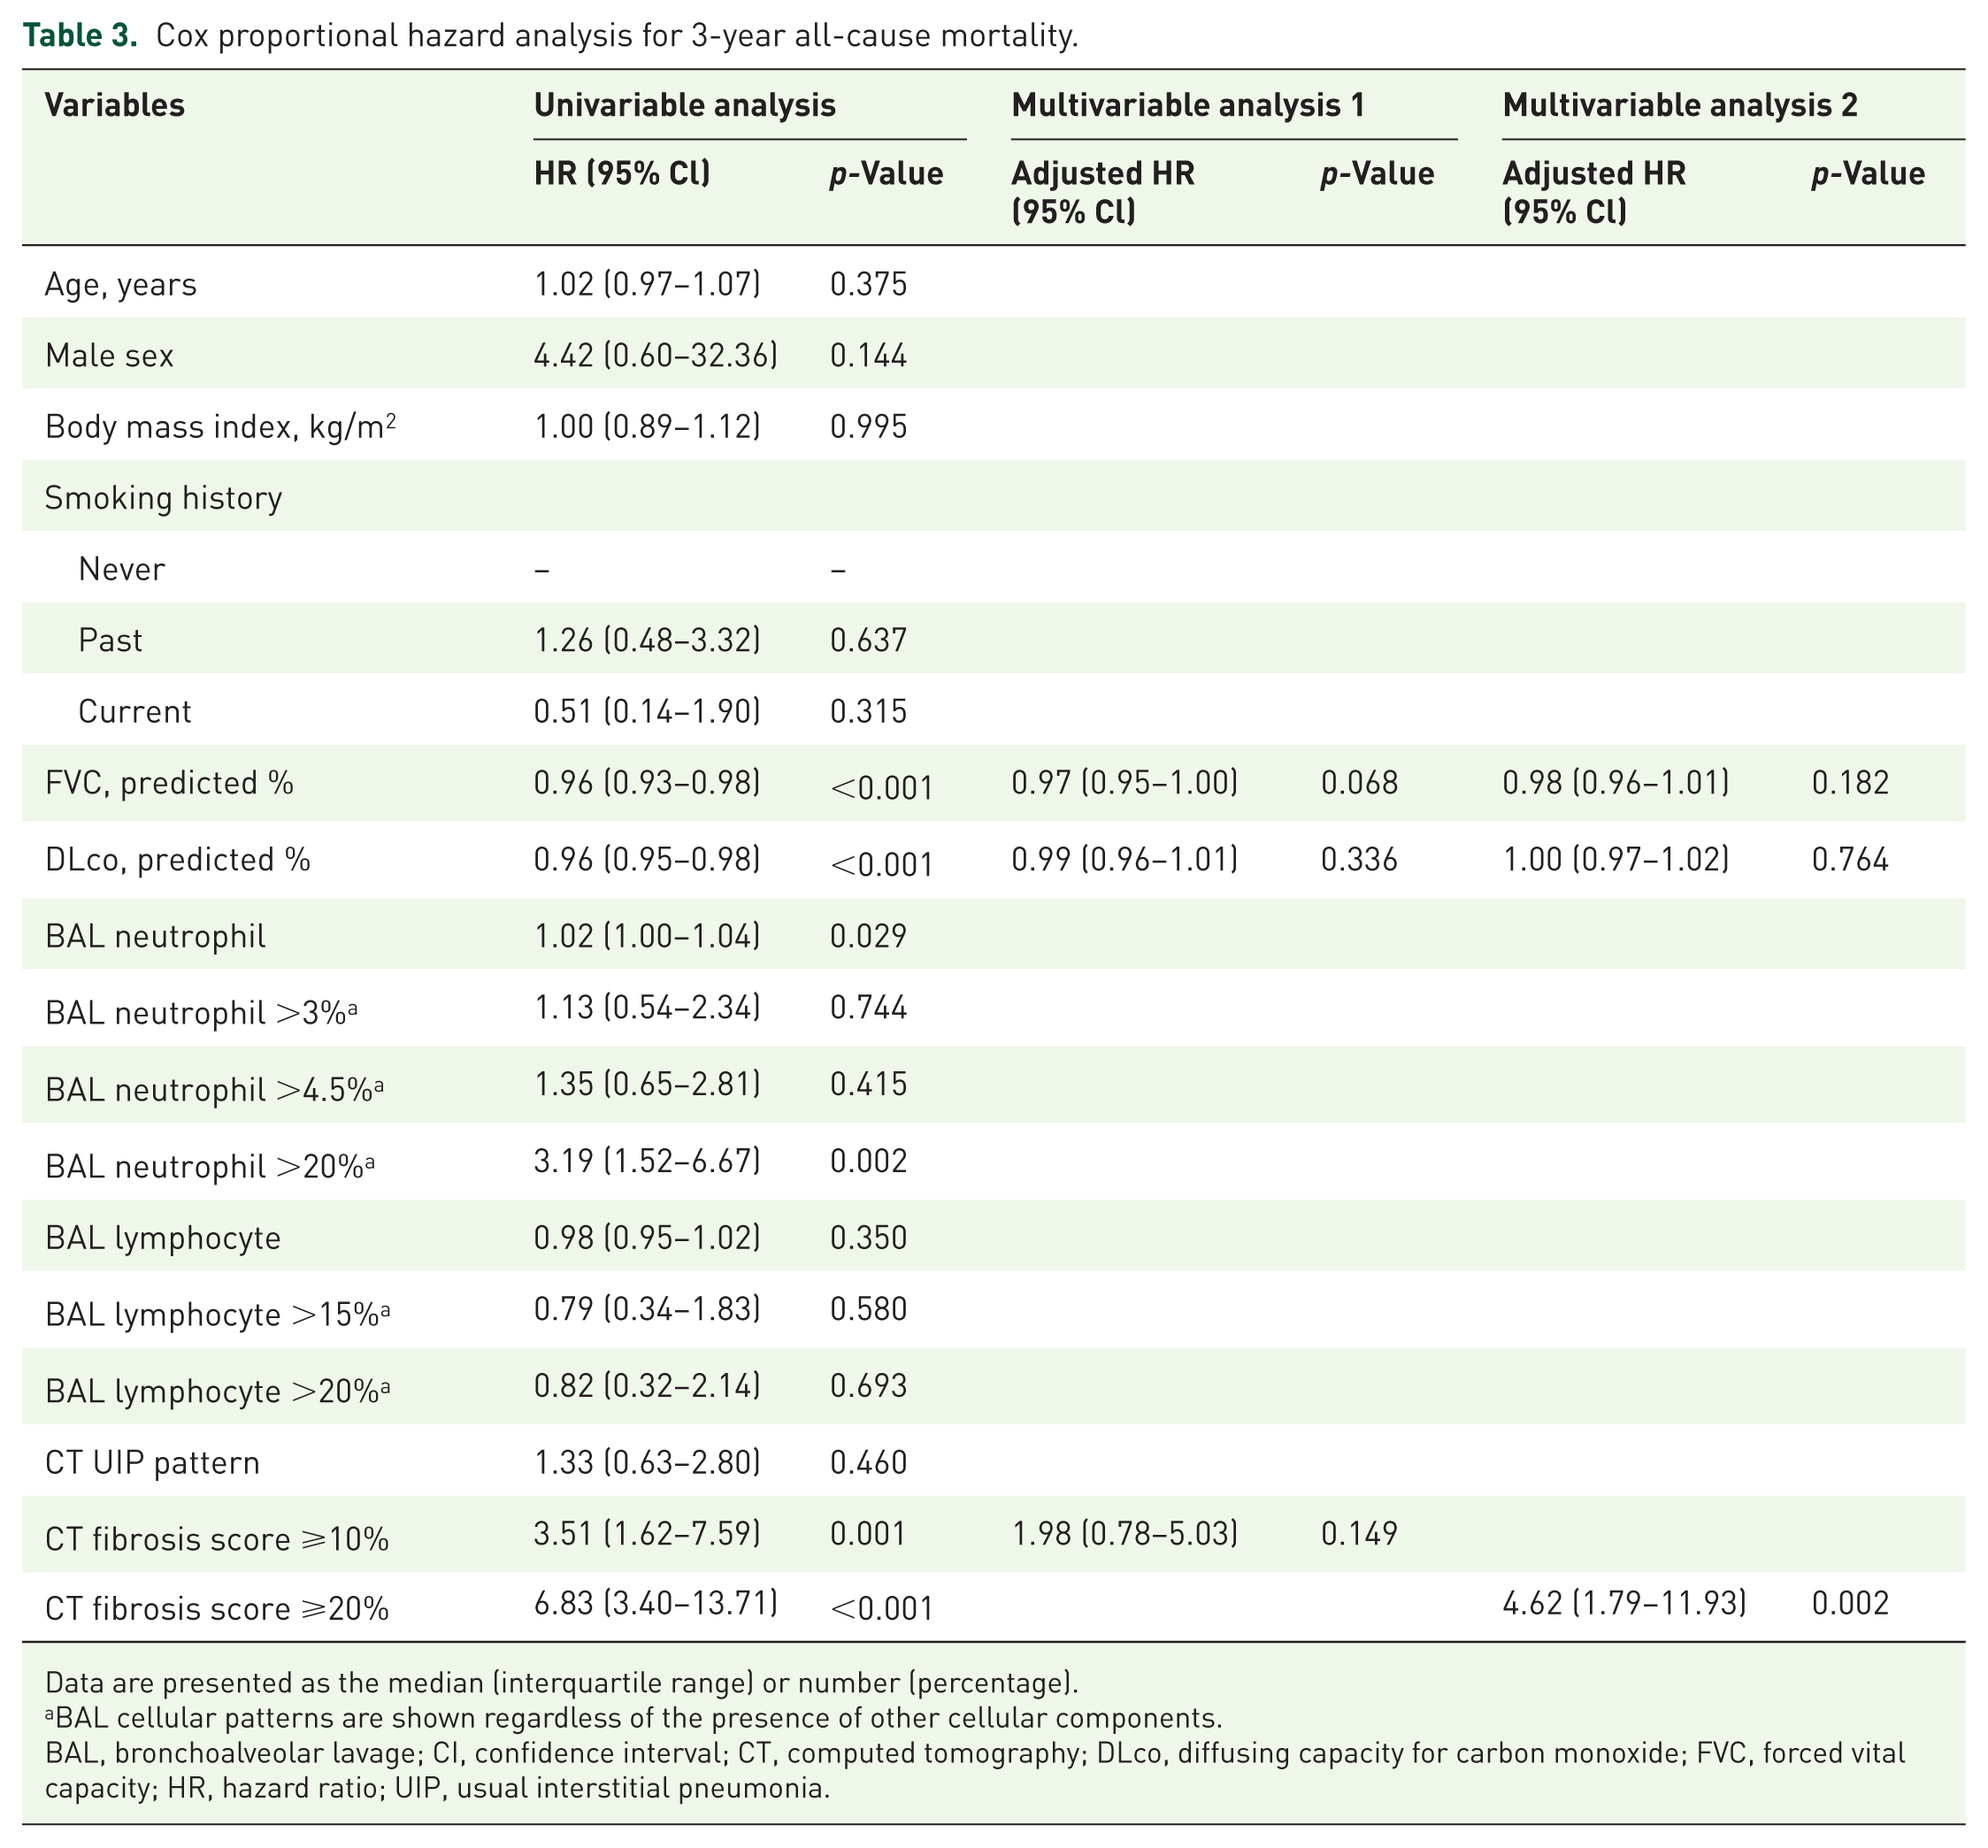
Data are presented as the median (interquartile range) or number (percentage).
BAL cellular patterns are shown regardless of the presence of other cellular components.
BAL, bronchoalveolar lavage; CI, confidence interval; CT, computed tomography; DLco, diffusing capacity for carbon monoxide; FVC, forced vital capacity; HR, hazard ratio; UIP, usual interstitial pneumonia.
Combination of CT quantification and BAL fluid cellular analysis for risk stratification
The characteristics of the two groups according to FS above or below the cutoff values (10% or 20%) are shown in Supplemental Table 2. Regardless of the cutoff values, the proportion of patients above the BAL neutrophil cutoff was significantly higher among those with a high FS. Among patients with FS ⩾10% on CT (n = 75), those with high BAL neutrophil levels showed more fibrosis progression than those with lower BAL neutrophil levels (p = 0.045 for BAL neutrophil >3%, p = 0.029 for BAL neutrophil >4.5%; Figure 4(a) and (b)). A similar but non-significant trend was observed in patients with an FS ⩾20% (n = 26) (p = 0.185 for BAL neutrophil >3%, p = 0.185 for BAL neutrophil >4.5%; Figure 4(c) and (d)). However, no significant difference in the 3-year survival rate was observed among all study patients based on BAL neutrophil levels (Supplemental Figure 2).
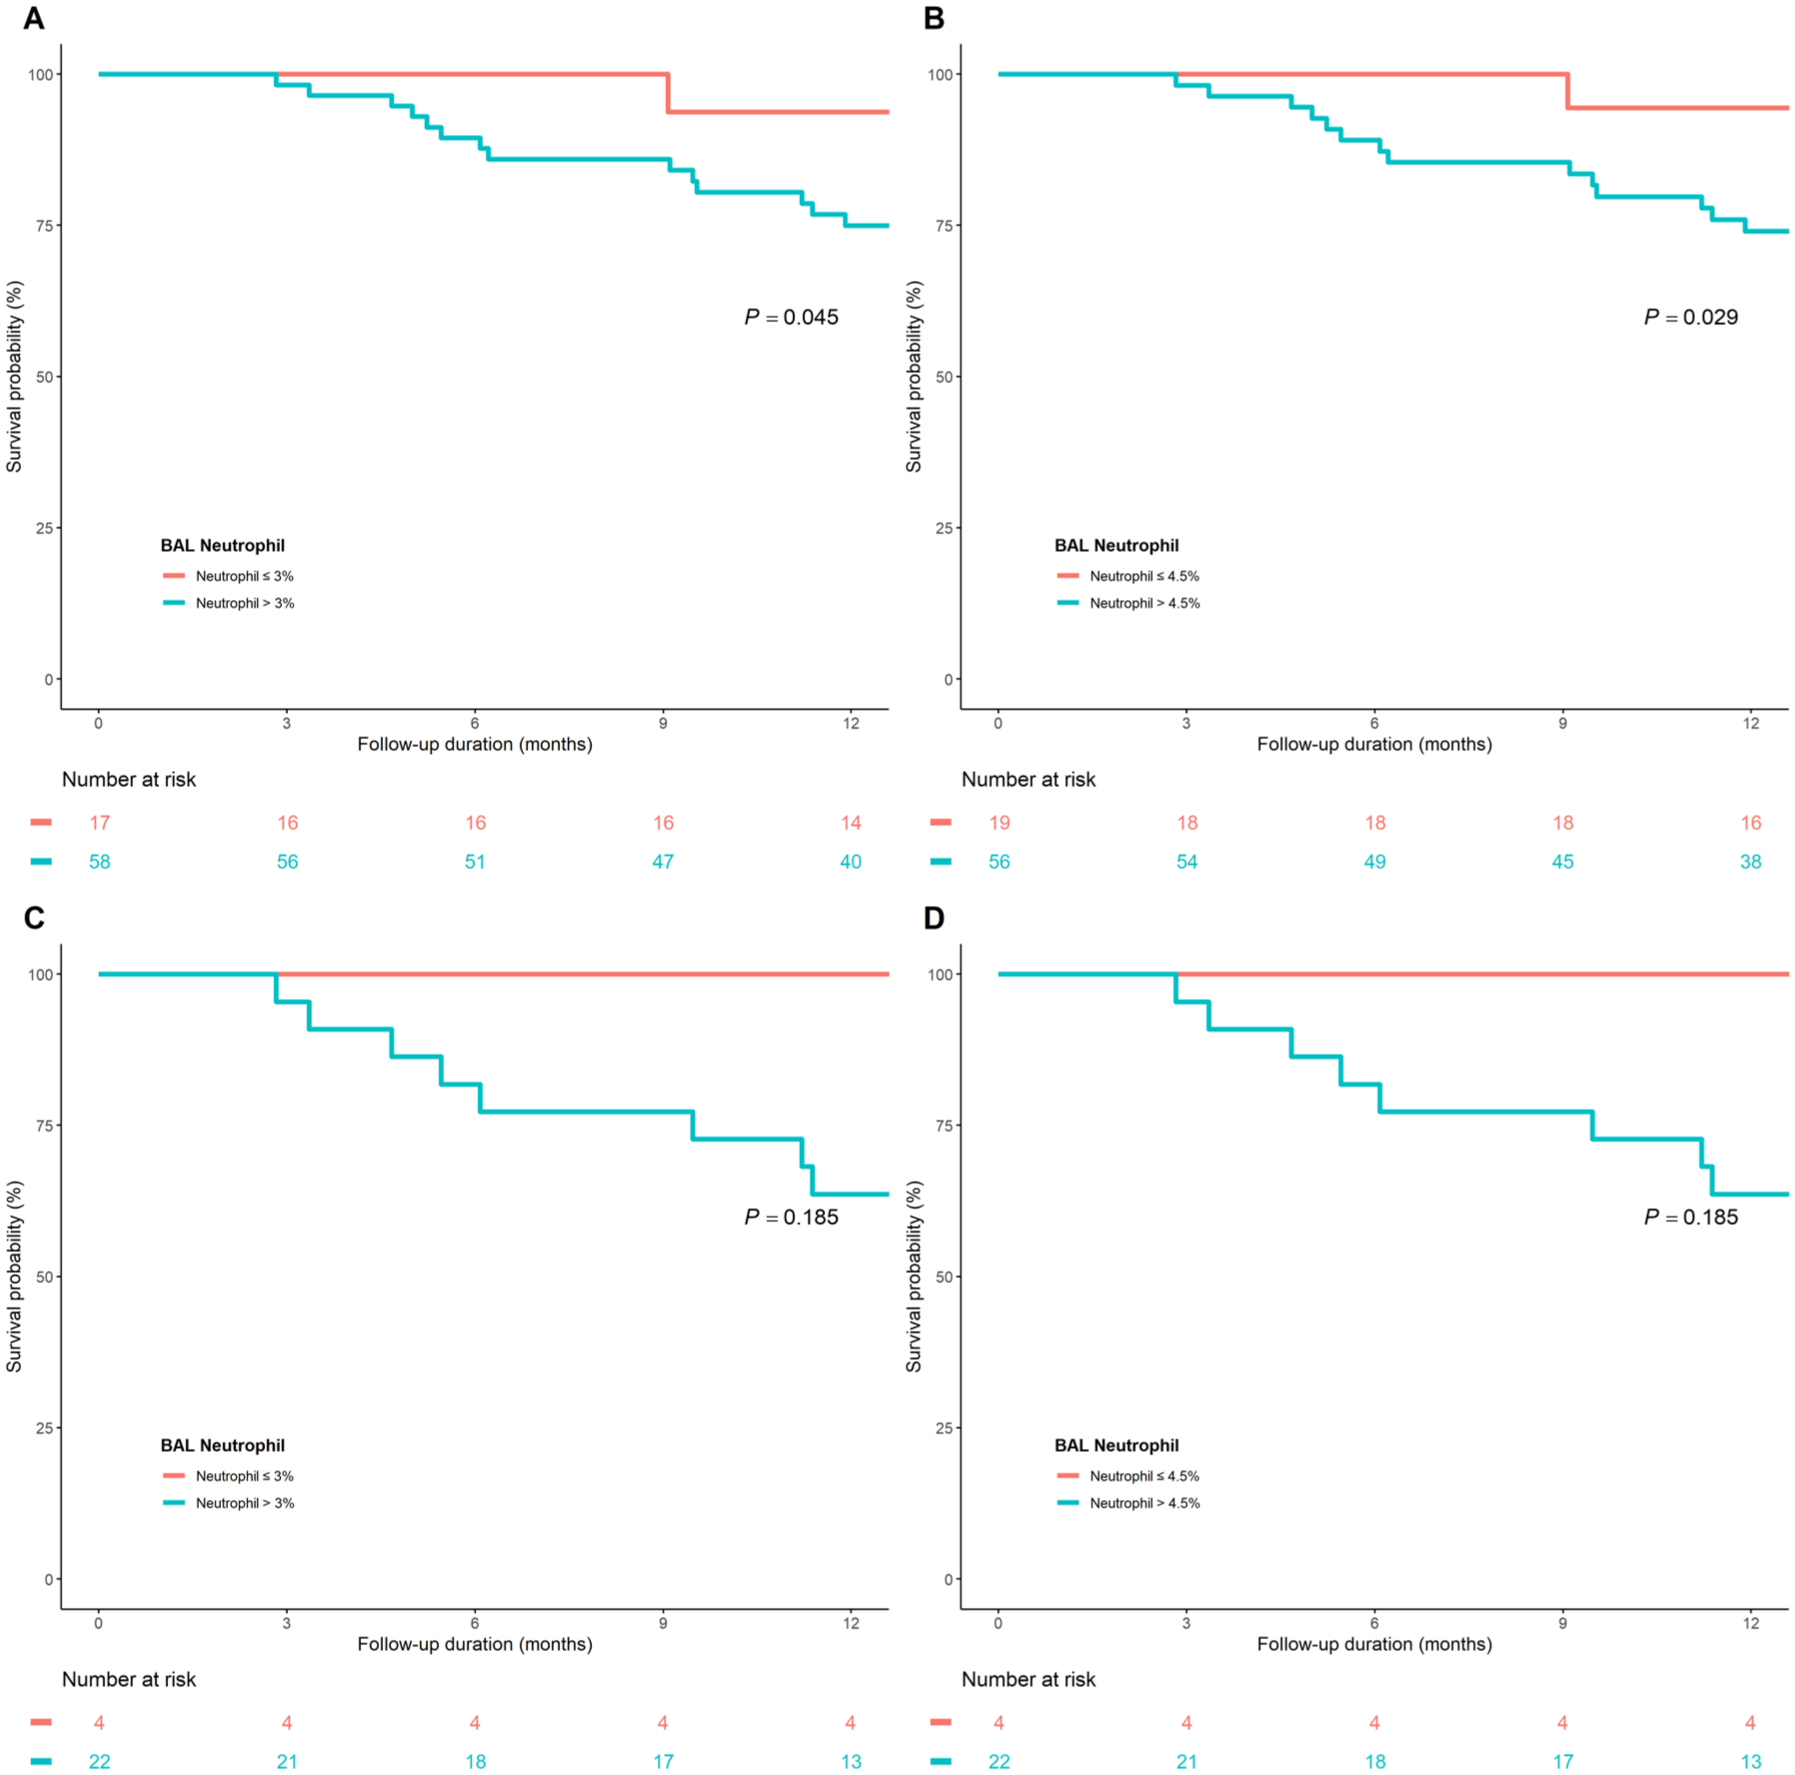
Comparison of fibrosis progression at 1 year according to BAL neutrophil levels in patients with high fibrosis scores. (a) Patients with fibrosis score ⩾10% stratified by a BAL neutrophil cutoff of 3%. (b) Patients with fibrosis score ⩾10% stratified by a BAL neutrophil cutoff of 4.5%. (c) Patients with fibrosis score ⩾20% stratified by a BAL neutrophil cutoff of 3%, and (d) Patients with fibrosis score ⩾20 stratified by a BAL neutrophil cutoff of 4.5%.
Among all patients, the steroid-treated patients had a worse 3-year survival rate (55.4% [95% CI, 39.0–71.8] vs 79.0% [95% CI, 64.2–82.2], p = 0.001) than the non-steroid-treated patients (Supplemental Figure 3). Comparisons of baseline characteristics and CT findings, including QCT metrics, are presented in Supplemental Table 3 according to steroid treatment. In patients treated with steroids (n = 51), those with a BAL lymphocyte value above 15% tended to have a more favorable 3-year survival rate than those with a value below the cutoff, with the difference approaching statistical significance (3-year survival rate: 73.1% [95% CI, 50.2–96.0] vs 41.6% [95% CI, 17.7–65.5], p = 0.073, Figure 5(a)). In steroid-treated patients with a BAL lymphocyte value above 15%, those with a FS ⩾20% showed worse 3-year survival rate (3-year survival rate: 41.7% [95% CI, 0.0–85.2] vs 88.9% [95% CI, 68.3–100.0], p = 0.039) than those with a lower FS (Figure 5(b)). In patients treated with steroids (n = 51), the proportion of honeycombing (0.4% vs 1.3%, p = 0.050; Supplemental Table 4) in the tested lobe tended to be lower than in the low lymphocyte group compared with the high lymphocyte group (lymphocyte >15%), but this was not consistent across the whole of the lung. In addition, there was no difference in the proportion of GGO in the tested lobe or whole lung between the two groups (Supplemental Table 4).

Kaplan–Meier curves for 3-year mortality in patients undergoing steroid treatment. (a) Patients treated with steroids stratified by a BAL lymphocyte cutoff value of 15%. (b) Steroid-treated patients with BAL lymphocyte levels >15%, stratified by a fibrosis score of ⩾20%.
Discussion
In this study, we examined correlations between BAL fluid cellular analysis and automated QCT findings in patients with fibrotic ILD, focusing on potential prognostic implications. BAL fluid cellular analysis alone neither distinguished between UIP and non-UIP patterns nor provided independent prognostic value. BAL neutrophil levels showed a weak positive correlation with FS on CT, while BAL lymphocyte levels did not show a remarkable correlation with QCT metrics, including GGO. Patients with high FS had a worse prognosis, and within such patients with high FS at baseline, those showing high BAL neutrophil levels showed more fibrosis progression at 1-year follow-up. In a subgroup analysis of patients treated with steroids, those with BAL lymphocytosis tended to have a better prognosis; however, in steroid-treated patients with high BAL lymphocyte levels, those with an FS ⩾20% had worse outcomes. These findings demonstrate that integrating BAL with QCT analysis can help further risk stratification in patients with fibrotic ILD.
Although BAL is conventionally considered adjunctive for the diagnosis and differentiation of ILD, 9 its diagnostic utility for ILD, including IPF, remains debated.11,12 In fact, one study reported that BAL was used in the diagnosis of ILD in 50% (IQR 20%–80%) of cases, underscoring the lack of consensus or standardized guidelines. 33 Early studies suggested associations between specific cellular patterns in BAL and ILDs. 9 Recently, BAL lymphocytosis has been recognized as helping diagnose hypersensitivity pneumonitis. 10 However, several factors can influence the interpretation of BAL, such as smoking history, age, and coexistence with infection.34–36 In addition, BAL fluid cellular analysis has failed to differentiate between biopsy-confirmed UIP and nonspecific interstitial pneumonia, 36 with the sensitivity and specificity of BAL lymphocytosis for hypersensitivity pneumonia being only approximately 60%–70%. 37 These findings indicate that BAL fluid cellular analysis plays a supplemental, rather than primary, role in ILD diagnosis and classification. Consistent with previous studies, we found that BAL fluid cellular composition did not significantly differ between radiologic UIP and non-UIP patterns, defined according to the 2018 American Thoracic Society guideline. 31
Although BAL fluid cellular analysis showed difficulty clearly distinguishing between diagnoses or CT classifications, it was suggested that particular results may be associated with certain CT patterns. 14 Grant-Orser et al. recently reported that the BAL lymphocyte levels showed a weak negative correlation with CT fibrosis but no correlation with CT GGO. 14 However, in this previous study, the radiologic features on CT were visually estimated by a thoracic radiologist, and the location of the BAL sampling was not considered, which may have limited the accuracy of the interpretation. Automated CT quantification offers a more objective and reproducible method compared to visual assessment and can be used for diagnosing and/or predicting the prognosis of ILD.38–40 In our study using automated QCT, BAL neutrophils showed significant weak correlations with CT findings such as reticulation, honeycombing, and FS in both the whole lung and the tested lobe, whereas BAL lymphocytes showed no correlation. A previous study reported that blood neutrophil levels correlated with the quantitative extent of lung fibrosis, 41 suggesting that neutrophils, whether measured in blood or BAL fluid, may serve as a marker reflecting the severity of fibrosis. However, in our study, the BAL lymphocyte measured in the whole lung or in the BAL tested lobe did not show a correlation with the objectively quantified extent of radiologic GGO, which aligns with a previous study. 14 This may be because GGO observed at current CT resolution can represent inflammation, but it can also indicate pathological early fibrosis.
Previous studies reported that BAL fluid cellular analysis was associated with prognosis and treatment response in ILD patients.13,15,42,43 While later studies failed to confirm these findings, one study enrolling 156 patients with biopsy-proven IPF reported that an increased percentage of BAL neutrophils was an independent prognostic factor. 42 In our study, BAL lymphocytosis and neutrophilia were not associated with prognosis in patients with fibrotic ILD. When we stratified patients based on QCT results, we found that among those with an FS ⩾10%, patients with high BAL neutrophil levels showed more fibrosis progression at 1 year, which suggests that combining BAL fluid cellular analysis with automated CT quantification might help predict prognosis, particularly for early outcomes. In addition, Barnett et al. reported that BAL lymphocytosis is rare in patients with extensive fibrosis or a UIP pattern on CT, and that a higher BAL lymphocyte proportion was associated with a lower likelihood of progression. 13 In a subgroup analysis of patients treated with steroids, those with BAL lymphocytosis tended to have a better prognosis, though this finding was not statistically significant. 15 Although not statistically significant and limited by sample size, our study raised the possibility that steroid-treated patients with BAL lymphocytosis may have better outcomes. Further studies are needed to determine optimal cutoffs for BAL fluid cellular analysis for predicting prognosis and treatment response, exploring its utility in combination with CT patterns and QCT results, and assessing its application in real-world clinical practice.
This study has several limitations. First, as a single-center study, it may be challenging to generalize our findings. However, this could also be considered a strength, as multicenter studies often introduce variability in both patient selection for BAL and BAL techniques. Second, selection bias may exist because only patients who underwent BAL during diagnosis were retrospectively included. Differentiating UIP from non-UIP patterns on CT is limited by interobserver variability. Moreover, because both imaging patterns occur across multiple ILDs, stratifying patients solely by imaging pattern, without multidisciplinary clinical diagnosis, restricts the interpretability of our findings. Since our study population was skewed toward the UIP pattern (63%), males (88%), and IPF (63%), caution is needed when applying our findings to other ILD populations with different characteristics. Third, although the location of the BAL was identified, automated quantification at the segment level was unfeasible with the current software, and only lobe-level analysis was conducted. Despite these limitations, our study has significant strengths, including careful consideration of the specific BAL location, implementation of automated CT quantification, and maintenance of relatively short intervals between CT and BAL procedures in various fibrotic ILD. Fourth, the number of patients in the lymphocytic group was relatively small, which may limit the statistical power to detect differences in ILD subtype, prognosis, or treatment response.
Conclusion
In conclusion, the neutrophilic pattern of BAL showed a significant weak positive correlation with quantified extent of fibrosis on CT, which is associated with poor prognosis, and the combination of BAL neutrophilia and high CT fibrosis score suggests increased risk of early disease progression. While BAL fluid cellular analysis alone has limited value in distinguishing ILD patterns or predicting outcomes, its integration with quantitative CT metrics provides additional prognostic information in fibrotic ILD patients, indicating that the integration of these two modalities may enhance risk stratification in clinical practice, warranting further study.
Supplemental Material
sj-docx-1-tar-10.1177_17534666251393075 – Supplemental material for Clinical implications of bronchoalveolar lavage fluid cellular analysis in fibrotic interstitial lung disease combined with CT quantification
Supplemental material, sj-docx-1-tar-10.1177_17534666251393075 for Clinical implications of bronchoalveolar lavage fluid cellular analysis in fibrotic interstitial lung disease combined with CT quantification by Bora Lee, Hyun Seok Kwak, Hyo Sin Cho, Jang Ho Lee, Joon Beom Seo, Jooae Choe and Ho Cheol Kim in Therapeutic Advances in Respiratory Disease
Supplemental Material
sj-docx-2-tar-10.1177_17534666251393075 – Supplemental material for Clinical implications of bronchoalveolar lavage fluid cellular analysis in fibrotic interstitial lung disease combined with CT quantification
Supplemental material, sj-docx-2-tar-10.1177_17534666251393075 for Clinical implications of bronchoalveolar lavage fluid cellular analysis in fibrotic interstitial lung disease combined with CT quantification by Bora Lee, Hyun Seok Kwak, Hyo Sin Cho, Jang Ho Lee, Joon Beom Seo, Jooae Choe and Ho Cheol Kim in Therapeutic Advances in Respiratory Disease
Footnotes
Acknowledgements
None.
Declarations
Supplemental material
Supplemental material for this article is available online.
Artificial intelligence disclaimer
We did not use Generative Artificial Intelligence in creating text, references, images, or other content of the study.
References
Supplementary Material
Please find the following supplemental material available below.
For Open Access articles published under a Creative Commons License, all supplemental material carries the same license as the article it is associated with.
For non-Open Access articles published, all supplemental material carries a non-exclusive license, and permission requests for re-use of supplemental material or any part of supplemental material shall be sent directly to the copyright owner as specified in the copyright notice associated with the article.