
Abstract
Background:
The relationship between albumin-corrected anion gap (ACAG) and in-hospital mortality in critically ill patients with COPD remains unclear.
Objective:
This study investigated the association between ACAG levels and the risk of in-hospital mortality in critically ill patients with COPD.
Design:
A retrospective cohort study.
Methods:
This study uses data from the Medical Information Mart for Intensive Care (MIMIC-IV) database. The receiver operating characteristic (ROC) curve was used to determine the optimal threshold for ACAG, and participants were divided into two categories based on this threshold. The primary outcome was in-hospital mortality. We employed univariable and multivariable logistic regression analyses and Kaplan–Meier (KM) survival curves to assess the relationship between ACAG and the risk of in-hospital mortality. Moreover, subgroup analyses were conducted.
Results:
A total of 2121 patients (54.7% male) were enrolled in the study. The in-hospital mortality rate was 18.9%. In patients with elevated ACAG levels, the in-hospital mortality rate was significantly higher than in those with lower ACAG levels (27.7% vs 11.3%, p < 0.001). Multivariate logistic regression analysis indicated that even after mitigating for potential confounders, patients in the high ACAG group had significantly greater odds of in-hospital mortality across all models (Model I: OR = 3.000, 95% CI: 2.383–3.777, p < 0.001; Model II: OR = 3.021, 95% CI: 2.397–3.808, p < 0.001; Model III: OR = 1.916, 95% CI: 1.458–2.519, p < 0.001). Patients with elevated ACAG levels have more than twice the risk of in-hospital mortality compared to those with lower levels (hazard ratio (HR): 2.1277, 95% CI: 1.7490–2.5884).
Conclusion:
This study demonstrates that elevated ACAG levels are strongly associated with an increased risk of in-hospital mortality in critically ill COPD patients, suggesting that ACAG could serve as a potential predictor of adverse outcomes in this patient population.
Keywords
Introduction
Chronic obstructive pulmonary disease (COPD) is a multifaceted condition characterized by persistent airflow limitation. 1 COPD is the third leading cause of death worldwide, and a study evaluating the macroeconomic burden of the disease revealed that it imposes a significant economic burden, with projected costs exceeding four trillion dollars between 2020 and 2050. 2 Acute exacerbations of COPD often necessitate critical care interventions, contributing to substantial morbidity and mortality.1,3 Despite advancements in critical care, mortality rates among critically ill COPD patients remain high. 4
Acid-base disturbances are commonly encountered in the intensive care unit (ICU) setting. 5 The serum anion gap is a reliable clinical marker for diagnosing metabolic acidosis and assessing overall acid-base balance. Previous studies have indicated that the anion gap has emerged as a potential prognostic biomarker in various critically ill patients.6,7 The anion gap, a calculated value representing the difference between measured cations and anions, is traditionally used to assess acid-base disturbances. However, hypoalbuminemia, which is prevalent in critically ill patients, can influence the AG. 5 Correcting for albumin levels provides a more accurate reflection of the patient’s metabolic status. Emerging evidence suggests that albumin-corrected anion gap (ACAG) may serve as a robust prognostic biomarker in critically ill patients, with studies demonstrating its association with mortality in conditions such as sepsis, 8 acute pancreatitis, 9 asthma, 10 acute myocardial infarction, 11 and kidney disease. 12
Despite growing interest in ACAG as a prognostic marker, its association with in-hospital mortality, specifically in critically ill COPD patients, remains underexplored. Given the substantial mortality risk associated with COPD exacerbations in critically ill patients, identifying reliable prognostic markers is crucial for improving patient outcomes. This study aims to investigate the association between ACAG and in-hospital mortality in critically ill COPD patients. By elucidating this relationship, the findings may contribute to risk stratification and enhance clinical decision-making for this population.
Material and methods
Source of data
This retrospective cohort study utilized data from the MIMIC-IV (v1.0) database, 13 encompassing electronic health records of 76,540 adult ICU patients admitted to Beth Israel Deaconess Medical Center in Boston, Massachusetts, from 2008 to 2019. For the present study, author M.G. met the required prerequisites by completing the Collaborative Institutional Training Initiative (CITI) program and successfully passing the exams on “Conflicts of Interest” and “Data or Specimen Only Research” (ID: 45355193), thereby gaining access to the database for data extraction. The reporting of this study conforms to the Strengthening the Reporting of Observational Studies in Epidemiology (STROBE) statement (Supplemental Table S1). 14
Study population
Patients aged 18 or older who were diagnosed with COPD, according to the International Classification of Diseases (ICD)-9 and ICD-10 codes, were included in this study (Supplemental Table S2). Exclusion criteria: (a) patients with ICU readmissions and repeated hospital admission, (b) patients with an ICU length of stay less than 24 h, (c) missing anion gap and albumin data.
Data extraction
Structured Query Language (SQL) was utilized to extract relevant medical data, including demographic details, laboratory indicators, comorbidities, scoring systems, and in-hospital mortality information from the MIMIC-IV database 13 using script codes obtained from GitHub (https://github.com/MIT-LCP/mimic-iv). We extracted variables such as age, gender, length of stay (LOS) in the ICU, LOS in the hospital, Simplified Acute Physiology Score II (SAPS II), Sequential Organ Failure Assessment (SOFA), and Charlson Comorbidity Index (CCI). The extracted laboratory parameters included a complete blood count (CBC), which encompasses hemoglobin, white blood cells (WBC), red blood cells (RBC), platelets, mean corpuscular hemoglobin concentration (MCHC), and hematocrit, as well as additional tests such as blood urea nitrogen (BUN), creatinine, bicarbonate, sodium, potassium, chloride, and glucose. ICD-9 and ICD-10 codes were used to identify comorbidities such as cerebrovascular disease, malignant cancer, obesity, severe liver disease, renal disease, coronary artery disease (CAD), congestive heart failure, diabetes mellitus, and hypertension. Extracted vital signs included mean blood pressure (MBP), respiration rate, heart rate, and oxygen saturation. Data on interventions included mechanical ventilation, diuretic use, and renal replacement therapy (RRT). Data on whether a patient died during their hospital stay were also extracted. When a variable was measured multiple times on the first day of admission, the mean value was utilized. To reduce potential bias, variables with more than 20% missing values were omitted from the analysis. In the present study, missing values accounted for less than 1%. All laboratory variables and disease severity scores were obtained from the data collected within the first 24 h after admission to the ICU. Anion gap (AG) was computed with the formula: AG (mmol/L) = (Sodium + Potassium)−(Chloride + Bicarbonate). The albumin-corrected anion gap (ACAG) was subsequently derived using: ACAG = AG + (4.4–Albumin (g/dL)) × 2.5. 15
Outcome measures
The primary outcome measure was mortality during hospitalization, while secondary outcomes comprised the length of stay (LOS) in the ICU and the length of hospital stay.
Statistical analysis
The normality of continuous variables was evaluated using the Kolmogorov–Smirnov test. For normally distributed data, variables were expressed as mean ± standard deviation (SD) and compared using the independent sample t-test. For non-normally distributed data, variables were presented as the median and interquartile range (IQR) and compared using the Mann–Whitney U test. Categorical variables were reported as counts and percentages and were compared between groups using either the Pearson chi-square test or Fisher’s exact test. Receiver operating characteristic (ROC) curve analysis was used to determine the optimal cut-off levels of ACAG for predicting in-hospital mortality, and the area under the ROC curve (AUC) was measured. The optimal cut-off point was identified by calculating Youden’s index, which was used to divide patients into low- and high-ACAG groups. Univariate and multivariate regression analyses were performed to evaluate the association between ACAG and in-hospital mortality among critically ill COPD patients. Variables with p-values <0.05 from the univariate analysis and clinically relevant and prognostically associated potential confounders were incorporated into the multivariate analysis. Model I was unadjusted, while Model II was adjusted for age and gender. Model III was adjusted for age, gender, CCI, SAPS II Score, SOFA, hemoglobin, WBC, RBC, platelets, glucose, MCHC, hematocrit, BUN, creatinine, mean arterial pressure, SpO2, hypertension, diabetes, renal disease, severe liver disease, malignant cancer, cerebrovascular disease, mechanical ventilation, and renal replacement therapy. Kaplan–Meier survival curves were plotted, and the log-rank test was conducted to assess the differences in survival rates between high and low ACAG groups. Additionally, subgroup analyses were conducted based on gender, age, hypertension, diabetes, congestive heart failure, renal disease, severe liver disease, malignant cancer, cerebrovascular disease, and mechanical ventilation. All statistical analyses were conducted using SPSS version 26.0 (IBM Corp., Armonk, NY, USA) and MedCalc version 19.6 software (MedCalc Software bv, Ostend, Belgium), with two-tailed p-values < 0.05 considered statistically significant.
Results
Study population characteristics
A total of 2121 critically ill COPD patients were enrolled in this study. The selection process for patients is presented in Figure 1. The median age of the patients included in the study was 71 years (IQR: 62–80 years), with 54.7% being male. Out of 2121 patients, 400 died during hospitalization, yielding an in-hospital mortality rate of 18.9%. Table 1 displays the clinical characteristics of participants based on their survival status, including the survival and death groups. Deceased patients were significantly older and exhibited more severe illness, as indicated by higher SOFA and SAPS II scores. They also had a more significant burden of comorbidities, including a higher Charlson Comorbidity Index, as well as hypertension, severe liver disease, cancer, and cerebrovascular disease. Furthermore, these patients were more likely to require renal replacement therapy and mechanical ventilation compared to surviving patients (all p < 0.05). Hemoglobin, RBC, platelet, MCHC, bicarbonate, and hematocrit levels were lower in the death group compared to the survival group (all p < 0.05). In contrast, WBC, glucose, BUN, anion gap, ACAG, and creatinine levels were higher in the death group than in the survival group (all p < 0.05). Compared to survivors, patients who died had shorter hospital stays but longer stays in the ICU (all p < 0.05). The detailed baseline characteristics of the survival and death groups are presented in Table 1.

Flowchart illustrating the selection of patients.
Baseline characteristics of the survivors and non-survivors groups of critically ill patients with COPD.
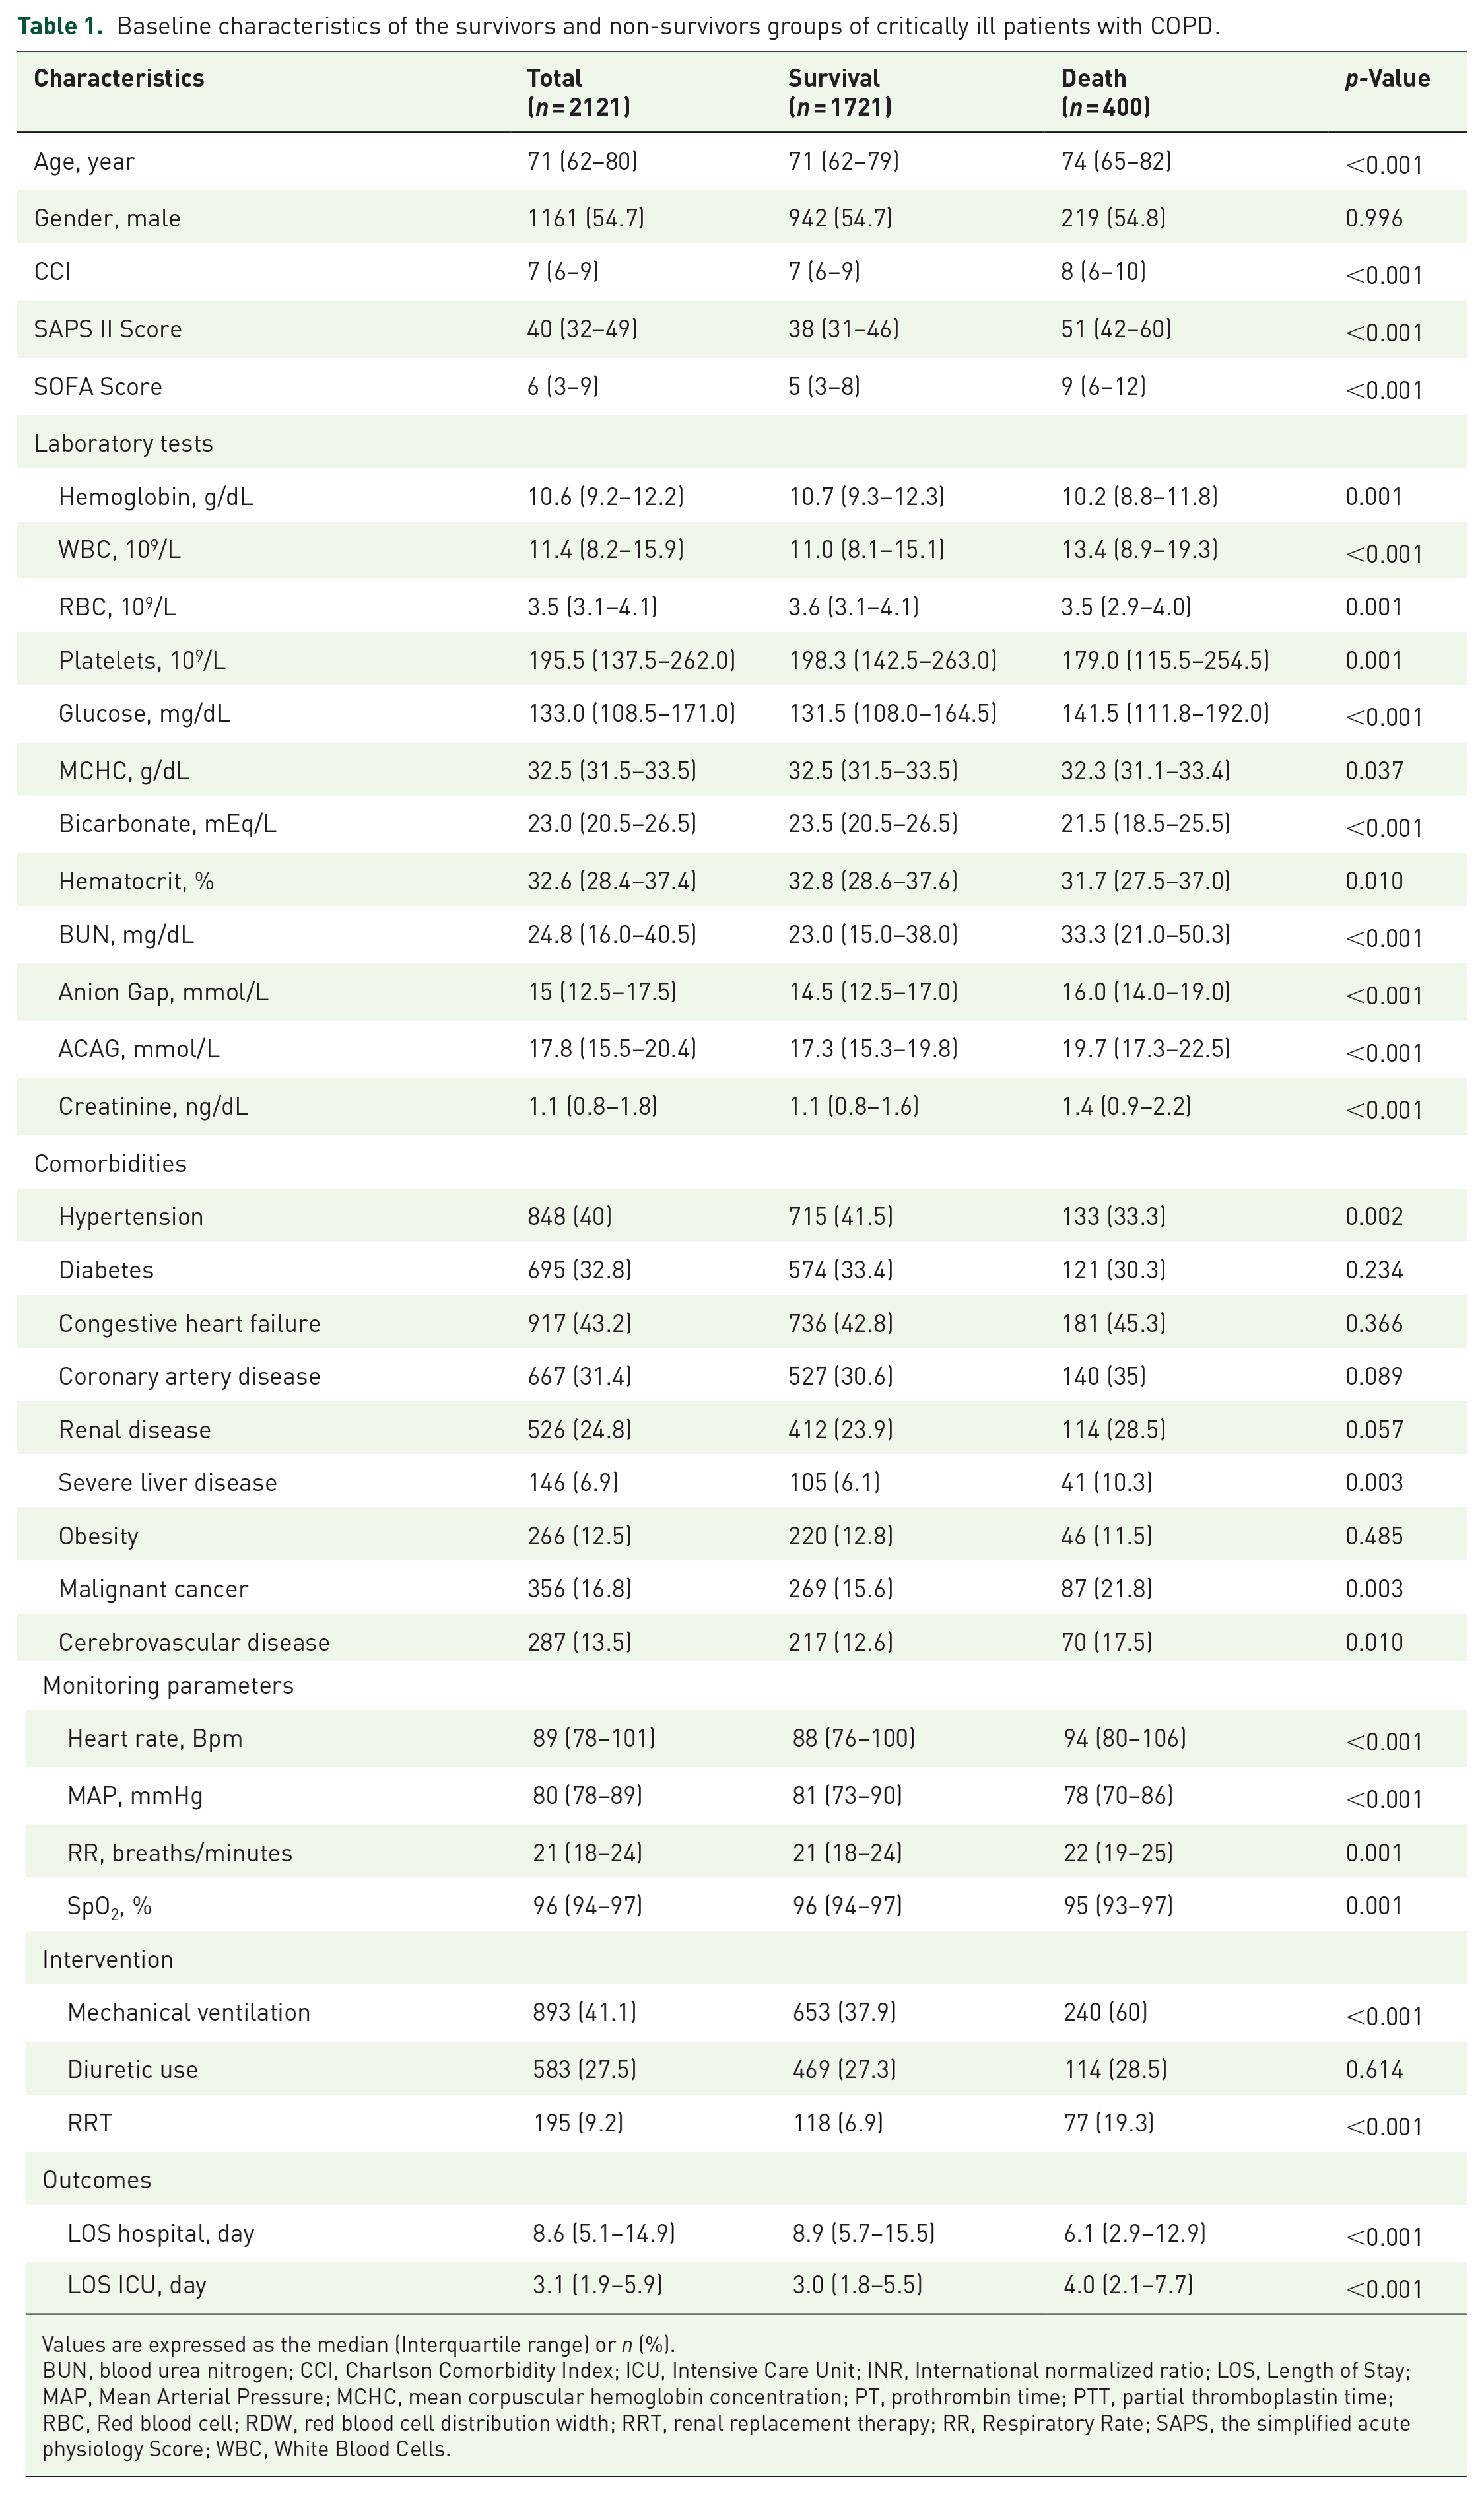
Values are expressed as the median (Interquartile range) or n (%).
BUN, blood urea nitrogen; CCI, Charlson Comorbidity Index; ICU, Intensive Care Unit; INR, International normalized ratio; LOS, Length of Stay; MAP, Mean Arterial Pressure; MCHC, mean corpuscular hemoglobin concentration; PT, prothrombin time; PTT, partial thromboplastin time; RBC, Red blood cell; RDW, red blood cell distribution width; RRT, renal replacement therapy; RR, Respiratory Rate; SAPS, the simplified acute physiology Score; WBC, White Blood Cells.
The predictive significance of ACAG for in-hospital mortality
A receiver operating characteristic (ROC) curve analysis was conducted to assess the predictive value of ACAG for in-hospital mortality in critically ill patients with COPD. The area under the curve (AUC) was 0.679 (95% CI: 0.658–0.699, p < 0.001), suggesting that ACAG may be a potentially useful biomarker for predicting in-hospital mortality in this patient population (Figure 2). An ACAG value of 18 mmol/L was determined to be the optimal cut-off point for predicting survival, with a sensitivity of 67.50% and a specificity of 59.09%. Patients were then categorized into two groups based on their ACAG levels: a low ACAG group (⩽18 mmol/L, n = 1147) and a high ACAG group (>18 mmol/L, n = 974). The comparison of baseline characteristics between the low ACAG group and the high ACAG group is shown in Table 2. Patients with higher ACAG levels were more likely to have comorbid conditions, including diabetes, renal disease, and severe liver disease (all p < 0.05). They also had higher disease severity scores, such as SAPS II and SOFA scores, and a greater likelihood of requiring mechanical ventilation and continuous renal replacement therapy (all p < 0.05). Moreover, patients in the higher ACAG group had elevated levels of WBC, glucose, BUN, anion gap, ACAG, and bicarbonate, while exhibiting lower levels of hemoglobin, RBC, and hematocrit (all p < 0.05). Patients with high ACAG levels have a significantly higher in-hospital mortality rate compared to those with low ACAG levels, with a mortality rate of 27.7% versus 11.3%, respectively (p < 0.05; Table 2). Patients in the high ACAG group had a significantly longer length of hospital stay (median of 9.5 days vs 7.9 days, p = 0.001) and a longer length of ICU stay (median of 3.3 days vs 1.8 days, p < 0.001) compared to those in the low ACAG group.
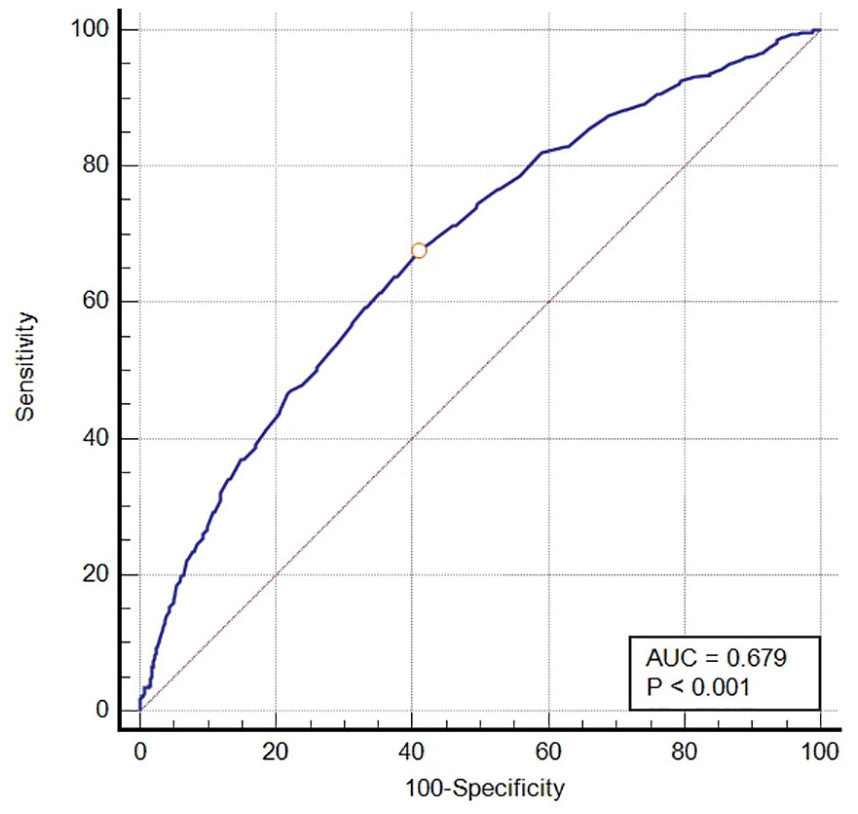
The receiver operating characteristic (ROC) curve illustrating the predictive performance of the ACAG for in-hospital mortality.
Baseline characteristics of patients with COPD according to ACAG level.

Values are expressed as the median (Interquartile range) or n (%).
BUN, Blood Urea Nitrogen; CCI, Charlson Comorbidity Index; ICU, Intensive Care Unit; INR, International normalized ratio; LOS, Length of Stay; MAP, Mean Arterial Pressure; MCHC, Mean corpuscular hemoglobin concentration; PT, prothrombin time; PTT, partial thromboplastin time; RBC, Red blood cell; RDW, Red blood cell distribution width; RR, Respiratory Rate; RRT, Renal replacement therapy; SAPS, The Simplified Acute Physiology Score; WBC, White Blood Cells.
Relationship between ACAG and in-hospital mortality in critically ill patients with COPD
Univariable logistic regression analysis identified several significant predictors of in-hospital mortality among patients with COPD. Except for gender, diabetes, congestive heart failure, coronary heart disease, renal disease, obesity, and diuretic use, most variables were associated with increased mortality risk. Detailed findings from the univariate logistic regression analysis are presented in Table 3. Multivariate logistic regression revealed that across all three models (Model I: OR = 1.153, 95% CI: 1.123–1.184, p < 0.001; Model II: OR = 1.157, 95% CI: 1.127–1.188, p < 0.001; Model III: OR = 1.099, 95% CI: 1.061–1.139, p < 0.001), ACAG as a continuous variable showed a positive association with in-hospital mortality, highlighting that elevated ACAG levels are strongly associated with a higher risk of in-hospital mortality among COPD patients (Table 4). Furthermore, we investigated the association between ACAG being treated as a categorical variable and in-hospital mortality. When ACAG was categorized into high and low groups, the high ACAG group had significantly higher odds of in-hospital mortality across all models (Model I: 3.000, 95% CI: 2.383–3.777, p < 0.001; Model II: 3.021, 95% CI: 2.397–3.808, p < 0.001; Model III: 1.916, 95% CI: 1.458–2.519, p < 0.001; Table 4).
Univariate logistic regression analyses for in-hospital mortality in patients with COPD.
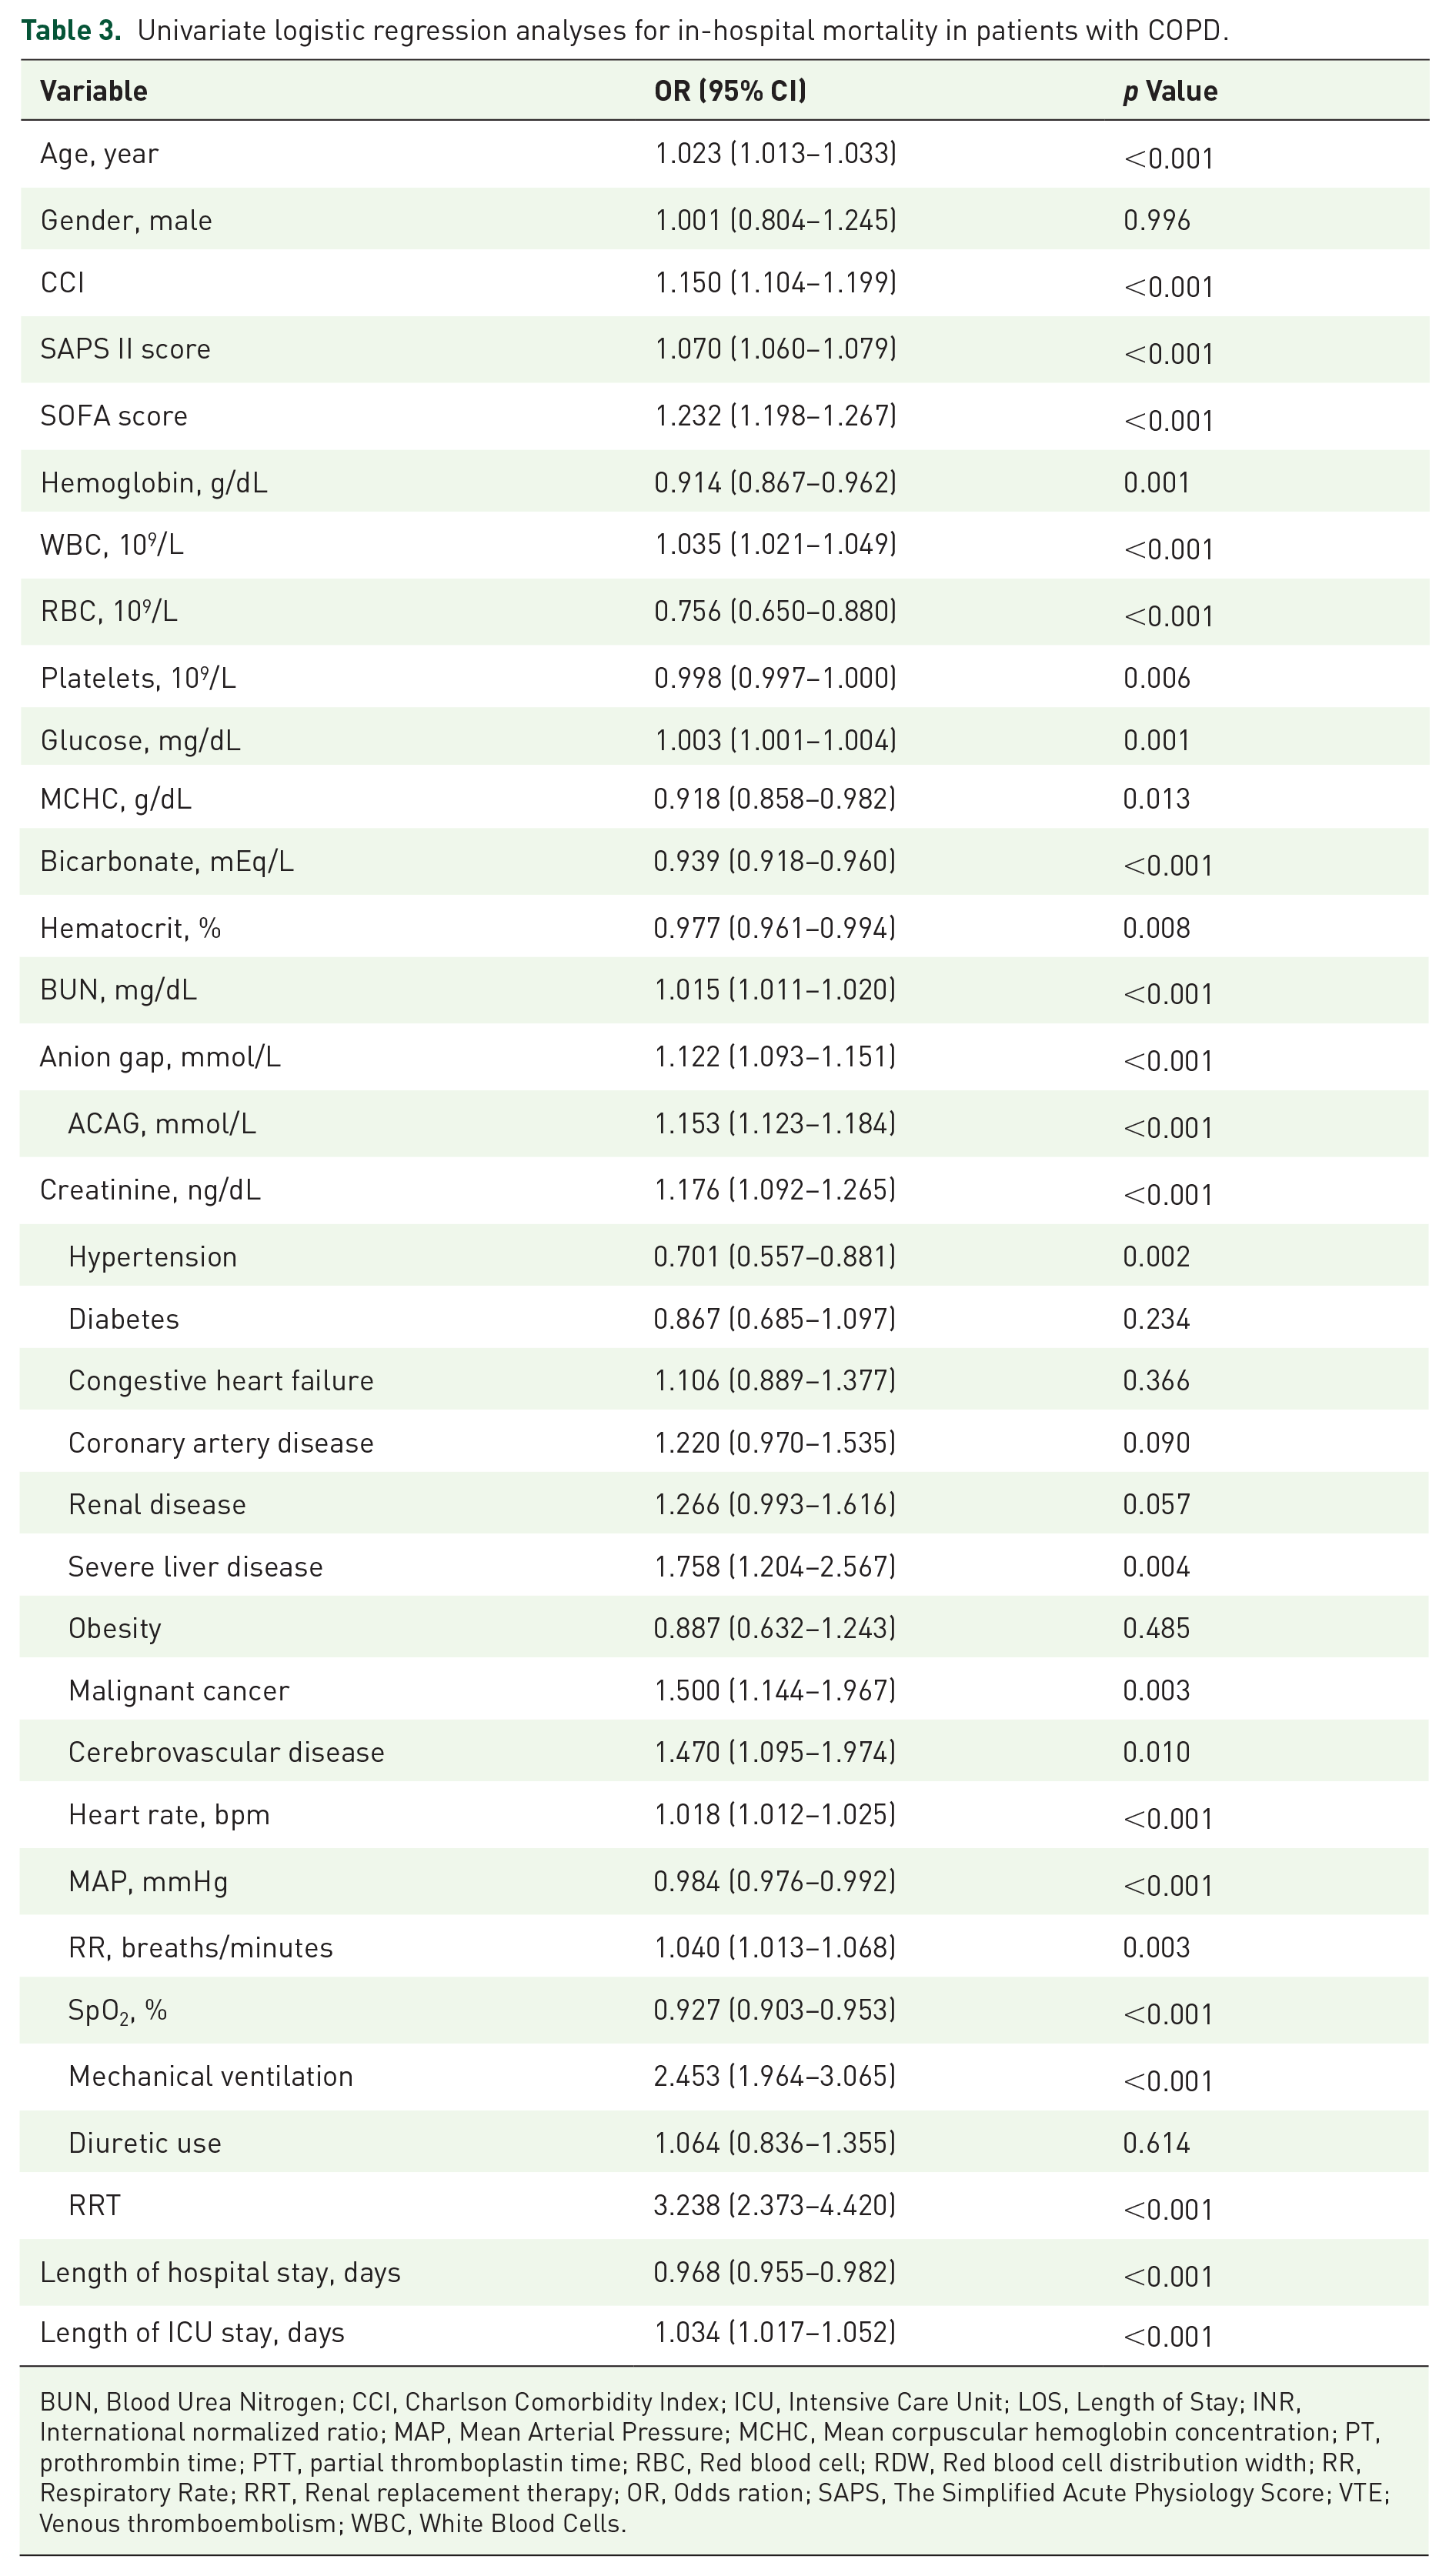
BUN, Blood Urea Nitrogen; CCI, Charlson Comorbidity Index; ICU, Intensive Care Unit; LOS, Length of Stay; INR, International normalized ratio; MAP, Mean Arterial Pressure; MCHC, Mean corpuscular hemoglobin concentration; PT, prothrombin time; PTT, partial thromboplastin time; RBC, Red blood cell; RDW, Red blood cell distribution width; RR, Respiratory Rate; RRT, Renal replacement therapy; OR, Odds ration; SAPS, The Simplified Acute Physiology Score; VTE; Venous thromboembolism; WBC, White Blood Cells.
Multivariable logistic regression analyses for in-hospital mortality in patients with COPD.
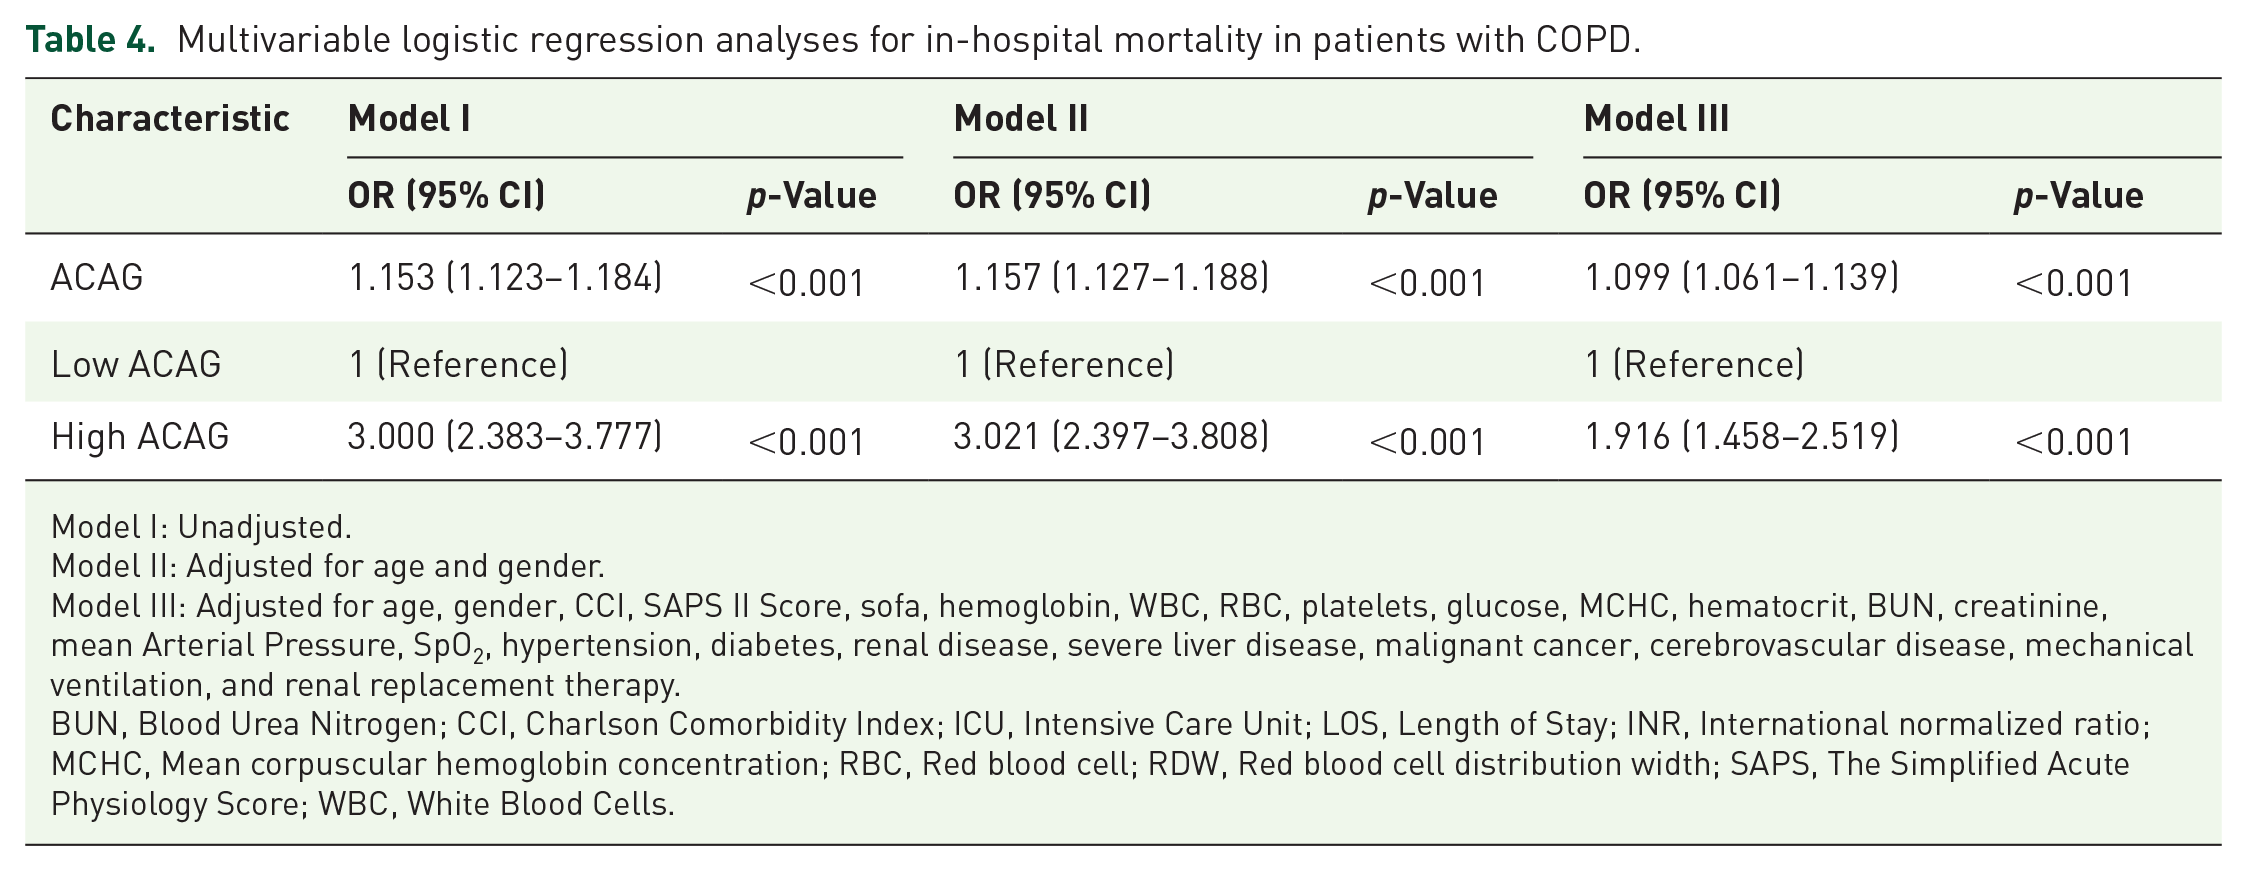
Model I: Unadjusted.
Model II: Adjusted for age and gender.
Model III: Adjusted for age, gender, CCI, SAPS II Score, sofa, hemoglobin, WBC, RBC, platelets, glucose, MCHC, hematocrit, BUN, creatinine, mean Arterial Pressure, SpO2, hypertension, diabetes, renal disease, severe liver disease, malignant cancer, cerebrovascular disease, mechanical ventilation, and renal replacement therapy.
BUN, Blood Urea Nitrogen; CCI, Charlson Comorbidity Index; ICU, Intensive Care Unit; LOS, Length of Stay; INR, International normalized ratio; MCHC, Mean corpuscular hemoglobin concentration; RBC, Red blood cell; RDW, Red blood cell distribution width; SAPS, The Simplified Acute Physiology Score; WBC, White Blood Cells.
Kaplan–Meier survival analysis curve
Kaplan–Meier survival analysis with log-rank testing demonstrated a significantly higher in-hospital mortality rate among patients with elevated ACAG levels compared to those with lower levels (log-rank test, p < 0.0001) (Figure 3). Notably, patients in the lower ACAG group had a mean survival time of 53.454 days (95% CI: 48.362–58.546), whereas those in the higher ACAG group had a mean survival time of 42.303 days (95% CI: 37.615–46.990). The hazard ratio for in-hospital mortality in critically ill COPD patients was 2.1277 (95% CI: 1.7490–2.5884) for those in the high ACAG group compared to the low ACAG group. Of the 2121 patients in our study, 414 were diagnosed with acute exacerbations of COPD (AECOPD). Kaplan-Meier survival analysis revealed a significantly increased risk of in-hospital mortality among AECOPD patients with elevated ACAG levels compared to those with lower levels (hazard ratio: 1.8248, 95% CI: 1.1254–2.9588, p = 0.0147; Figure 4). This finding underscores the prognostic significance of ACAG in short-term mortality for AECOPD patients.

Kaplan–Meier survival analysis curves for in-hospital mortality according to high and low ACAG groups in critically ill patients with COPD.

Kaplan–Meier survival analysis curves for in-hospital mortality according to high and low ACAG groups in critically ill patients with AECOPD.
Subgroup analysis
Subgroup analyses were conducted in the critically ill COPD patients cohort to assess the relationship between ACAG and in-hospital mortality. These analyses, stratified by factors such as gender, age, hypertension, diabetes, congestive heart failure, renal disease, severe liver disease, malignant cancer, cerebrovascular disease, and mechanical ventilation, revealed a statistically significant correlation between elevated ACAG levels and an increased risk of in-hospital mortality across all subgroups (Table 5). In all subgroup analyses, no interactions between ACAG and the stratifying variables were observed (all p for interaction > 0.05).
Subgroup analysis of the association between ACAG and in-hospital mortality in COPD patients.

Discussion
To the best of our knowledge, this study is the first to demonstrate that elevated ACAG levels are associated with an increased risk of in-hospital mortality in critically ill COPD patients. The findings indicate that ACAG levels were significantly higher in the patients who died than those who survived. Multivariate analysis revealed a strong and independent positive association between ACAG and in-hospital mortality among critically ill COPD patients, even after adjusting for potential confounders across all models. Kaplan–Meier survival analysis demonstrated that patients with elevated ACAG (>18 mmol/L) levels experienced significantly higher in-hospital mortality rates than those with lower ACAG levels. Of note, patients in the high ACAG group had a mean survival time of 42.303 days, compared to 53.454 days for those with low ACAG. The hazard ratio (HR) of 2.1277 indicates that patients with high ACAG levels have more than twice the risk of in-hospital mortality compared to those with low ACAG levels. Furthermore, subgroup analyses consistently demonstrated a robust and independent association between elevated ACAG levels and increased in-hospital mortality risk in critically ill COPD patients.
In recent years, ACAG has been extensively studied in critical care settings as a valuable predictive tool for mortality.5,8 –11 It provides a more accurate reflection of the underlying acid-base disturbance due to the frequent occurrence of hypoalbuminemia in this patient population. A retrospective cohort study by Li et al. 9 reported that higher baseline serum ACAG was independently associated with higher in-hospital mortality in ICU patients with acute pancreatitis. Wang et al. 10 found that ACAG had a better predictive value for 30-day mortality in ICU patients with asthma than the anion gap, with an optimal cut-off value of 20.38 mmol/L for predicting mortality. Yin et al. 16 investigated the relationship between ACAG measured within the first 24 h of ICU admission and in-hospital mortality in trauma patients. They discovered that elevated ACAG (>20.375 mmol/L) was independently linked to higher in-hospital mortality. Furthermore, ACAG was more effective than albumin and AG in predicting in-hospital mortality among trauma patients. Chen et al. 17 investigated the association between AG and mortality in critically ill COPD patients, identifying a positive correlation between elevated AG levels and increased mortality risk. Nevertheless, their study did not account for hypoalbuminemia in the ICU by calculating the ACAG, which limits the robustness of their findings and raises concerns about the potential for false-negative results. Consistent with previous studies, our findings demonstrate that higher ACAG levels (>18 mmol/L) were associated with increased in-hospital mortality among COPD patients. These results suggest that ACAG is an independent prognostic indicator of adverse outcomes, emphasizing the potential for early intervention strategies.
While elevated ACAG has been linked to increased mortality in COPD patients, the precise mechanisms by which ACAG level is elevated in this population remain to be fully elucidated. In COPD patients, diminished oxidative capacity can result in early onset lactic acidosis. 18 Lactic acid buildup leads to metabolic acidosis, typically associated with an elevated AG. 19 MacDonald et al. 20 recently conducted a study examining the link between blood lactate levels and clinical outcomes in patients undergoing acute exacerbations of COPD. Their findings revealed that elevated lactate levels are frequently observed in patients with AECOPD and are linked to more severe symptoms and increased β2-agonist usage. Elevated lactate levels are associated with an increased anion gap, thereby raising the ACAG.5,21 Furthermore, AECOPD in critically ill patients can significantly impair gas exchange, causing hypoxemia and abnormal respiratory muscle function. 22 This strain may induce a shift to anaerobic metabolism, leading to the buildup of lactic acid and metabolic acidosis. As a result, patients with AECOPD frequently show elevated AG levels, leading to increased ACAG levels. Moreover, severe exacerbations of COPD can induce increased airway and systemic inflammation, which can exacerbate metabolic acidosis by increasing the load of unmeasured anions, leading to a significant rise in the AG. 23 Diabetes and COPD are common comorbid disorders, and patients with COPD, particularly those with concurrent diabetes, are at increased risk for developing diabetic ketoacidosis.24,25 This condition arises from an accumulation of ketone bodies, such as acetoacetate and beta-hydroxybutyrate, in the circulation, leading to an increased anion gap. In addition, cachexia, a complex metabolic state characterized by severe weight loss, muscle atrophy, and lipid depletion, often accompanies advanced COPD. 26 The catabolic breakdown of muscle tissue during cachexia releases amino acids and other metabolic byproducts that can contribute to acidosis and elevate the anion gap.
Prior studies have demonstrated that elevated ACAG results in increased mortality. Hu et al. 8 identified ACAG as an independent predictor of all-cause mortality in cardiac arrest patients. At the same time, Wang et al. 10 and Yin et al. 16 reported ACAG cut-off values of 20.38 mmol/L and 20.375 mmol/L, respectively, for predicting mortality in asthma and trauma patients. In contrast, our study found a lower ACAG cut-off of 18 mmol/L for predicting in-hospital mortality in COPD patients. These variations suggest that the predictive value of ACAG differs across patient populations, likely due to disease-specific factors like chronic respiratory acidosis in COPD. This highlights the need for disease-specific ACAG thresholds to optimize risk stratification in diverse clinical settings. Based on these findings, ACAG could be a valuable tool for risk stratification and management in the ICU setting, as it is readily and easily accessible. Its ability to predict mortality in critically ill COPD patients suggests it could assist clinicians in clinical risk stratification and guide therapeutic interventions. Nonetheless, ACAG should be used in conjunction with other clinical and laboratory assessments to achieve a more thorough evaluation of critically ill COPD patients, aiding in effective risk stratification and disease management in clinical practice. Future research should focus on validating these findings in larger, multicenter cohorts and exploring whether interventions aimed at correcting metabolic acidosis in patients with elevated ACAG levels could improve clinical outcomes.
A key strength of this study was the use of a comprehensive real-world dataset, which demonstrated that elevated ACAG is an independent predictor of in-hospital mortality among critically ill COPD patients. Nevertheless, the present study also had several limitations. First, due to our study’s retrospective and observational nature, we could not establish a causal link. Second, this study relied on baseline serum ACAG levels from the MIMIC-IV database, as dynamic changes in the ACAG level were not available. Third, due to the constraints of the MIMIC-IV database, some potential confounders, such as dietary patterns and physical activity, were not included in the analysis. Fourth, to identify the optimal cutoff value for BCR to divide patients into high and low BCR groups, we utilized ROC curve analysis. Nonetheless, the area under the curve for BCR was lower than expected. Fifth, this study lacks a formal power calculation for sample size estimation. Since the study utilized the MIMIC database, the sample size was determined by the available data that met the inclusion criteria. Finally, as our study was a single-center retrospective analysis, future multicenter prospective studies are warranted to validate our findings.
Conclusion
The elevated ACAG level is significantly associated with increased in-hospital mortality in critically ill patients with COPD. ACAG could be helpful for risk assessment and clinical management in the ICU setting. Further research with larger sample sizes and a more robust study design is necessary to confirm these results and explore the underlying mechanism between ACAG and mortality in COPD patients.
Supplemental Material
sj-docx-1-tar-10.1177_17534666251315352 – Supplemental material for Association between albumin corrected anion gap and in-hospital mortality in critically ill patients with chronic obstructive pulmonary disease
Supplemental material, sj-docx-1-tar-10.1177_17534666251315352 for Association between albumin corrected anion gap and in-hospital mortality in critically ill patients with chronic obstructive pulmonary disease by Mohan Giri, Anju Puri, Lan Huang and Shuliang Guo in Therapeutic Advances in Respiratory Disease
Footnotes
References
Supplementary Material
Please find the following supplemental material available below.
For Open Access articles published under a Creative Commons License, all supplemental material carries the same license as the article it is associated with.
For non-Open Access articles published, all supplemental material carries a non-exclusive license, and permission requests for re-use of supplemental material or any part of supplemental material shall be sent directly to the copyright owner as specified in the copyright notice associated with the article.