
Abstract
Background:
Early diagnosis of malignant pleural effusion (MPE) is of great significance. Current prediction models are not simple enough to be widely used in heavy clinical work.
Objectives:
We aimed to develop a simple and efficient clinical prediction scoring system to distinguish MPE from benign pleural effusion (BPE).
Design:
This retrospective study involved patients with MPE or BPE who were admitted in West China Hospital from December 2010 to September 2016.
Methods:
Patients were divided into training, testing, and validation set. Prediction model was developed from training set and modified to a scoring system. The diagnostic efficacy and clinical benefits of the scoring system were estimated in all three sets.
Results:
Finally, 598 cases of MPE and 1094 cases of BPE were included. Serum neuron-specific enolase, serum cytokeratin 19 fragment (CYFRA21-1), pleural carcinoembryonic antigen (CEA), and ratio of pleural CEA to serum CEA were selected to establish the prediction models in training set, which were modified to the scoring system with scores of 6, 8, 10, and 9 points, respectively. Patients with scores >12 points have high MPE risk while ⩽12 points have low MPE risk. The scoring system has a high predictive value and good clinical benefits to differentiate MPE from BPE or lung-specific MPE from BPE.
Conclusion:
This study developed a simple clinical prediction scoring system and was proven to have good clinical benefits, and it may help clinicians to separate MPE from BPE.
Introduction
Malignant pleural effusion (MPE) refers to the pleural effusion (PE) caused by malignant tumors originating in the pleura or the metastasis of tumors from other parts to the pleura. The etiology of MPE is mainly lung cancer, breast cancer, and lymphoma, or any malignant diseases.1,2 The median survival period of patients with MPE is 3–12 months, 3 and the in-hospital mortality rate is as high as 11.6%. 4 The misdiagnosis of MPE as benign pleural effusion (BPE) may significantly prolong the time for patients to receive treatment, and directly increase the mortality of patients. Therefore, early diagnosis of MPE is of great significance, which may improve the prognosis, reduce the mortality, and alleviate the social, medical, and economic burden.
At present, exfoliative cytology of PE is the first choice for clinical diagnosis of MPE with reported overall sensitivity of only 58%. 5 Other MPE diagnostic methods include traditional closed pleural biopsy and medical thoracoscopy.6–8 Positron emission tomography-computed tomography (PET-CT) and Positron emission tomography-magnetic resonance imaging (PET-MRI) models were also built to predict the diagnosis of MPE.9–11 The reported sensitivity of these methods can reach 50–98% but with the limitation of increased incidence of complications, high cost, and equipment unavailability.6–11 Therefore, finding more accurate, more practical, less traumatic, and simpler clinical diagnostic methods is urgent in MPE research. Such indicators of blood and PE as adenosine deaminase (ADA), lactate dehydrogenase (LDH), carcinoembryonic antigen (CEA), carbohydrate antigen-199 (CA-199), cytokeratin 19 fragment (CYFRA21-1), neuron-specific enolase (NSE), carbohydrate antigen 125 (CA-125), and so on., have been paid more and more attention. 12 However, due to their limited sensitivity and specificity, these indicators cannot be used alone to accurately identify MPE from BPE. So, scholars try to establish prediction models for MPE, which is used to study the relationship between outcome and characteristics of patients under specific conditions and usually combines multiple parameters to help doctors learn the relative impact of each characteristic on outcome in the model. The reported good sensitivity, specificity, and area under the curve (AUC) of these prediction models to distinguish MPE from BPE were about 85–89%, 82–92%, and 91–98%, respectively, which showed greatly improved diagnostic efficiency of MPE.12–15 However, these clinical prediction models contain at least six markers and they are not simple enough to be widely used in heavy clinical work.
Therefore, we aimed to developed a simple and efficient clinical prediction scoring system through clinical data mining to distinguish MPE from BPE.
Methods
Study populations and design
The data of patients who were diagnosed as PE in West China Hospital from December 2010 to September 2016 and met the inclusion but not the exclusion criteria were collected retrospectively (the first part), and that from October 2018 to April 2021 were collected prospectively (the second part). The inclusion criteria were as follows: MPE or BPE was definitely diagnosed and the diagnosis of MPE must have the pathological evidences of PE or tissue blocks (pleural biopsy). The exclusion criteria were as follows: (1) one was younger than 18 years old; (2) missing data exceeded 20%. The included patients have undergone rigorous screening to avoid potential bias.
Patients of the first part were randomly divided into training set and testing set at a ratio of 7:3. Patients of the second part entered the validation set.
This study was approved by the Institutional Ethics Committee of West China Hospital (WCH 2020-147) and was conducted in accordance with the Helsinki Declaration. The written informed consents of patients in the first part were waived because of its retrospective nature. And the written informed consents of patients in the second part were signed.
The reporting of this study conforms to the Strengthening the Reporting of Observational Studies in Epidemiology (STROBE) statement. 16 The STROBE check-list was provided in Supplemental Material 1.
Data collection
The clinical data were extracted from the hospital information system (HIS) of West China Hospital, including the following: (1) demographic characteristics: age, sex, and smoking history; (2) disease characteristics: symptoms, signs, and etiology; (3) laboratory examination: white blood cell count, lymphocyte count, monocyte count, erythrocyte sedimentation rate (ESR), serum and pleural CA-125, CA-199, CEA, CYFRA21-1, NSE, ADA, and LDH concentration, pleural red blood cell count, pleural mesothelial cell count, and so on.; the ratio of indicators in PE and plasma was calculated; (4) radiological results: CT image description, such as nodules, masses, and so on. Variables with an overall missing value of more than 20% were excluded from the subsequent analysis and presentation.
Statistical analysis
The enumeration data of all sets were expressed in frequency and the difference between MPE and BPE group was estimated by independent sample t test and the measurement data were expressed in mean ± standard deviation and the difference was estimated by Chi-square test. In the training set, the machine learning method of best subset selection and 10-fold cross validation were used to fit all prediction variables, and the best model and corresponding prediction variables were selected according to Bayesian information criterion (BIC) and AUC values. The clinical prediction model was established using logistic regression, and the results were printed as nomograph which was further adjusted to a simple scoring system. The receiver operating characteristic (ROC) analysis, calibration curve, decision curve analysis (DCA), and clinical impact curve (CIC) were used to evaluate the prediction scoring system in the training set, as well as in testing set and validation set. All statistical analyses were performed using R software (R foundation; version: 4.2.0; https://www.r-project.org/).
Results
Clinical features of the included patients
In total, 1494 patients (500 MPE and 994 BPE patients) from December 2010 to September 2016 (the first part) and 198 patients (98 MPE and 100 BPE patients) from October 2018 to April 2021 (the first part) in West China Hospital were included in this study (the inclusion flowchart is shown in Supplemental Material 2). The first part was randomly divided into the training set (N = 1069) and test set (N = 425) at a ratio of 7:3, while the second part entered the validation set (N = 198). Baseline characteristics of age, sex, and etiology of PE for the three sets are shown in Table 1 and details of other variables are shown in Supplemental Material 3.
Baseline characteristics of training set, testing set, and validation set.

p < 0.05 is considered to have significant statistical difference.
BPE, benign pleural effusion; MPE, malignant pleural effusion.
Variables selection for MPE prediction model
A total of 31 variables in three sets were pre transferred as the binomial data according to optimal cutoff value of the ROC analysis, considering clinical convenience of the MPE prediction model. Then, 31 binomial variables were used to construct best subset selection model and conduct 10-fold cross validation for estimating all variables in training set. The variables with the smallest BIC value were shown in Supplemental Material 4. Variables with larger AUC and smaller BIC values are preferred to develop prediction models. Then, four variables, including serum NSE, serum CYFRA21-1, pleural CEA, and ratio of pleural CEA to serum CEA, with relatively large AUC and small BIC, were selected to establish the prediction models.
Construction of MPE prediction model and MPE scoring system in training set
Logistic regression model, including above four variables were constructed to identify the MPE from BPE in training set. The prediction model was visualized as nomograph that shows the relationship between four variables and MPE risk [Figure 1(a)]. The corresponding scores of four variables and related parameters were shown in Supplemental Material 5. We modified these scores as integers to form a simpler MPE scoring system [Figure 1(b)]. We further conducted ROC analysis for the scoring system, showing the optimal cutoff of 12 points, sensitivity of 85.9%, specificity of 89.2%, Youden index of 0.751, and AUC of 0.916 [Figure 1(c)]. Then we defined that patients with scores >12 points have high MPE risk while ⩽12 points have low MPE risk [Figure 1(d)].

Establishment of MPE scoring system in training set: (a) Nomograph shows the relationship between four variables and MPE risk; (b) simplified scoring system and corresponding scores of each variable; (c) ROC analysis curve shows AUC 0.916, sensitivity 0.859, and specificity 0.892 at the cutoff score of 12 points for the simplified scoring system; (d) bar chart shows total score >12 points have high risk of MPE, and ⩽12 points have low risk of MPE.
Evaluation of MPE scoring system in three sets
Firstly, ROC analyses were conducted to clarify the discriminative ability of the scoring system. Table 2 shows the related index results of discriminative ability of the scoring system [AUC, sensitivity, specificity, positive likelihood ratio (PLR), negative likelihood ratio (NLR), positive predictive value (PPV), and negative predictive value (NPV)]. Figure 2(a) shows AUC 0.916, 0.923, and 0.936, respectively, in training set, testing set, and validation set, which proved the good discriminative power. Second, calibration curves were plotted to explore the consistency of the scoring system between predicted and actual possibility. Figure 2(b) shows a little gap between predicted and actual probability in three sets, demonstrating good consistency. Then DCA curves were made to assess the clinical applicability of the scoring system. Figure 2(c) shows obvious net benefits of patients with clinical intervention of MPE scoring system when the threshold probability is 0.5 in three sets, turning to be very valuable in clinical application. In addition, CIC were plotted to further clarify the clinical benefit. Figure 2(d) shows very little gap between predicted and actual number of patients when predicted possibility exceeds 0.3. These two figures illustrated that the scoring system has certainly good clinical practicability.
Evaluation index of discriminative ability for the scoring system.

AUC, area under the curve; BPE, benign pleural effusion; MPE, malignant pleural effusion; NLR, negative likelihood ratio; NPV, negative predictive value; PPV, positive predictive value; PLR, positive likelihood ratio.
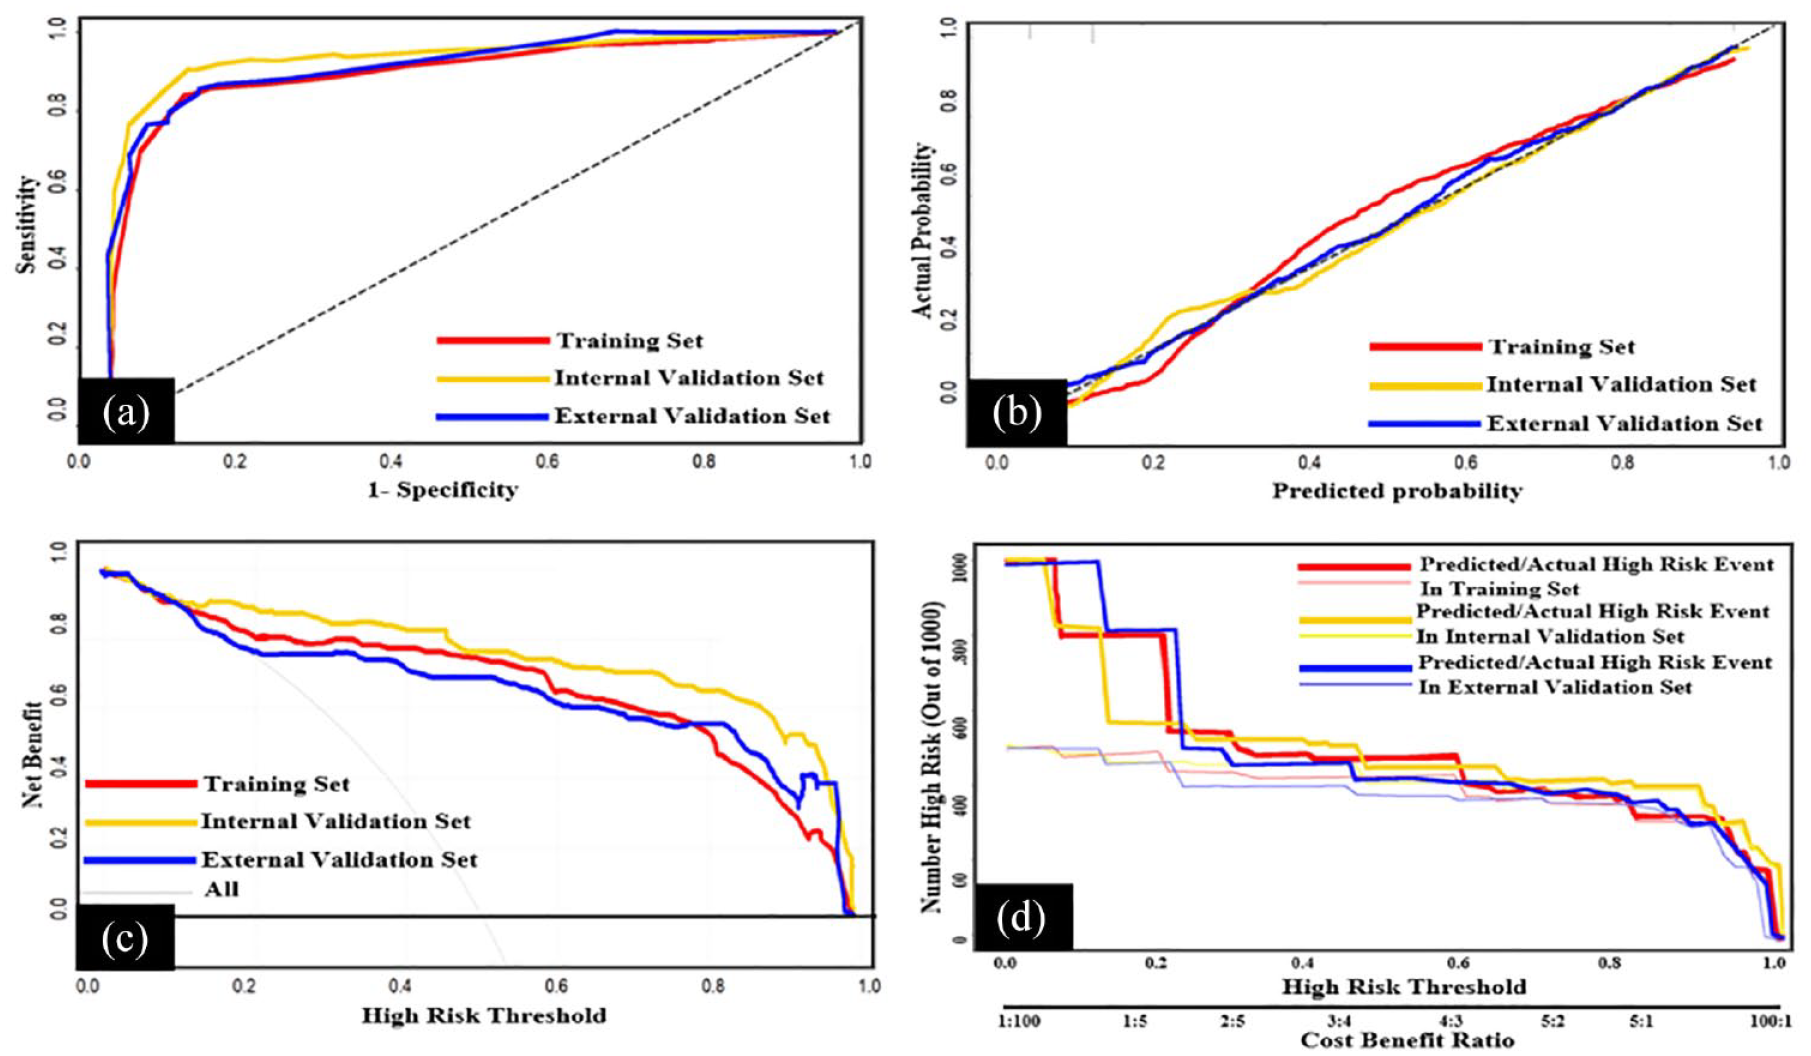
Evaluation of MPE scoring system in three sets: (a) ROC analyses show the AUC of training set, testing set, and validation set were 0.916, 0.923, and 0.936, respectively; (b) calibration curves show the gap between the predicted probability and the actual probability; (c) DCA curves show the benefits of patients with clinical intervention of MPE scoring system; (d) CIC curves show the gap between the predicted and actual number of patients under different probabilities with clinical intervention of MPE scoring system.
Application of MPE scoring system to identify lung cancer-specific MPE
Since lung cancer is the most common cause of MPE in this study (495/596, 83.1%), we applied above MPE scoring system to identify lung cancer-specific MPE from BPE. Assessments of the MPE scoring system applied in patients of lung cancer-specific MPE and BPE (lung/BPE) were done to reveal the efficacy and clinical benefits. Lung/BPE population was divided into training set, testing set, and validation set according to the same method as before. Figure 3(a) shows AUC 0.941, 0.973, and 0.930, respectively, in training set, testing set, and validation set, showing the excellent discriminative power. Figure 3(b) shows good consistency between predicted and actual probability. Figure 3(c) and (d) shows the scoring system is very profitable in clinical application.

Evaluation of MPE scoring system for identifying lung cancer-related MPE from BPE in three sets: (a) ROC analyses show the AUC of lung cancer-related MPE and BPE patients (lung/BPE) in training set, testing set, and validation set were 0.936, 0.962, and 0.930, respectively; (b) calibration curves show the gap between the predicted probability and the actual probability of lung/BPE patients; (c) DCA curves show the benefits of lung/BPE patients using the MPE scoring system; (d) CIC curves show the gap between the predicted and actual number of lung/BPE patients under different probabilities using the MPE scoring system.
Discussion
The occurrence of MPE represents the systematic spread of tumor cells, with short life span and poor prognosis. The pathology of exfoliative cytology of PE is the gold standard for MPE diagnosis, but its sensitivity is very low and cannot meet the clinical needs. 5 As previously mentioned, closed or imaging-guided pleural biopsy, medical thoracoscopy, and PET-CT/PET-MRI prediction models have the disadvantages of inevitable complications, high cost, equipment unavailability, and inconvenience.6–11 Therefore, scholars pay more attention to build prediction models that combine at least two blood or PE indicators with the advantages of less invasion, cheaper, easy acquirement, and simpler based on current reliable medical diagnosis resources.12–15,17–21
In this study, we selected the optimal variables (serum NSE, serum CYFRA21-1, pleural CEA, and ratio of pleural CEA to serum CEA) through machine learning methods. And we built a prediction model using the four variables and modified it as a scoring system for the convenience of clinical application. This scoring system is definitely very simple and efficient with high predictive value of good AUC 0.916–0.936, sensitivity 85.7–89.9%, specificity 88.0–89.2%, PLR 7.143–8.066, NLR 0.113–0.162, PPV 0.779–0.875, and NPV 0.863–0.953 at the optimal cutoff value of 12, and with favorable clinical benefits to identify MPE from BPE. We also tried to apply the scoring system to distinguish lung cancer-specific MPE from BPE and found particularly high predictive value of considerable good AUC 0.930–0.973, sensitivity 85.9–94.5%, specificity 88.9–97.0%, PLR 8.480–28.627, NLR 0.061–0.146, PPV 0.759–0.961, and NPV 0.890–0.978, and especially good clinical benefits. If this model suggests MPE, it is necessary to actively conduct further examination to find the tumor location, tumor type, molecular and genetic phenotype. In that way, these patients can be diagnosed and treated earlier. While for those patients classified as low risk, clinicians should prioritize collecting evidence of other benign diseases, such as tuberculosis, heart failure, kidney failure, and so on, or prescribe close follow-up. Thus, those patients avoid excessive screening and waste of medical resources for excluding malignant diseases.
Other representative combinations are necessary to be mentioned. Yang et al. reported that CYFRA21-1 combined with CA153 achieved the best diagnostic efficacy of MPE in different biomarker combination methods, with sensitivity 88%, specificity 94%, and AUC 0.98 in their meta-analysis. However, they pooled above result just from three to four studies, including 139 MPE and 159 BPE patients. 12 Zhou et al. 13 concluded that age/ADA showed the optimal sensitivity 81.5%, specificity 97.8%, and AUC 0.916 but with the limitation of small sample size of exclusive target population in 130 tuberculous and 90 malignant PE patients. Wang et al. 14 included 1261 patients in their study and established MPE prediction models based on fever, ESR, ADA, serum CEA, pleural CEA, and pleural/serum CEA, with sensitivity of 89%, specificity of 82%, and AUC of 91%. Wu et al. 15 included 1239 patients in their study and established a MPE prediction model based on pleural CEA, pleural ADA, ESR, pleural CEA/serum CEA, pleural CA199, pleural CYFRA21-1, and serum LDH/pleural ADA. The sensitivity is 87%, specificity is 92%, and AUC is 95%. These reliable prediction models with good diagnostic performance include at least six biochemical indicators, which are not simple enough to be used in heavy clinical work. Comparing to above models mentioned, this scoring system has the advantages of large sample data, very few indicators, multiple validation, good diagnostic efficacy, and favorable clinical benefits to make it highly possible to be popularized in clinical practice to identify MPE patients, especially lung cancer-specific MPE patients, from BPE ones.
Herein, we recommend the scoring system to be applied to patients with PE whose exfoliative cell pathology is negative but suspected malignancy or primary tumor site is unknown or who cannot get the method of PET-CT, thoracoscopy, or who is so fragile to tolerate invasive procedures, extensively. If these patients have PEs, they can use this model to initially identify the malignant nature of the PE, and through further examination to clarify the specific tumor. Thus, the scoring system may be with beneficial for early diagnosis and improvement of prognosis of these patients.
The study has several limitations. First, the clinical data collected were retrospective that may cause bias. Second, the chest X-ray method is very simple but not included in the variable category of this study, because most of patients are complex and difficult cases in our hospital, which uses more advanced imaging examinations such as CT and PET-CT. In the future, scholars can try to include chest X-ray results in grassroot hospitals to predict the diagnosis of MPE. Third, the scoring system was built on the basis of data just from single center, and its diagnostic efficacy needs to be verified in more hospitals and larger size population. Finally, tumor markers in PE are not routinely obtained, so the application of this scoring system is limited in some hospitals.
Conclusion
In conclusion, we developed a simple scoring system based on variables of serum NSE, serum CYFRA21-1, pleural CEA, and ratio of pleural CEA to serum CEA, which is estimated with good diagnostic value and clinical benefits. And the scoring system can help clinicians to separate MPE from BPE.
Supplemental Material
sj-doc-1-tar-10.1177_17534666231223002 – Supplemental material for A simple and efficient clinical prediction scoring system to identify malignant pleural effusion
Supplemental material, sj-doc-1-tar-10.1177_17534666231223002 for A simple and efficient clinical prediction scoring system to identify malignant pleural effusion by Shuyan Wang, Jing An, Xueru Hu, Tingting Zeng, Ping Li, Jiangyue Qin, Yongchun Shen, Tao Wang and Fuqiang Wen in Therapeutic Advances in Respiratory Disease
Supplemental Material
sj-docx-3-tar-10.1177_17534666231223002 – Supplemental material for A simple and efficient clinical prediction scoring system to identify malignant pleural effusion
Supplemental material, sj-docx-3-tar-10.1177_17534666231223002 for A simple and efficient clinical prediction scoring system to identify malignant pleural effusion by Shuyan Wang, Jing An, Xueru Hu, Tingting Zeng, Ping Li, Jiangyue Qin, Yongchun Shen, Tao Wang and Fuqiang Wen in Therapeutic Advances in Respiratory Disease
Supplemental Material
sj-docx-4-tar-10.1177_17534666231223002 – Supplemental material for A simple and efficient clinical prediction scoring system to identify malignant pleural effusion
Supplemental material, sj-docx-4-tar-10.1177_17534666231223002 for A simple and efficient clinical prediction scoring system to identify malignant pleural effusion by Shuyan Wang, Jing An, Xueru Hu, Tingting Zeng, Ping Li, Jiangyue Qin, Yongchun Shen, Tao Wang and Fuqiang Wen in Therapeutic Advances in Respiratory Disease
Supplemental Material
sj-png-2-tar-10.1177_17534666231223002 – Supplemental material for A simple and efficient clinical prediction scoring system to identify malignant pleural effusion
Supplemental material, sj-png-2-tar-10.1177_17534666231223002 for A simple and efficient clinical prediction scoring system to identify malignant pleural effusion by Shuyan Wang, Jing An, Xueru Hu, Tingting Zeng, Ping Li, Jiangyue Qin, Yongchun Shen, Tao Wang and Fuqiang Wen in Therapeutic Advances in Respiratory Disease
Supplemental Material
sj-png-5-tar-10.1177_17534666231223002 – Supplemental material for A simple and efficient clinical prediction scoring system to identify malignant pleural effusion
Supplemental material, sj-png-5-tar-10.1177_17534666231223002 for A simple and efficient clinical prediction scoring system to identify malignant pleural effusion by Shuyan Wang, Jing An, Xueru Hu, Tingting Zeng, Ping Li, Jiangyue Qin, Yongchun Shen, Tao Wang and Fuqiang Wen in Therapeutic Advances in Respiratory Disease
Footnotes
References
Supplementary Material
Please find the following supplemental material available below.
For Open Access articles published under a Creative Commons License, all supplemental material carries the same license as the article it is associated with.
For non-Open Access articles published, all supplemental material carries a non-exclusive license, and permission requests for re-use of supplemental material or any part of supplemental material shall be sent directly to the copyright owner as specified in the copyright notice associated with the article.