
Abstract
Background:
Functional respiratory imaging (FRI) uses three-dimensional models of human lungs and computational fluid dynamics to simulate functional changes within airways and predict the deposition of inhaled drugs. This study used FRI to model the effects of different patient inhalation and drug formulation factors on lung deposition of an inhaled corticosteroid/long-acting β2-agonist (ICS/LABA) combination, administered by a pressurized metered-dose inhaler.
Methods:
Three-dimensional models of the lungs of six patients with asthma (mean forced expiratory volume in 1 s, 83%), treated with an ICS/LABA, were included. FRI modelling was used to simulate (1) the effects on lung deposition of inhalation duration and particle size [fine particle fraction (FPF), proportion of particles <5 µm; and mass median aerodynamic diameter (MMAD), average size of inhalable particles]; (2) deposition of fluticasone propionate/formoterol (FP/FORM) 125/5 µg; and (3) how inhalation profiles and flow rates affected FP/FORM deposition.
Results:
Total lung depositions (TLDs) following 1-, 3- and 5-s inhalations were 22.8%, 36.1% and 41.6% (metered dose), respectively, and central-to-peripheral deposition (C:P) ratios were 1.81, 0.86 and 0.61, respectively. TLD increased with increasing FPF, from ~8% at 10% FPF to ~36% at 40% FPF (metered dose); by contrast, MMAD had little effect on TLD, which was similar across MMADs (1.5–4.5 µm) at each FPF. FP/FORM deposited throughout central and peripheral airways with gradual (sinusoidal) and sharp (rapid) inhalations. TLD ranged from 35.8 to 44.0% (metered dose) for gradual and sharp inhalations at 30 and 60 L/min mean flow rates.
Conclusions:
These data provide important insights into the potential effects of inhalation characteristics (inhalation profile and duration) and aerosol formulation (FPF) on lung deposition of inhaled therapies. FRI thus represents a useful alternative to scintigraphy techniques. Future FRI studies will further our understanding of the deposition of inhaled drugs and help improve the management of asthma.
Keywords
Introduction
In vivo scintigraphy remains the gold standard technique for assessing lung deposition of inhaled drugs.1,2 However, its use is limited by the complex methodologies required to radiolabel products and the fact that patients are exposed to radiation during the procedure. A number of alternatives to scintigraphy are available that use mathematical modelling to predict how a drug will be delivered to and deposited in the airways. These range from very basic empirical models that reduce the anatomy of the repository tract to just a few sections, through to highly detailed models that use computational fluid dynamics (CFD) to simulate particle motion and deposition in airways modelled on real human lungs.3,4 Although these models overcome the main issues associated with scintigraphy, they cannot simulate certain key parameters, such as the exact physiology of the human respiratory system and the complexities of aerosol physics. Nevertheless, they remain an important and validated tool for researchers, providing a time- and cost-effective means of predicting lung deposition under a range of physiological conditions that may not always be feasible to measure in vivo with scintigraphy.
One such technique is functional respiratory imaging (FRI), an advanced technology that combines three-dimensional (3D) modelling of human lungs [taken from computerized tomography (CT) scans] with CFD, a branch of fluid mechanics that uses numerical analyses and algorithms to simulate the motion of fluids and their interactions with surfaces. CFD is used in many areas of research and design, such as in the aviation, space and automotive industries, and is increasingly being used in medical science (e.g. in the study of blood flow in cardiovascular diseases). 5 In respiratory medicine, FRI simulations, by combining CFD and 3D modelling from CT scans of patients’ lungs, can predict how changes in patient-specific anatomy (e.g. variations in disease progression or treatment) can impact on functional outcomes in the lungs, such as the deposition of inhaled drugs, or airway resistance.6–10
FRI allows precise manipulation of experimental conditions, including patient factors, and device and formulation characteristics, and therefore allows investigations that would be difficult or impossible with in vivo techniques. Furthermore, multiple assessments with different drug formulations can be made in the same patient’s lungs, thereby controlling for anatomical differences, which would not be possible with in vivo scintigraphy owing to the need to limit exposure to radio-actively labelled compounds. Patients would be exposed to multiple doses of radiation with in vivo lung scintigraphy (at least 2 mSv per exposure), whereas a CT scan for FRI purposes results in a radiation dose of 1–3 mSv (lower than a regular chest CT scan of ~7 mSv). 11
Correct inhaler technique is important to achieve good asthma control. 12 A study in patients with asthma who were treated with inhaled corticosteroids (ICSs) administered via a pressurized metered-dose inhaler (pMDI) showed that individuals with an inadequate inhaler technique had less stable disease than those with a good technique. 13 Patients are advised to inhale slowly and deeply when using a pMDI. The European Respiratory Society/International Society for Aerosols in Medicine (ERS/ISAM) guidelines recommend that patients should inhale for 4–5 s, 14 which should reduce the inhalation flow rate and allow more time to coordinate device actuation and inhalation. Many patients, however, inhale too quickly when using a pMDI. 15 FRI allows the extent to which differences in inhalation duration and profile (e.g. different flow rates) affect lung deposition to be evaluated in detail.
Formulation characteristics also affect lung deposition. Studies have suggested that a given dose of beclomethasone dipropionate (BDP) delivered via a hydrofluoroalkane (HFA)-based pMDI provides the same degree of asthma control as 2.5 times the BDP dose from a chlorofluorocarbon (CFC)-based inhaler.16,17 This is typically attributed to the extrafine particle size formulation of HFA-based BDP 18 compared with the larger particles of the CFC-based formulation, with a mass median aerodynamic diameter (MMAD) of ~1.3 µm or 4.3 µm, respectively. The two formulations also differ in their fine particle fraction (FPF; HFA-based BDP, 36%; CFC-based BDP, 18%), which could contribute to the observed differences. 18 The FPF is the proportion of the total dose comprising particles with a diameter smaller than 5.0 μm, including those that deposit in the ‘throat’ of the apparatus; the calculation of MMAD excludes these particles, which usually constitute the majority of the total dose. FRI allows the effects of variations in both MMAD and FPF on lung deposition to be assessed independently.
We used FRI to investigate how variations in inhaler technique (such as inhalation duration and profile) and formulation characteristics [such as particle size (MMAD, FPF)] may influence the deposition of inhaled medications in the lungs. Here, we report findings from the
Methods
The methodology for FRI studies can be divided into four stages: (1) patient scanning and 3D airway modelling; (2) determining inhaler characteristics; (3) setting the inhalation profile; and (4) modelling of lung deposition using CFD simulations. All three of the sub-studies reported here involved the same patient group and employed similar CFD simulation strategies; inhaler characteristics and inhalation profiles differed between the sub-studies.
Patients and airway modelling
Volumetric, CT-based, 3D models of the lungs of patients with asthma were used in the studies. Patient CT scans were obtained retrospectively; no active patient recruitment was performed for this study. All patients gave their informed consent and ethical approval was obtained from the Ethics Committee of the University Hospital in Antwerp. The respiratory tract was reconstructed down to the level of the airways with a diameter of 1–2 mm, based on CT scans with a voxel size of around 0.5 mm 3 . The airways further downstream of this could not be detected, so if the particle exited the 3D model, it was considered to be deposited in the peripheral region. However, the compliance in this region was taken into account by calculating the internal airflow distribution based on the lobar volume change from expiration to inspiration. All participants had forced expiratory volume in 1 s (FEV1) of 60–100% of the predicted value and were receiving ICS/long-acting β2-agonist (LABA) therapy. Inspiratory and expiratory scans were performed for each participant to generate 3D models of the airways and lungs. Inspiratory scans were used to create patient-specific models of the upper and lower airways, up to the point where no distinction could be made between the intraluminal and alveolar airways. An example of an inspiratory scan from a single patient with asthma is shown in Figure 1, where the extrathoracic region (mouth and throat), the central (large) airways and the peripheral (small) airways are depicted. Both inspiratory and expiratory scans were used to produce models of the lung lobes.

Patient-specific three-dimensional model of the upper and lower airways, generated by computerized tomography scanning.
All modelling operations were performed using commercially available validated software packages (Mimics 15.0 and 3-Matic 7.0; Materialise NV, Leuven, Belgium).
Inhaler characteristics
In order to evaluate the effect of specific inhaler and patient characteristics on lung deposition, all other variables associated with a representative pMDI (including cone angle and spray velocity) were kept constant during the simulations. Characteristics relating to the aerosol plume were based on measurements for a representative pMDI (FP/FORM) and included cone angle, spray velocity and inhalation duration; 19 the MMAD (which excludes particles that impact on the ‘throat’ of the impactor) and FPF (which includes particles that impact on the ‘throat’ of the impactor; calculated as a percentage of the labelled dose) values varied depending on the experimental conditions (see below for details). The formulation characteristics (e.g. MMAD, FPF, and plume velocity and duration) for the marketed FP/FORM HFA-based pMDI were based on its published attributes19,20 and its half cone angle of 13°.
Influence of inhalation duration on lung deposition
The first sub-study evaluated the effects of different inhalation durations on modelled lung deposition. Particle characteristics used were an MMAD of approximately 3.0 μm [geometric standard deviation (GSD): 1.6] and an FPF of approximately 40%, which were based on the characteristics of FP/FORM (MMAD 3.2–3.5 µm; GSD 1.56–1.77; FPF 39.1–43.7%). 19 Simulations were performed for three different inhalation profiles with durations of 1, 3 and 5 s, matched for the same inspiratory volume (3 L), with actuation at the start of inhalation (Supplementary Figure A). A sinusoidal inhalation profile (similar to that of tidal breathing) was employed because this is routinely used to model breathing rhythms. pMDIs are recommended to be inhaled over 4–5 s, in order to achieve a flow rate of ~30 L/min and an inhalation volume of ~2.5 L; we therefore chose an inhalation duration of 5 s to reflect this. 14 Shorter inhalation durations of 1 and 3 s that are associated with faster inhalation flow rates (and are executed by some patients who use pMDIs) were also modelled.15,21 Mean flow rates were 180 L/min, 60 L/min and 36 L/min for the 1-, 3- and 5-s profiles, respectively; peak flow rates for each profile were 343 L/min (1 s), 114 L/min (3 s) and 69 L/min (5 s).
Influence of MMAD and FPF on lung deposition
The second sub-study assessed the effects of different MMAD and FPF values on modelled lung deposition. The simulations were performed on virtual monodisperse compounds using three MMAD (± GSD) values (1.5 ± 1.2, 3.0 ± 1.2 and 4.5 ± 1.2) and four FPFs (40%, 30%, 20% and 10%). A GSD of 1.2 was chosen because this is typical of a monodisperse aerosol profile, such as those evaluated in a previous clinical study. 22 The profiles were developed by taking a standard monodisperse profile and scaling down its FPF to a set value, with a corresponding increase in the proportion of large particles (>10 µm in diameter); the distribution is scaled so that losses in the pre-separator are taken into account. A sinusoidal inhalation profile (similar to that of tidal breathing that is often used as a typical breathing pattern) of 30 L/min over 3 s was used for all CFD simulations, with actuation timed as the start of inhalation (the timing of which can impact drug delivery in real life). An inhalation duration of 3 s was chosen because many patients who use pMDIs inhale too quickly 21 (ERS/ISAM guidelines recommend that patients inhale over 4–5 s). 14 We recognize that some patients inhale faster at the start of inhalation, and so we also modelled an inhalation profile to reflect this in a separate part of the study (see the following paragraph), in addition to modelling a longer inhalation duration to represent that recommended by ERS/ISAM (5 s; see above). 14 The simulation of other complex variables (e.g. droplet entrainment, evaporation, spray duration) was considered to be beyond the scope of this initial study.
Influence of inhalation profile on lung deposition of FP/FORM
The third sub-study evaluated the effects of different inhalation profiles on lung deposition of FP/FORM administered via an HFA-based pMDI; both the FP and FORM components of this formulation have an FPF of approximately 40% of labelled dose and an MMAD of 3.2–3.5 µm (GSD 1.56–1.77). 19 Models for the deposition of FP and FORM were modelled separately, but deposition data are presented as a composite. All deposition data are presented as a percentage of the metered dose and are therefore valid for all formulations. Simulations were performed with two different inhalation profiles: a sharp inhalation with peak flow shortly after the start [similar to the forceful inhalation when using a pMDI incorrectly and recommended when using a dry powder inhaler (DPI)] and a gradual inhalation with peak flow midway through the inhalation (similar to the gradual inhalation recommended when using a pMDI; Supplementary Figure B). 14 Profiles were assessed using an inhalation duration of 3 s (as described above), with actuation at the start of inhalation, at mean flow rates of 30 L/min and 60 L/min. Peak flow values were 47 L/min and 94 L/min for the gradual profile and 57 L/min and 114 L/min for the sharp profile at mean flow rates of 30 L/min and 60 L/min, respectively. The simulation of other complex variables (e.g. droplet evaporation, spray duration, initial ballistic velocities) was considered to be beyond the scope of this initial study.
CFD simulations
The 3D models of the respiratory tracts were subdivided into three regions (Figure 1): extrathoracic (from the mouth to the trachea at the top of the sternum), central (from the trachea to airways reconstructed from CT data) and peripheral (airways with a diameter of <2 mm, which were not visible on CT scans). The combination of central and peripheral regions was used to determine the total amount of lung deposition.
Surface meshes were created in 3-Matic and were converted to tetrahedral, 3D volume meshes using TGrid 14.0 (Ansys Inc, Canonsburg, PA, USA). CFD simulations were performed using the 3D models and applying the following boundary conditions: selected inhalation profiles were applied at the inhaler inlet to account for device-generated turbulence; the percentage of flow exiting the model towards a lung lobe equalled the relative lobar expansion, as obtained from patient-specific inspiratory/expiratory 3D models; when a particle hit the airway wall, it was assumed to be trapped at that location; any particle not deposited in extrathoracic or central airways was assumed to be deposited in peripheral airways. Although extrafine particles have a greater potential than larger particles to be exhaled, an in vivo study using extrafine beclometasone dipropionate/formoterol showed that only a very small fraction (2–3%) of extrafine particles was exhaled following a 10-s breath hold. 23 This was most likely due to the fact that extrafine particles deposit by sedimentation, meaning the extent of deposition of these particles is influenced by duration of breath hold: the longer the duration, the greater the deposition of extrafine particles and the lower the amount that can be exhaled. In this study, owing to the limited resolution of the CT scanner, particles depositing in bronchioles <1–2 mm in diameter could not be detected. Therefore, our results model the effects of a breath hold that is sufficient to allow deposition of particles in the peripheral airways. Further studies are required to fully explore the impact of breath hold on the deposition of extrafine particles.
Temporal discretization was accomplished using a second-order implicit formulation with a time step of 0.005 s. A pressure-based solver was used with a node-based Green–Gauss gradient treatment and a SIMPLE (semi-implicit method for pressure-linked equations) pressure–velocity coupling. Large eddy simulations (LES) using the kinetic-energy transport subgrid scale model were performed, and LES near-wall treatment was used. The spatial discretization options for pressure, momentum and subgrid kinetic energy were, respectively: standard, bounded central differencing and second-order upwind. An aggregative algebraic multigrid solver was used in combination with a Gauss–Seidel smoothing algorithm. Particle transport was modelled by an implicit Runge–Kutta Lagrangian discrete particle model, with one-way coupling of the forces from the flow to the particle and taking into account the Saffman lift forces. The aerosol plume was modelled by additional species transport equations for a compressible mixture.
Statistical analyses
All analyses were conducted using R version 3.2.5 (The R Foundation for Statistical Computing, Vienna, Austria), using linear mixed-effect models with a random intercept for the subject. Depending on the residual plots, the outcome parameter was logarithmically transformed and higher-order effects incorporated. To assess the goodness of fit, marginal R2 values were calculated and p values obtained by comparing the model with the null model using parametric bootstrap with 1000 simulations. The estimate and 95% confidence intervals (CIs) were generated using parametric bootstrapping with 200 simulations. Descriptive results are given as mean ± standard deviation (SD); formal statistical predictions are given as mean (95% CI).
Results
Patients
Imaging data from six patients with asthma were assessed in the studies. All patients had stable disease, as defined by the Global Institute for Asthma (GINA). 24 A total of four females and two males were included, with a mean (SD) age of 50 (18) years and a mean (SD) FEV1 of 83% (15%) of predicted (Table 1). Mean FEV1 was 83% of the predicted value (range, 60–93%) and mean FEV1/forced vital capacity (FVC) was 67% (range 61–72%; Table 1).
Key patient demographics, respiratory characteristics and treatments.

FEV1, forced expiratory volume in 1 s; FVC, forced vital capacity; ICS, inhaled corticosteroid; LABA, long-acting β2-agonist; SD, standard deviation.
Influence of inhalation duration on lung deposition
Total lung deposition (TLD; defined as the proportion of the formulation that reached the intrathoracic region) increased with increasing duration of inhalation, with mean ± SD values for the 1-, 3- and 5-s inhalation profiles of 22.8% ± 3.7, 36.1% ± 2.5 and 41.6% ± 3.1 of the metered dose, respectively (Figure 2; based on raw data). The remaining proportion of the formulation deposited in the extrathoracic region. TLD could be predicted using a concave down quadratic model (R2 = 0.87; p < 0.001; linear model predictions), with mean (95% CI) values of 22.8% (20.1%, 25.2%), 36.2% (33.7%, 38.3%) and 41.6% (39.3%, 34.8%) for the 1-, 3- and 5-s inhalation profiles, respectively.
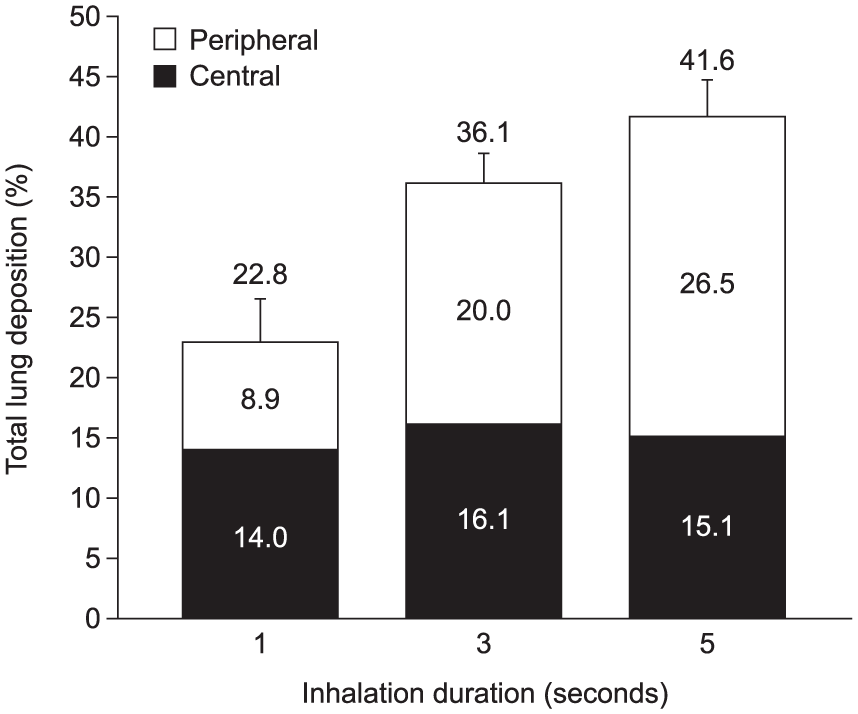
Modelled lung deposition at different inhalation durations.
The mean ± SD central-to-peripheral deposition (C:P) ratios for the 1-, 3- and 5-s inhalation profiles were 1.81 ± 1.12, 0.86 ± 0.39 and 0.61 ± 0.30, respectively, indicating an increase in the proportion of drug deposited peripherally with longer inhalation duration (Figure 2). The natural log of the C:P ratio could be predicted using a concave up quadratic model (R2 = 0.44; p < 0.001) and resulted in mean (95% CI) back-transformed values of 1.57 (0.99, 2.36), 0.80 (0.50, 1.15) and 0.55 (0.37, 0.80) for the 1-, 3- and 5-s inhalation profiles, respectively.
Influence of MMAD and FPF on lung deposition
Using FRI enabled the assessment of the effect of different FPF values on TLD while keeping MMAD constant, and vice versa. In the simulations performed in this study, TLD improved with increasing FPF values, whereas changes in MMAD had little effect on TLD. At each FPF value, TLD was similar for all three MMADs; for example, at an FPF of 10%, mean ± SD TLD was 8.5% ± 0.34, 8.1% ± 0.48 and 8.4% ± 0.81 for MMADs of 1.5, 3.0 and 4.5 μm, respectively, and at an FPF of 40%, mean ± SD TLD was 34.4% ± 1.37, 32.5% ± 1.93 and 33.6 ± 3.25, respectively (Figure 3). By contrast, mean ± SD TLD was greater at higher FPFs, increasing from 8.1% ± 0.48 of the metered dose at an FPF of 10%, to 16.2 ± 0.97 at an FPF of 20%, 24.4% ± 1.45 at an FPF of 30% and 32.5% ± 1.93 at an FPF of 40% for an MMAD of 3.0 μm (Figure 3). These trends were confirmed when using a mixed-effects model to assess the influence of FPF or MMAD on TLD; increasing FPF was found to be significantly associated with increasing TLD (p < 0.001), whereas MMAD was found to have no effect on TLD (p = 0.30). When averaged over the 1.5, 3.0 and 4.5 μm MMAD values, the total linear model (R2 = 0.97; p < 0.001) resulted in mean (95% CI) values of 8.3% (7.2%, 9.3%), 16.7% (15.5%, 17.6%), 25.0% (23.8%, 26.0%) and 33.4% (32.2%, 34.4%) for FPF values of 10, 20, 30 and 40%, respectively.

Modelled total lung deposition according to MMAD at different fine particle fraction values.
Interestingly, MMAD had an effect on regional lung deposition (Table 2). For all FPFs tested, mean ± SD C:P ratios were 0.43 ± 0.11, 0.74 ± 0.35 and 1.68 ± 1.07 for MMAD values of 1.5, 3.0 and 4.5 μm, respectively, indicating an increase in the proportion of central deposition and a corresponding decrease in peripheral deposition at higher MMADs (Table 2). The natural log of the C:P ratios could be predicted using a concave up quadratic model (R2 = 0.51; p < 0.001) and resulted in mean (95% CI) back-transformed values of 0.42 (0.28, 0.58), 0.67 (0.44, 0.98) and 1.40 (0.90, 1.98) for MMAD values of 1.5, 3.0 and 4.5 μm, respectively. Regional lung deposition (C:P ratio) was not influenced by FPF (p = 0.91).
Modelled lung deposition according to MMAD at different FPF values.

Data are shown as mean values; deposition data are shown as a percentage of the metered dose.
C:P ratio, central:peripheral deposition ratio; FPF, fine particle fraction; MMAD, mass median aerodynamic diameter.
Influence of inhalation profile on lung deposition of FP/FORM
The influence of different inhalation profiles and flow rates on lung deposition of FP/FORM was assessed while keeping other patient factors, such as inhalation duration, constant, thereby allowing assessment of these factors independently. FP/FORM deposited throughout central and peripheral airways, with both gradual and sharp inhalation profiles (Figure 4). A gradual inhalation was associated with a trend for higher TLD than a sharp inhalation, and within each inhalation profile, a flow rate of 30 L/min was associated with a trend for higher TLD than a flow rate of 60 L/min. For example, for FP, mean ± SD TLD with a gradual inhalation profile was 44.0% ± 2.6 and 42.4% ± 2.9 at flow rates of 30 and 60 L/min, respectively, and 39.7% ± 3.1 and 36.1% ± 2.5, respectively with a sharp inhalation profile (Figure 4). In the mixed-effect model, inhalation flow rate and flow profile were both found to have a significant effect on TLD (p < 0.001). Averaged over FP and FORM, the total linear model (R2 = 0.52, p < 0.001) resulted in mean (95% CI) TLD values of 44.3% (42.0%, 46.2%) and 41.7% (39.4%, 43.6%) for gradual inhalation profiles at flow rates of 30 L/min and 60 L/min, respectively, and 39.1% (36.8%, 41.0%) and 37.0% (34.4%, 38.5%), respectively, for sharp inhalation profiles.

Modelled lung deposition of FP and FORM for different inhalation profiles and flow rates. Modelled data are based on the FP/FORM 125/5 µg pressurized metered-dose inhaler. Total lung deposition is shown as a percentage of the labelled dose. Data are shown as mean values ± SD.
A greater proportion of peripheral deposition was observed with the gradual inhalation profile than with the sharp profile (Figure 4). In the mixed-effect model predicting the natural log of the C:P ratios, inhalation flow rate and flow profile were found to have a significant effect (p < 0.001). Averaged over FP and FORM, the total linear model (R2 = 0.30, p < 0.001) resulted in mean (95% CI) back-transformed C:P ratio values of 0.36 (0.24, 0.51) and 0.45 (0.30, 0.64) for the gradual inhalation profile at flow rates of 30 L/min and 60 L/min, respectively, and 0.63 (0.42, 0.88) and 0.79 (0.54, 1.11), respectively for the sharp inhalation profile.
Deposition patterns for FP and FORM from a representative patient at inhalation flow rates of 30 L/min and 60 L/min are shown in Figure 5. Both the ICS (FP) and LABA (FORM) components deposited throughout the central and peripheral airways for both flow rates, as shown by the blue/green shaded areas. The block-shaded areas represent the different lung lobes, with the corresponding pie charts showing the proportion of FP or FORM deposited in each lobe. This demonstrates further that FP and FORM deposited throughout the lungs at flow rates of 30 L/min and 60 L/min.

Representative modelled deposition of fluticasone propionate and formoterol from one patient, at flow rates of 30 L/min and 60 L/min.
Discussion
Although mathematical modelling provides researchers with a powerful tool for estimating the deposition and distribution of an inhaled drug, a key limitation is that these models are not able to fully replicate the situation in real-life or in vivo settings. For example, they cannot mimic the complex physics associated with aerosol formulations (e.g. the rapidly evaporating and decelerating propellant droplets emitted from pMDIs) 25 and they do not account for important physiological factors that can affect drug deposition, such as airway humidity and surface features.3,4
In vivo scintigraphy is clearly the gold standard for assessing lung deposition.1,2 Nevertheless, FRI provides a valuable alternative to conducting in vivo scintigraphy studies, because radiation exposure is reduced, allowing multiple assessments to be made in the same patient’s lungs. Importantly, data from FRI modelling studies have been shown to correlate well with in vivo data obtained using scintigraphy.7,23,26,27 For example, lung deposition achieved with two FP/salmeterol pMDIs (Evohaler® and a similar inhaler developed by Cipla Ltd, Mumbai, India) was 18% when assessed by FRI, 27 compared with 16% when assessed by scintigraphy. 26 Likewise, lung deposition of beclomethasone dipropionate/FORM pMDI was almost identical when assessed by FRI (generated with the same algorithm as used in the present study) and scintigraphy (30% and 31%, respectively).7,23,26
FRI enables investigation of the effect that specific patient factors, and device and formulation characteristics, have on lung deposition because other variables can be kept constant. This means that FRI can provide important theoretical insights into the effects of some specific inhalation characteristics (e.g. inhalation profile and duration) and aerosol formulation characteristics (e.g. FPF) on lung deposition of a modelled, monodisperse particle distribution. To our knowledge, this is the first study to investigate the effect of specific formulation and patient characteristics on lung deposition using FRI (while all other factors are kept constant), and is the first to assess the effect that some of these factors have on the deposition of FP/FORM. Insights from this study, together with future studies assessing more complex particle-size distribution patterns, could help in the management of patients with asthma in everyday practice or in the development of new devices and formulations for inhaled drugs.
Inhalation duration and lung deposition
For the first time, FRI allowed us to evaluate the specific effects of inhalation duration on lung deposition while matching for other patient factors such as inspiratory volume and inhalation profile. Our findings provide useful data in support of ERS/ISAM guidelines, which recommend a slow and deep inhalation lasting 4–5 s when using a pMDI. 14 A fast inhalation is the most common handling error observed with a pMDI.15,21 Many patients also find it difficult to coordinate actuation of their pMDI with inhalation, particularly if they inhale quickly;12,21 indeed, the requirement for a slow inhalation is supported by a study in 18 patients with obstructive lung disease, in which a device in which a laser aerosol photometer was combined with a piston-type ventilator was used, allowing the subject to inhale particles at controlled breathing patterns. A controlled, slow inhalation was shown to provide significantly greater lung deposition than a faster inhalation (100 cm3/s, 79%; 250 cm3/s, 70%; p = 0.01). 28 Therefore, there is a clear logic behind the guidelines: for patients who inhale too rapidly with a pMDI, extending the inhalation duration to 4–5 s would reduce the inhalation flow rate (assuming the same inspiratory volume) and thereby improve lung deposition. It should also reduce the number of coordination errors, because it allows more time for the patient to coordinate pMDI actuation with inhalation.
The current study suggests that for the representative pMDI (FP/FORM) model used in these simulations, an inhalation duration of 5 s (recommended by ERS/ISAM guidelines 14 ) leads to a high level of lung deposition, with good levels of peripheral and central deposition; however, our results also showed that high levels of deposition were achieved even with a 3-s inhalation (nearly 90% of that seen with a 5-s inhalation). This implies that while the recommended 4–5-s inhalation should remain a goal for optimal deposition, this perhaps should not be treated as an absolute cutoff value below which inhalation is considered inadequate, and a shorter duration should not necessarily be considered an error. Notably, the formulation assessed in this study suggests that modern pMDIs have the potential to provide good deposition, even when peak flow rates exceed 60 L/min (69 L/min and 114 L/min for the 5-s and 3-s inhalations, respectively), a flow rate previously suggested as being unsuitable for pMDIs. 21 Lung deposition with a 1-s, sharp inhalation, however, was markedly lower than with longer durations, delivering approximately half the dose achieved with the 5-s inhalation.
Interestingly, central deposition was similar for all three inhalation durations (approximately 15%), whereas peripheral deposition was improved with slower and longer inhalation. This suggests that, while the speed and duration of inhalation may make little difference to the efficacy of bronchodilators (which act primarily in central airways), 22 a slower and longer inhalation may be an advantage for anti-inflammatory agents (which should be distributed throughout the central and peripheral airways for optimal efficacy). 29 This also raises the question of whether this tenet applies to all types of devices, including DPIs. It is reasonable to assume that the same principles apply to all particle types, and therefore that the fast and forceful inhalation manoeuvre required to deagglomerate the powder and generate respirable particles with DPIs may limit the amount of drug that can reach peripheral airways. Further work should be conducted to assess whether this is the case.
MMAD, FPF and lung deposition
The use of FRI allowed us to assess independently the effects of MMAD and FPF on lung deposition for a specific, monodisperse fraction. A sinusoidal inhalation profile was used (similar to that of tidal breathing that is often used to represent a typical breathing pattern), with actuation timed as the start of inhalation (the timing of which can impact drug delivery in real life). However, we recognize that some patients inhale faster at the start of inhalation, so we also modelled a ‘sharp’ inhalation profile to reflect this when evaluating the lung deposition of FP/FORM (discussed above). By modelling a formulation that contained a monodisperse fraction with a specified particle size as well as a proportion of particles that were greater than 10 µm, we could alter MMAD and FPF separately. This enabled us to assess the impact of each of these parameters on TLD – which would be difficult to achieve with real-world formulations. Our findings showed that FPF had a large impact on TLD, whereas MMAD had little effect at the same FPF. There was a linear increase in TLD with increasing FPF (R2 = 0.97, p < 0.001), whereas TLD was similar across all three MMADs (1.5, 3.0 and 4.5 µm) at each specific FPF value (p = 0.30). The reasons underlying this observation are not fully elucidated. However, it is important to note that the calculation for FPF includes all particles with a diameter <5.0 μm, including those that deposit in the ‘throat’ of the impactor. By contrast, MMAD excludes particles that impact on the ‘throat’, which usually constitute the majority of the total dose. The effect of other particle distributions on these parameters is unknown.
Previous studies have suggested that aerosols containing extrafine particles provide greater lung deposition than those with larger particles; indeed, as noted in the Introduction, this is often used to explain the differences in doses required for asthma control between HFA-based and CFC-based BDP therapies.16–18 However, the marked difference in FPF between the HFA- and CFC-based formulations (36% and 18% of metered doses, respectively) 18 is rarely mentioned, even though the fine particle dose provided by a 100 µg dose of HFA-based BDP is similar to that from a 250 µg dose of the CFC-based BDP formulation (34.5 µg and 45 µg, respectively). 30
The present study adds to the debate around the most appropriate MMAD for particles to deposit in the lungs. In this study, TLD was consistent for particles with an MMAD of 1.5, 3.0 and 4.5 µm, with TLD highest when FPF was high (40%). Other studies also suggest that particles with an MMAD in the range 1.5–4.5 µm can achieve good lung deposition, consistent with these findings. For example, modest differences in TLD were reported for monodisperse salbutamol aerosols with MMADs of 1.5, 3.0 and 6.0 µm (TLD: 56%, 51% and 46%, respectively) in a scintigraphy study. 22 A separate study, which used monodisperse FP aerosols to evaluate the effects of particle size on systemic bioavailability, showed that although deposition was reduced at the largest particle size studied (MMAD 6.0 µm) compared with smaller particle sizes, systemic bioavailability was similar for aerosols with MMADs of 1.5 µm and 3.0 µm. 31 A study that used activated charcoal to block gastrointestinal drug absorption evaluated the pulmonary bioavailability of monodisperse BDP aerosols and reported greater lung deposition for aerosols with MMADs of 3.0 µm and 4.5 µm than for those with an MMAD of 1.5 µm. 32 The reduced lung deposition with the smallest particles was thought to be due to a large proportion of small particles being exhaled owing to the lack of efficient deposition mechanisms. 32 This hypothesis was supported by a scintigraphy study that showed that 22% of particles with an MMAD of 1.5 µm were exhaled, compared with 8% and 2% of particles with MMADs of 3.0 µm and 6.0 µm, respectively. 22 Taken together, these suggest that there is little difference in total deposition for particle sizes in the range of 1.5–4.5 µm for formulations with a high FPF, but suggest a decrease in deposition when particle size increases above 5.0 µm.22,31,32
MMAD may instead provide more information about the relative regional deposition of particles. Our study showed that MMAD did indeed have some influence on regional lung deposition. For smaller particles (MMADs, 1.5 μm and 3.0 μm), deposition occurred mainly in the peripheral airways, whereas for larger particles (MMAD, 4.5 μm), deposition was mainly in the central airways. This is consistent with findings reported by Usmani and colleagues, who showed that peripheral deposition decreased with increasing MMAD (1.5 µm, 25%; 3.0 µm, 17%; 6.0 µm, 11%), although central deposition was similar across the different MMADs (1.5 µm, 32%; 3.0 µm, 34%; 6.0 µm, 35%). 22 By contrast, we found that FPF did not influence regional lung deposition.
Our study thus underlines the important influence of FPF on TLD and indicates that TLD is not solely related to the MMAD of a drug; however, it suggests that MMAD may have an effect on regional lung deposition.
Inhalation profile and FP/FORM deposition
Our FRI study provided a first insight into the lung deposition associated with FP/FORM. It showed that a gradual inhalation profile and flow rate of 30 L/min were associated with significantly higher TLD than a sharp inhalation profile at a flow rate of 60 L/min, although FP/FORM provides high levels of lung deposition (35.8–44.0% of metered dose) with both inhalation profiles and flow rates. Importantly, deposition of FP/FORM occurred throughout the central and peripheral airways. FP/FORM has a high FPF of approximately 40% of the metered dose, 19 and, as discussed above, this may explain the high levels of drug deposition seen with FP/FORM. Our results also highlight that a formulation with an MMAD of >1.5 µm can reach the peripheral airways; FP/FORM, with an MMAD of 3.2–3.5 µm, showed a greater proportion of lung deposition in the peripheral airways than in the central airways in all conditions tested.
With FP/FORM, lung deposition occurred mostly in the peripheral airways, although some variation in peripheral distribution was observed across the different inhalation conditions; central deposition showed little variation across inhalation profiles and flow rates. The reasons for higher peripheral lung deposition with a gradual inhalation than with a sharp inhalation remain to be determined. However, this may be due to an increased likelihood of particles impacting the throat and walls of the proximal airways from the force of a sharp inhalation; this would be less likely with a gentler, gradual inhalation, thereby increasing the likelihood of peripheral deposition. Given the involvement of both small and large airways in asthma, a balance between central and peripheral deposition may be important, especially for ICS/LABA combinations that provide both anti-inflammatory and bronchodilatory effects. 33
The ability to provide high levels of lung deposition despite variations in inhalation profile and flow rates may also be relevant given how pMDIs are used in real life: patients exhibit a diverse range of inhalation profiles that vary not only among patients but also in successive breaths by the same individual. 34 FRI showed that the FP/FORM pMDI was forgiving at high inspiratory flow rates, providing consistent deposition even at the high peak flow rates assessed in the study (94 L/min and 114 L/min for gradual and sharp profiles, respectively, for 60 L/min). Furthermore, the inhaler characteristics of the FP/FORM pMDI were similar to those used to assess the different inhalation profiles, suggesting that FP/FORM may provide some deposition even at excessive flow rates.
Study limitations
In addition to the general modelling limitations outlined above, it is important to note that the modelled distribution used in this study (a monodisperse fraction with a fraction of >10 µm) does not represent the complicated particle-size distributions of pMDIs seen in real life. This was intended to be a theoretical study, to provide some initial insight into the effect of specific inhalation characteristics (inhalation duration, flow rate, MMAD and FPF) on lung deposition for the theoretical formulation used, while keeping all other variables constant; the effect of other particle distributions on these parameters is unknown. The influence of factors such as particle evaporation and deceleration was not addressed specifically, as this was beyond the scope of this study. However, the particles went through evaporation and some deceleration because the model took the particle distributions from an Anderson cascade impactor. Further studies are required to assess fully all of the parameters that may influence drug-deposition patterns in real life, including the full, complex physics of aerosols. However, the findings from this study may still provide useful information regarding the effect of some inhalation and patient characteristics on TLD for real-life formulations.
Another limitation is that, in this model, the inhaler was actuated at the start of inhalation, reflecting a good inhaler technique. Many patients, however, have difficulty coordinating inhalation with actuation, so our findings are more representative of optimal use of a device than may be of typical use in clinical practice. However, it should also be recognized that in vivo studies with scintigraphy assess drug deposition only in highly trained patients, so these studies are also reflective only of optimum technique and do not necessarily indicate deposition achieved in everyday use. Further FRI studies could potentially evaluate the effects of differences in the timing of inhaler actuation on lung deposition.
Conclusion
There is a complex interplay between the factors that affect lung deposition, and therefore clinical efficacy, of an inhaled drug. These include inhalation profile and formulation characteristics, as well as anatomical variation among patients and lung function. Although FRI carries general limitations associated with any mathematical modelling, it may still provide important insights into the relative contributions of, and interplay between, these different factors. In particular, it reduces the need to dose patients with radioactively labelled compounds and facilitates testing that would be difficult, costly and time-consuming in vivo.
The results of our modelling study using FRI show how inhalation characteristics and aerosol particle size may affect lung deposition for a specific particle-size distribution. Our data support the ERS/ISAM guidelines, which recommend a long, slow inhalation because this clearly improves both TLD and peripheral deposition. The study also demonstrates that, for the specific particle-size distribution used, FPF can have a major effect on TLD, with deposition increasing as FPF increases, whereas MMAD only influenced regional deposition at the same FPF. Finally, this is the first study to predict that the FP/FORM pMDI should provide high levels of drug deposition throughout the central and peripheral airways, and that variation in inhalation profile and flow rate would be expected to have little effect on deposition. Future studies using FRI will further our understanding of the deposition of inhaled drugs and therefore help to improve the management of asthma.
Footnotes
Acknowledgements
The authors are grateful to Dr Lizzy McAdam-Gray (Oxford PharmaGenesis Ltd, Oxford, UK) for providing medical writing support (including preparing an outline of the manuscript based on teleconferences and correspondence with the authors, and collating the authors’ comments). Funding for medical writing support was provided by Mundipharma International Ltd, Cambridge, UK. The authors take full responsibility for the content of the article. ® FLUTIFORM is a registered trademark of Jagotec AG. EVOHALER is a registered trademark of Glaxo Group Limited.
Funding
The study was supported by Mundipharma International Limited, Cambridge, UK.
Conflict of interest statement
JM is an employee of Mundipharma International Limited. JDB and WV are shareholders and board members of FLUIDDA NV, a company that has commercialized some of the techniques used in this article. CVH is an employee of FLUIDDA NV.
References
Supplementary Material
Please find the following supplemental material available below.
For Open Access articles published under a Creative Commons License, all supplemental material carries the same license as the article it is associated with.
For non-Open Access articles published, all supplemental material carries a non-exclusive license, and permission requests for re-use of supplemental material or any part of supplemental material shall be sent directly to the copyright owner as specified in the copyright notice associated with the article.