
Abstract
Objectives:
Narrow-band imaging (NBI) is a widely available endoscopic imaging technology; however, uptake of the technique could be improved. Teaching new imaging techniques and assessing trainees’ performance can be a challenging exercise during a 1-day workshop. To support NBI training, we developed an online training tool (Medimq) to help experts train novices in NBI bronchoscopy that could assess trainees’ performance and provide feedback before the close of the 1-day course. The present study determines whether trainees’ capacity to identify relevant pathology increases with the proposed interactive testing method.
Methods:
Two groups of 20 and 18 bronchoscopists have attended an NBI course where they did a pretest and post-test before and after the main lecture, and a follow-up test 4 weeks later to measure retention of knowledge. We measured their ability to mark normal and abnormal ‘biopsy size’ areas on bronchoscopic NBI images for biopsy. These markings were compared with areas marked by experts on the same images.
Results:
The first group results were used to pilot the test. After modifications, the results of the improved test for group 2 showed trainees improved by 32% (total class average normalized gain) in detecting normal or abnormal areas. On follow-up testing, Group 2 improved by 23%.
Conclusions:
The overall class average normalized gain of 32% shows our test can be used to improve trainees’ competency in analyzing NBI Images. The testing method (and tool) can be used to measure the follow up 4 weeks later. Better follow-up test results would be expected with more frequent practice by trainees after the course.
Introduction
New endoscopic technologies in the hospital operating room (OR) have dramatically improved the technical performance of surgical procedures. Open surgery and traditional literature allows teaching from an external view, but endoscopic interventions provide a completely different internal perspective. This paradigm shift challenges the traditional doctors’ anatomical and diagnostic knowledge, as high-resolution imagery of internal organs needs to be understood. In bronchoscopy and colonoscopy for example, high-definition images can be captured using short focal-distance camera in narrow-band imaging (NBI), ultrasound or auto-fluorescence techniques.
Training practitioners is key to using the enhanced diagnosis potential of this technology to identify the previously invisible features of pathologies now observable using new imaging techniques, or visible in higher-resolution images. Although it has been shown that frequent assessment can be used to enhance and reinforce learning, current literature-based image recognition learning is passive with books [Cohen, 2007; Muto et al. 2015; Olympus, 2007], one active multiple-choice questionnaire application [http://www.nbiatlas.com.au/login.asp], and no frequent testing available. Early training [Anderson et al. 2001] (understanding and remembering) can be done with atlases of NBI images and videos, but more advanced learning (analyzing and applying) requires interactive training tools before practicing on patients. These training activities need to be followed by rehearsal sessions to improve skills, confidence, and ability to self-assess [Duvivier et al. 2011]. The challenge of NBI imaging is the training of thoracic doctors in Australia to use that technology (it is available in most endoscopy units, but often not routinely used) and also to gain self-confidence to realize the diagnosis potential of the technology (e.g. locating optimal biopsy area). We describe here the design of an interactive image-based test to support an NBI bronchoscopy-training course. The test has been designed to evaluate the improvement of subjects’ NBI knowledge and the effectiveness of interactive testing,
Imaging technique
NBI refers to an imaging technique for endoscopic diagnostic medical tests, where light of specific blue and green wavelengths is used to enhance the details of the mucosa surface [Uedo et al. 2006]. A special filter is electronically activated in the endoscope to illuminate the inspected area with wavelengths of 440 to 460 nm (blue) and 540 to 560 nm (green). Because the peak light absorption of hemoglobin occurs at these wavelengths, blood vessels appear very dark, increasing their visibility and facilitating the identification of other surface structures related to pathologies.
NBI is a new imaging modality for the bronchus, and head and neck regions. NBI shows the early abnormal angiogenesis seen in premalignant and malignant lesions [Uedo et al. 2006], with a higher sensitivity, specificity and diagnostic odds ratios compared with autofluorescence imaging bronchoscopy [Iftikhar and Musani, 2015]. These features have been well documented in the colon and oesophagus; dysplasia and clinically isolated syndrome (CIS) exhibit characteristic brown decolorization and dots that are a feature of early abnormal angiogenesis [Muto et al. 2004]. These dots are in fact due to intrapapillary capillary loops (IPCLs) [Machida et al. 2004]. These loops do not appear in pathology specimens until at least moderate dysplasia is reached. Literature from gastroenterological experience of NBI has shown that it has a high specificity, but its sensitivity has been found to be as low as 77% [East et al. 2008].
Challenges of learning a new image modality
Benefits of image testing
The need to do a mucosal biopsy and the choice of biopsy site is based on visual perception, which includes the recognition of complex image features [Goldstone, 1998]. Furthermore, it has been shown that trying to learn the relevant dimensions in recognizing and naming a visual stimulus can be counterproductive for a human trying to learn distinctive dimensions of an image [Schooler and Engstler-Schooler, 1990]: taxonomies can interfere with the ability to learn diagnostic skills or interfere with skills that learners already have acquired. Therefore, we did not hypothesize the duration of the perceptual process (i.e. participants can spend the time they choose on every image), and we did not teach them, prior to the test, the relevant dimensions of an NBI image (e.g. by giving them a taxonomy or a set of patterns as a model). The tests are built with a balance of real-case healthy- and unhealthy-bronchus NBI photos from bronchoscopy HD video. Participants were asked to go through a database of NBI photos and annotate areas as either normal or abnormal. Following the perceptual learning training experience, trainees might not be able to articulate what they know in terms of pattern recognition, but will have built their own diagnostic skills thanks to the feedback provided to their answers at the end of each test.
Hypothesis
We hypothesized that trainee NBI knowledge increases with the proposed interactive-testing method.
The Medimq software
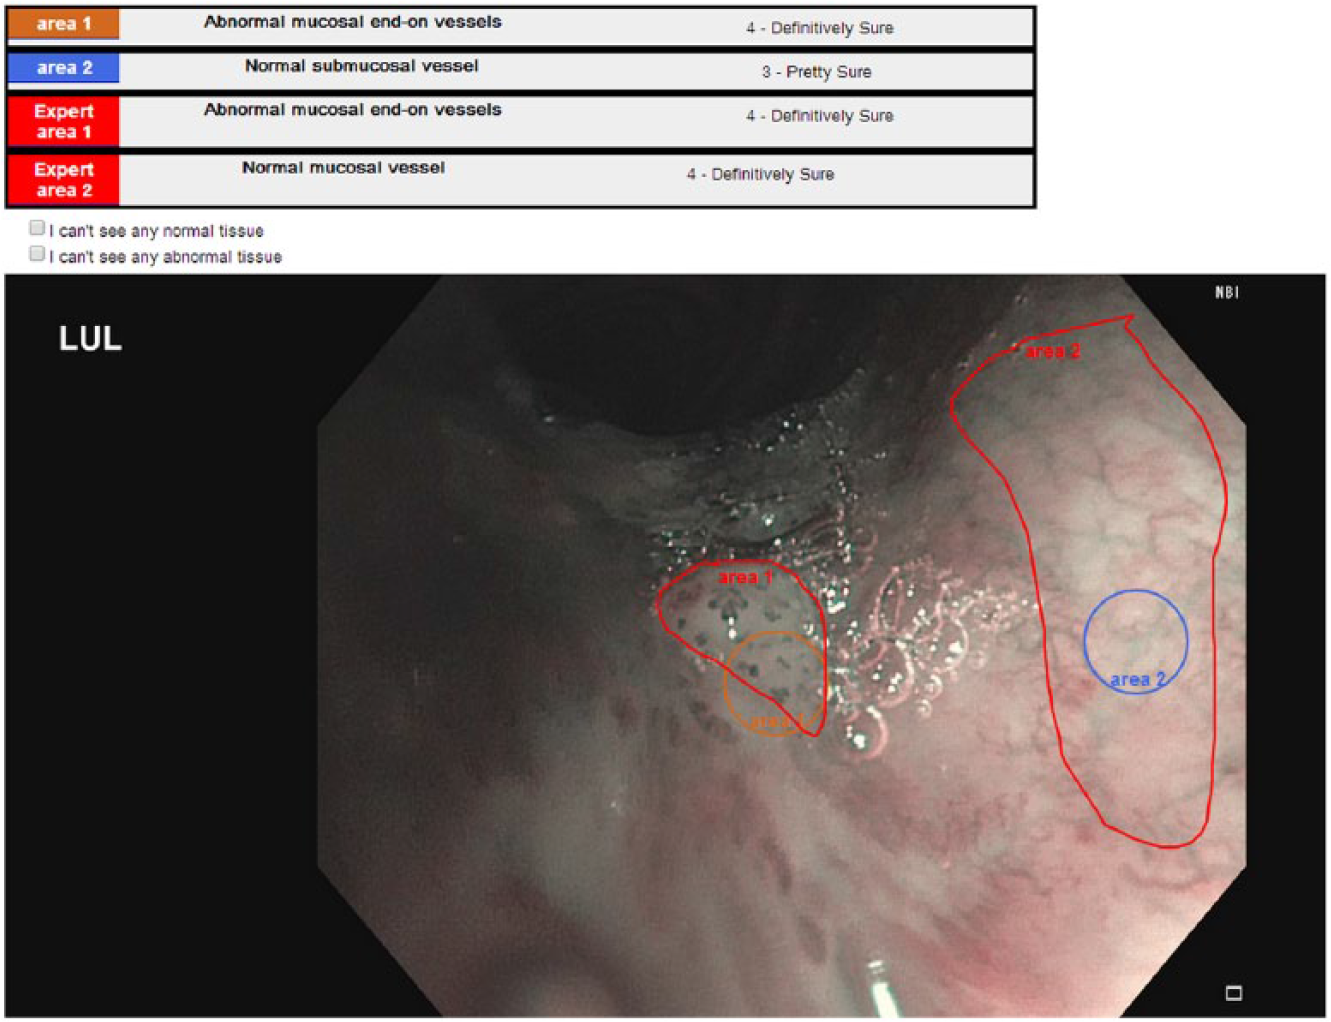
The interactive testing has been performed with an online medical images tool, Medimq, developed at the Australian e-Health Research Centre for the purpose of the study. Medimq [Dumas et al. 2014] is an online interactive image-based training tool (http://medimq.appspot.com/) that can provide immediate feedback on pathology recognition. The tool allows trainees to directly mark up medical images (see Figure 1) to show where they would biopsy. It features a ‘biopsy size’ visual marking tool for the trainees (Figure 1, center and right images), as well as a broad area visual marking tool from experts to map the full extent of abnormalities on the images (Figure 1, left and center images). A test set of images is fully marked by one expert with those broad areas prior to the test (in a special ‘expert mode’ of Medimq). After the trainees did the test, the tool calculates a score based on whether trainee-marked sites were within the expert-marked area. The order of the images was randomized for each new trial.

Preparing the test, the expert (left image) marks the correct answers in the whole image, by drawing and describing areas with its own taxonomy (centre image). During the test day, the trainee (right image) marks biopsy sites interactively and describes them with the same taxonomy.
All course attendees had access to a computer with a 21-inch screen and an Internet browser in full-screen mode (where the software has been previously tested). They were separated into two groups, in two rooms.
During the training day, participants were asked to perform a pretest in the morning and a post-test in the afternoon in 1 hour maximum (see Table 1). The question asked for each image was: ‘Give a single example for as many of these vessel types by clicking on them and labeling them. Only mark vessels which are in focus.’ The sites were marked with fixed-size circles (see figure 1, right image) of 50 pixels diameter in a 1024 pixel-wide image; expert zones were delineated contours to describe the whole image (see figure 1, left image). The same images dataset was used for the pre and post test to observe trainees’ progression. Trainees could check their answers on the same day: the software provides a result mode where the details of answers are given per image (see Figure 2).
Planning of the test.

Detailed view, where the trainee can compare his or her answers with the expert’s one.
A follow-up test was done 4 weeks later to test long-term retention of knowledge.
The participant had to qualify each place marked in the image as normal or abnormal, mucosal or submucosal, and had the opportunity to describe it with the type of pathological vascular pattern described below.
For each answer, the degree of confidence was possible to set: Very unsure, pretty unsure, pretty sure and definitively sure.
The sensitivity and the specificity of the trainees’ answers were compared to the experts’, who have answered the test before the training sessions.
For each answer collected, the overlapping of the circle marked was compared with the expert zones answers. If an overlapping occurred, then the percentage of overlapping was calculated, and the answers were compared.
Method
We trialed a photographic interactive quiz on attendees at a dedicated 1-day NBI training course in 2012 (Group 1). After updating the test, we studied the results of the quiz on another group of attendees at a second 1-day NBI training course in 2013 (Group 2). These courses were run by bronchoscopists at the Royal Brisbane and Women’s Hospital, experienced in NBI procedures. All the images provided were chosen among those experts’ collection, where all classifications of abnormal images were on the basis of biopsies done by the experts. The classification of the biopsies with the type of pathological vascular pattern was similar to the Shibuya descriptors [Shibuya et al. 2003]:
Normal mucosal vessel
Normal submucosal vessel
Abnormal mucosal
Abnormal mucosal
Abnormal mucosal
Abnormal submucosal vessel
A low risk Queensland Health Ethics approval (reference HREC/12/QRBW/259) was granted for these evaluations on 20 August 2012.
Protocol
Planning
Three tests were performed with a prequestionnaire (see Table 1).
All tests were balanced between the conditions: anatomy (submucosal/mucosal) and pathology (abnormal/normal). None of the NBI images of the (pre/post/follow-up) tests were used during the NBI course itself, where other images and videos are used.
Measurements
For each marked zone, comparing the diagnostic with the expert answer, we can find if the subject has detected a true positive, false positive, true negative or false negative (see Table 2).
The true/false diagnostic used in our questions’ marking.

To measure trainees’ learning during the NBI course, we calculate both the normalized learning gain for the class (g) and the individual trainees (ḡ) [Bao, 2006]:
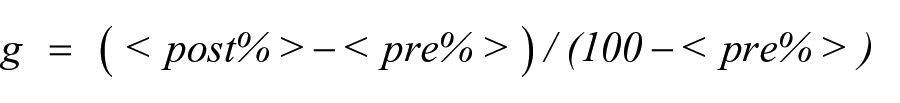

where k goes from 1 to n, the number of trainees, <pre%> and <post%> are the class-average scores to the pre and post tests, before and after the NBI course. The g-factor is widely used in assessing students’ performance in pre and post test. One of the most popular studies [Hake, 1998] using g-factor shows that interactive learning outperforms traditional learning in physics classes. An accepted target for g is 30%, defining a minimum value at which the educational intervention can be regarded as effective [Colt et al. 2011]. The normalized gain per student, ḡ, is compared with g to understand how the group of trainees has changed between the pre and post tests [Bao, 2006]. A significance test to check the hypothesis (of trainees progressing between each test) is performed with the two-proportion z-test (using the normal distribution). The resulting p value is compared to the significance level of 0.05.
Group 1
Methods for Group 1 (2012)
NBI Images
NBI Images were from two types of digital bronchoscope (Olympus BF 180 and HD 190). They have been anonymized and displayed in a 1024 pixels-wide window to look the same for all participants. The same image dataset was used for the pre and post test to observe trainees’ progression (see Table 3). They had access to the expert answers only after the post test.
Content of the 2012 test.
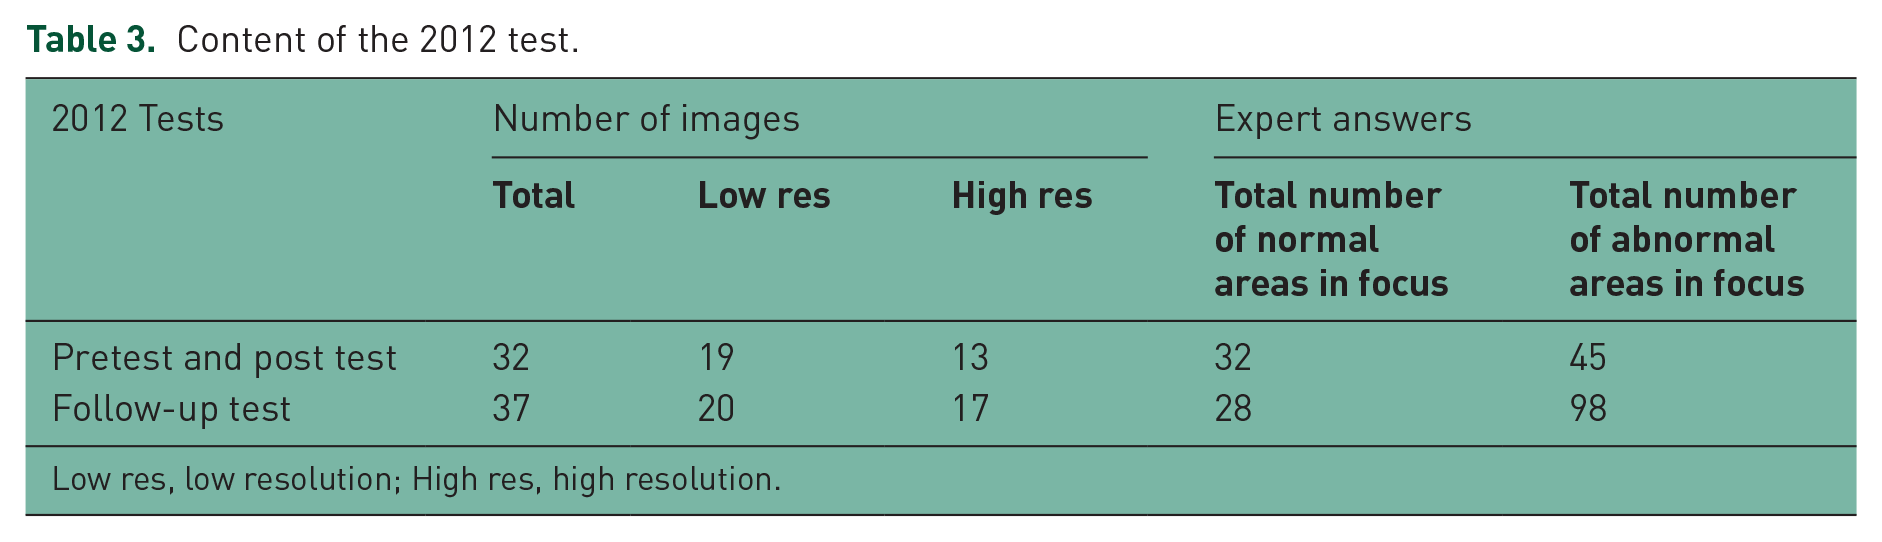
Low res, low resolution; High res, high resolution.
Group 1 Participants
The group had 20 participants, all thoracic medicine doctors with an experience in bronchoscopy (see Table 4).
Participant details.

Six of them were teaching bronchoscopy and another three of them had already performed NBI; only one in those three has performed more than 20 NBI procedures in his career, so they were all considered novices.
The follow-up rate was 100% for the pre and post test, and 75% for the follow-up test (five have not done the follow-up test). Our Chi-square test with Yates’ continuity correction revealed that the false positive and true positive percentage did not significantly differ between those who have completed the follow-up test and those who have not; so all the answers have been considered together in the result section.
Results for group 1
All candidates completed the 32 questions of both tests in 1 hour or less.
Between the first test (pre) and the second (post) tests, the group 1 improved in detecting true negative (78% class average normalized gain, see Tables 5a and 5b), but worsened in detecting true positive (–19.8% class average normalized gain, see Tables 6a and 6b). Between the training day and the follow-up test (noted follow up) 4 weeks later, the group improved in detecting true positive (+45% class average normalized gain) and worsened in detecting true negative (–25% class average normalized gain). Scores for the group (g) and trainees (ḡ) are similar, showing the progression has been similar for all trainees.
Total true negative score. Correct answers are true negative; wrong answers are false positive.

F-up, follow-up.
The class average normalized gain g and the average single-student normalized gain ḡ.

Total true positive score: correct answers are true positive, wrong answers are false negative.

F-up, follow-up.
The class average normalized gain g and the average single-student normalized gain ḡ.

F-up, follow-up.
Discussion for group 1
The first evaluation showed that it was possible to evaluate a group of consultants or registrars in a pre or post test with the same dataset of images in a limited time (1 hour for each test) to observe their progression. We identified a number of possible reasons for the unexpected negative results (poor abnormal vessel recognition):
Five of the 32 images of the pre and post tests had side by side of the same bronchus (see Figure 3), so it was difficult for the subjects to observe properly the NBI image on only half of the monitor surface
19 images of the test were low resolution, with a mean size of 596 x 410 pixels, deteriorating the close observation of abnormalities
abnormal tissues were over represented in the pre and post test (see Table 3).

One of the normal and NBI-lighting images of the pre and post tests.
Based on those observations, we could not properly interpret the results between pre and post tests for group 1. Therefore, we decided to improve the test for the next group.
Group 2
Methods for group 2 (2013)
Based on the results of the group 1, we improved the protocol for the pre and post tests. The follow-up test was the same in 2012 and 2013, in order to compare performance between the two groups.
NBI Images
For the 2013 group, all the images were recorded with a 190 series bronchovideoscope to provide only high-definition pictures, and chosen to achieve a better balance in terms of abnormal- and normal-tissue areas for the pre and post tests, to match the realism of bronchoscopy practice (see Table 7). The number of images was also reduced from 32 to 28 to give more time per image to the subjects. The pre and post-test images were again the same, to evaluate trainees’ progression during the day.
Content of the group 2 test (follow-up test identical to group 1).

Low res, low resolution; High res, high resolution.
Group 2
The 2013 group was similar to 2012 with 18 participants, all thoracic doctors with an experience in bronchoscopy (see Table 4).
Two of them were teaching bronchoscopy and another three of them had already performed NBI, with no more than 15 NBI procedures in their career, so they were all considered NBI novices. The follow-up rate was 100% for the pre and post test, and 44% for the follow-up test (10 have not done the follow-up test). Our Chi-square test with Yates’ continuity correction revealed that the false positive and true positive percentage did not significantly differ between those who have completed the follow-up test and those who have not, so all the answers have been considered together in the results section.
Results for Group 2
They all completed the 28 questions of both tests in 1 hour or less. Between the first test (pre) and the second (post) tests, the group 2 improved in detecting true negative and true positive (25% and 26% class average normalized gain respectively, see Tables 5 and 6).
Between the training day and the follow-up test 4 weeks later, group 2 improved in detecting true negative (+44% class average normalized gain) and worsened in detecting true positive (–13% class average normalized gain). Comparing g and ḡ, we can infer how trainees have progressed [Bao, 2006]: for this group, ḡ is smaller than g for true negative, which means trainees with a low pretest score have larger score improvement than those who had high score in the pretest. But for true negative, ḡ is greater than g, meaning trainees with a low pretest score have a smaller or similar post-test score than the trainees with high pretest score.
If we look at the group 2 general ability to detect normal and abnormal together (total class average normalized gain, based on the total correct and wrong answers), they improve by +32.36% between pre and post test, and +23.24% between post and follow-up test.
Confidence Results for groups 1 and 2
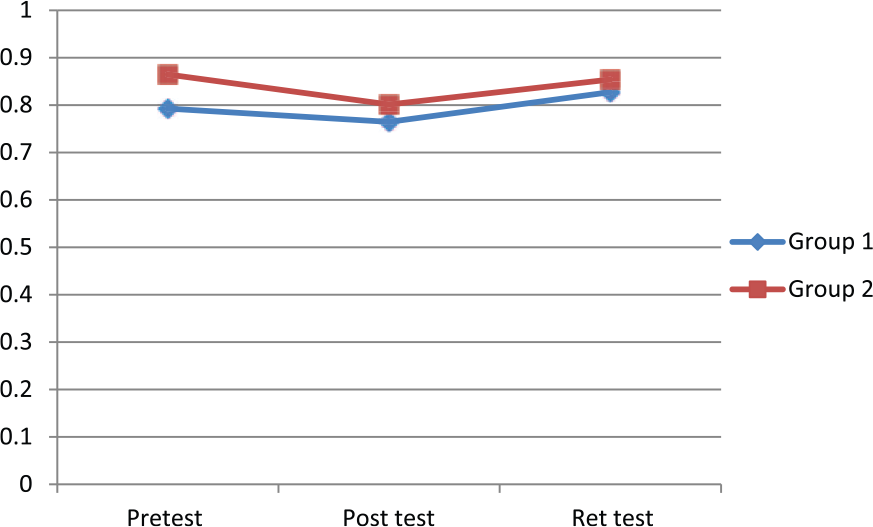
Trainees were almost always less confident than the expert; for 6.36% answers of group 1 and 3.32% for group 2, trainees were more confident than the expert. However, Figure 4 shows the increase of trainees’ confidence between the pre and post test (same-day test with the same photos).

Percentage of confident answers for each test.
Number of answers for groups 1 and 2
The number of answers provided by the trainees for each question is similar between all the tests (1.36 ± 0.12 answers per question).
Anatomy for groups 1 and 2
The trainees were describing each marked area as normal or abnormal, but also as mucosal and submucosal. Detecting mucosal vessels (versus submucosal) is an important factor, as biopsy is usually only performed because of mucosal-vessel abnormalities. As seen on Figure 5, both groups had a good ability to detect mucosal vessels.
Ability to detect anatomy (mucosal/submucosal), in percentage of correct answers.
Discussion for group 2
We have shown that our interactive-testing method can be used to help trainees confirm in a practical way what they have learned during the training about NBI imaging, and can measure their performance improvement. This measurement can be used by the expert trainers to assess the trainees’ proficiency to allow feedback before starting NBI in practice. The global statistics of the tool also help the experts to measure the outcomes of their training sessions. The overall class average normalize gain of 25% was very acceptable and this data is obtainable immediately and automatically. For the pre and post tests, happening during the same day, registrars and consultants learning NBI for the first time can be tested to measure their improvement in detecting abnormal tissues thanks to interactive testing [Bao, 2006; Colt et al. 2011; Hake, 1998]. For NBI practice, true positive as well as true negative skills are both important and our study has shown the ability to derive this type of statistical data.
A number of requirements need to be observed to successfully measure the subjects’ performance:
the availability of high-definition images
a number of images adapted for a 1-hour test
a balance between normal and abnormal areas that reflect what the trainees will experience with patients in the endoscopy room.
The testing method (and tool) can be used to measure the follow up 4 weeks later, but should also be practised on a regular basis as a part of the training, to allow trainees to gain enough confidence and skills to start using NBI in the OR.
We observed the performance between the post and follow-up tests declined for the first and the second groups. For both groups, we experienced a difficulty in having participants to complete the follow-up tests 4 weeks later, even though the test was anonymous. The main reason provided as feedback was that they had not practised or used NBI since the training session.
Conclusion
The overall class average normalized gain of 32% shows Medimq can be used to improve trainees’ competency in analyzing NBI Images during a training course. For valuing the benefits of NBI training, we observed a need to follow and mentor the trainees after the training course, so more of them can become proficient in using new imaging techniques.
A year after the training sessions, half of the trainees accepted to answer an online questionnaire (available at: https://surverymonkey.com/r/nbi2014) about their experience with the Medimq tool. The results shown they found the NBI test very useful: they were extremely likely (9.35/10) to keep training online with the tool, and extremely likely to recommend it to a registrar (8.82/10) or a colleague (8.73/10) in their department.
Footnotes
Acknowledgements
We would like to thanks the Queensland Health Clinical Skills Development Centre for the support they provided during the training session, and Ass/Prof Marcus Watson, his director, for the feedback he provided on Medimq.
Funding
The author(s) disclosed receipt of the following financial support for the research, authorship, and/or publication of this article: This research received no specific grant from any funding agency in the public, commercial, or not-for-profit sectors. The work was supported internally by the CSIRO Preventative Health Flagship.
Conflict of Interest Statement
The author(s) declared no potential conflicts of interest with respect to the research, authorship, and/or publication of this article.