
Abstract
Objectives:
Both autofluorescence imaging bronchoscopy and narrow-band imaging have shown promise in the detection of premalignant airway lesions, each by utilizing different bandwidths of lights for better characterization of the mucosal and submucosal vascular grid. Since previously published meta-analyses have shown poor specificity of autofluorescence imaging bronchoscopy, we specifically studied the diagnostic accuracy of narrow-band imaging alone and in combination with autofluorescence imaging bronchoscopy in the detection of premalignant airway lesions.
Methods:
After an extensive search of eligible studies from PubMed and Medline, extracted data were pooled with weighted averages. Symmetrical summary–receiver operating characteristic curves were constructed to summarize the results quantitatively. Study heterogeneity was assessed by the I2 index.
Results:
Analysis of data from eight studies on narrow-band imaging showed a pooled sensitivity of 0.80 [95% confidence interval (CI): 0.77–0.83] and a pooled specificity of 0.84 (95% CI: 0.81–0.86). Summary–receiver operating characteristic curves from the data on narrow-band imaging calculated an area-under-the-curve of 0.908 (standard error 0.01). The diagnostic odds ratio of narrow-band imaging was 31.49 (95% CI: 12.17–81.45). Data from studies where narrow-band imaging and autofluorescence imaging bronchoscopy were used together showed a pooled sensitivity, specificity, area-under-the-curve and diagnostic odds ratios of 0.86 (95% CI: 0.82–0.89), 0.75 (95% CI: 0.71–0.79), 0.964 (standard error 0.05) and 27.96 (95% CI: 3.04–257.21), respectively.
Conclusions:
Our findings indicate that in the evaluation of premalignant airway lesions, narrow-band imaging has a higher sensitivity, specificity and diagnostic odds ratios compared with autofluorescence imaging bronchoscopy. However, combining autofluorescence imaging bronchoscopy and narrow-band imaging does not significantly improve test performance characteristics.
Introduction
Lung cancer is the leading cause of cancer-related mortality worldwide [Siegel et al. 2012]. The predominant histologic subtype of all lung cancers, especially those arising from the central airways, is the squamous cell carcinoma. In heavy smokers, normal bronchial epithelium is transformed to squamous metaplasia, followed by dysplasia, carcinoma in situ (CIS) and eventually invasive carcinoma [Niklinski et al. 2001; Thiberville et al. 1995]. Studies have shown about 40–83% conversion rate of dysplastic lesions to invasive carcinomas [Band et al. 1986; Risse et al. 1988]. The time span for this conversion could be as short as 4 years [Nakajima and Yasufuku, 2013] to as many as 8 years in some [Breuer et al. 2005]. Despite efforts to improve detection of lung cancer, 5-year survival is still of the order of 17% [Siegel et al. 2012]. Data from the National Lung Screening Trial showed a 20% decrease in lung cancer-related mortality with low-dose computed tomography (CT) screening in a high risk patient population [Aberle et al. 2011]. However, CT scans are not sensitive for detecting microscopic and premalignant airway lesions [Yasufuku, 2010]. Bronchoscopic imaging techniques, such as autofluorescence imaging (AFI) or narrow-band imaging (NBI), have been extensively studied in the detection of premalignant lesions and early lung cancer.
AFI works by taking advantage of the fluorescence properties of normal, preneoplastic and neoplastic tissues that change appearance when illuminated with different wavelengths of light. The fluorescence phenomenon is based on the tissue concentration of substances called fluorophores such as tryptophan, collagen, elastin and porphyrins, which absorb and emit fluorescence when irradiated by a light source [Zaric et al. 2013a]. Alteration of bronchial mucosa leads to altered concentrations of these fluorophores. AFI has undergone significant improvements in its technology. However, many believe that AFI as a standalone imaging modality has poor specificity, and can potentially lead to futile biopsies and long bronchoscopic examination time [Feller-Kopman et al. 2005; Zaric et al. 2013a].
NBI is classified as an image-enhanced endoscopy technology which enables thorough and detailed examination of the submucosal microcapillary grid. It is widely used in gastrointestinal endoscopy for the classification of lesions [Curvers et al. 2008; van den Broek et al. 2008]. By using the light absorption characteristics of hemoglobin, NBI creates enhanced images of blood vessels when the tissue is irradiated with the two narrow wavebands of light. A blue narrow band, wavelength ranging from 390 to 445 nm, is absorbed by surface mucosal layer capillaries and a green narrow band, wavelength between 530 and 550 nm, is absorbed by the deeper submucosal thick blood vessels [Herth et al. 2010]. Recent studies on NBI have shown higher if not equal sensitivity compared with AFI in the detection of premalignant airway lesions [Bojan et al. 2009; Zaric et al. 2012]. Specificity has also been shown to be higher in NBI than AFI [Chen et al. 2013; Herth et al. 2009].
In this study we conducted a meta-analysis of diagnostic test accuracy for all studies on NBI in the detection of premalignant airway lesions.
Materials and methods
Literature search and study selection
A systematic search of the literature was performed in December 2014 to identify all studies that reported information on the diagnostic yield of NBI bronchoscopies in the detection of premalignant airways. We searched Medline and PubMed using the search strategy displayed in Figure 1. We also hand-searched references cited in papers on our initial shortlist. Full text articles of shortlisted abstracts were then independently assessed by the two authors (I.H.I. and A.M.) for inclusion in this meta-analysis. Disagreement on any study selection was to be resolved by consensus. Excluded from selection were review articles, non peer-reviewed papers and conference proceedings/meeting abstracts. The quality of included studies was assessed by the Newcastle–Ottawa Scale (NOS) for cohort studies [Wells et al. 2011].

Search strategy and selection process.
Data extraction
Extracted data included the following items: description of study population (age and gender distribution); number of current or former smokers, final histopathological diagnosis, prevalence of malignancy; and data on diagnostic performance. The latter was abstracted by constructing two-by-two contingency tables for each study, with patients categorized into one of four options: true positive (TP), false positive (FP), false negative (FN) and true negative (TN).
Statistical analysis
Meta-analysis was performed using Meta-DiSc version 1.4. Extracted data were pooled with weighted averages using a random effects model. The weight of each study was proportionate to its sample size. Meta-DiSc was used to pool the data on sensitivity and specificity for each dataset and the results were presented by constructing forest plots. A p value of <0.05 was considered to be statistically significant. Meta-DiSc was also used to construct symmetrical summary receiver operating curves (SROCs), as described by Moses and colleagues [Moses et al. 1993]. From the SROC, the area under the curve (AUC) with standard error (SE) was also calculated. Diagnostic odds ratios (DOR) were also computed but, as no diagnostic threshold exists for histological diagnoses, regression of the log DOR on the measure of diagnostic threshold was not applicable to this meta-analysis. Mathematically, the DOR was defined as:
DOR = [TP/FN] / [FP/TN].
Meta-DiSc was also used to analyze the positive and negative likelihood ratios (+LR and –LR), which were defined mathematically as:
+LR = [TP/TP+FN] / [FP/FP+TN] or, simply, sensitivity/1-specificity
–LR = [FN/TP+FN] / [TN/TN+FN] or, simply, 1-sensitivity/specificity.
Statistical heterogeneity was assessed using the I2 statistic [Higgins et al. 2003].
Results
The study selection process is shown in Figure 1. A total of 11 studies were initially shortlisted from the search. The study by Yamada and colleagues [Yamada et al. 2011] was excluded as this study investigated the subepithelial invasion of cancer in patients already diagnosed with primary lung cancer. The studies by Shibuya and colleagues [Shibuya et al. 2010, 2003] were also excluded as no data on sensitivity or specificity were obtainable from these studies. Therefore, for our meta-analyses of diagnostic accuracy, a total of eight studies [Zaric et al. 2009, 2012, 2013b, 2013c; Herth et al. 2009; Bojan et al. 2009; Vincent et al. 2007; Chen et al. 2013] for NBI were included and analyzed. Four of these studies [Chen et al. 2013; Herth et al. 2009; Zaric et al. 2012, 2013c] were analyzed to determine the diagnostic performance of combined NBI and AFI.
This meta-analysis analyzed data from a total of 632 patients who underwent NBI and 413 patients who underwent both NBI and AFI. The majority of the patients were middle-aged males, who were either current or former smokers. Squamous cell carcinoma was the most prevalent lung cancer in the study population.
Test performance: meta-analysis
Sensitivity and specificity
Analysis of data from eight studies on NBI [Zaric et al. 2009, 2012, 2013b, 2013c; Herth et al. 2009; Bojan et al. 2009; Vincent et al. 2007; Chen et al. 2013] showed a pooled sensitivity of 0.80 [95% confidence interval (CI): 0.77–0.83], I2 93 and a pooled specificity of 0.84 (95% CI: 0.81–0.86), I2 1, respectively, as shown in Figure 2. From the four studies [Chen et al. 2013; Herth et al. 2009; Zaric et al. 2012, 2013c] reporting a combination of AFI and NBI procedures, a pooled sensitivity of 0.86 (95% CI: 0.82–0.89), I2 89.1 and a pooled specificity of 0.75 (95% CI: 0.71–0.79), I2 96.3, respectively, were obtained, as shown in Figure 3.
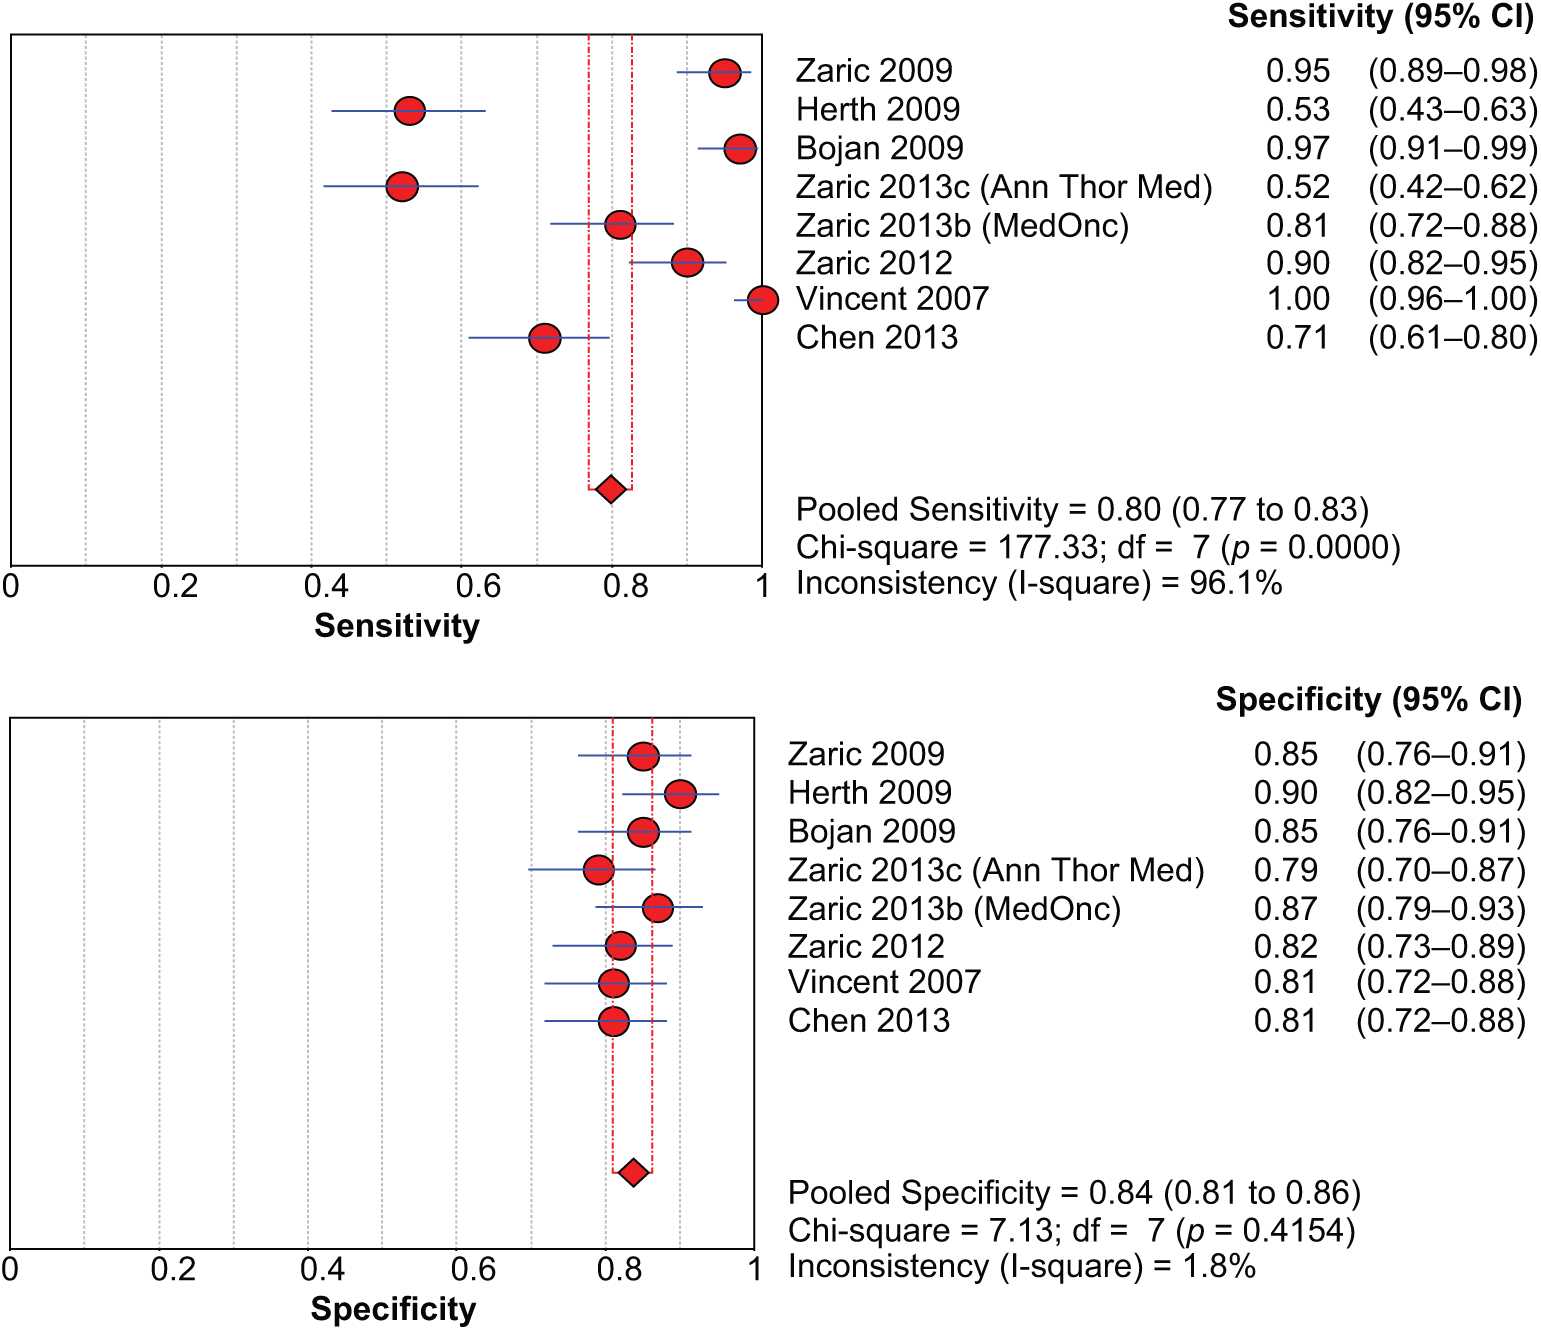
Sensitivity and specificity of narrow band imaging bronchoscopy.

Sensitivity and specificity of combined narrow band imaging and autofluorescence imaging bronchoscopies.
SROC
SROC from the data on NBI [Bojan et al. 2009, Chen et al. 2013, Vincent et al. 2007, Zaric et al. 2009, 2012, 2013b, 2013c] calculated an AUC of 0.908 (SE 0.01), as shown in Figure 4. SROC from the studies [Chen et al. 2013, Herth et al. 2009, Zaric et al. 2012, 2013c] reporting a combination of NBI and AFI procedures showed an AUC of 0.964 (SE 0.05), as shown in Figure 5.

Summary receiver operating curve for narrow band imaging bronchoscopy.

Summary receiver operating curve for combined narrow band imaging and autofluorescence imaging bronchoscopies.
DOR
The DOR from data on NBI [Bojan et al. 2009; Chen et al. 2013; Vincent et al. 2007; Zaric et al. 2009, 2012, 2013b, 2013c] was 31.49 (95% CI: 12.17–81.45). The DOR for procedures where both NBI and AFI were combined [Chen et al. 2013; Herth et al. 2009; Zaric et al. 2012, 2013c] was 27.96 (95% CI: 3.04–257.21).
LR
The +LR and –LR for NBI were 4.81 (95% CI: 3.79–6.10) and 0.17 (95% CI: 0.09–0.34), respectively. For NBI and AFI combined procedures, the +LR and –LR were 4.41 (95% CI: 1.16–16.70) and 0.16 (95%CI: 0.05–0.57), respectively.
Discussion
Narrative and systematic reviews on the diagnostic yield and accuracy of AFI have previously been published [Chen et al. 2011; Sun et al. 2011]. The sensitivity and specificity of AFI in a meta-analysis by Chen and colleagues were 0.90 (95% CI: 0.84–0.93) and 0.56 (95% CI: 0.45–0.66), respectively [Chen et al. 2011]. In another meta-analysis, Sun and colleagues found that the pooled relative sensitivity on a per lesion basis for AFI combined with white light bronchoscopy (WLB) over WLB alone was 2.04 (95% CI: 1.72–2.42) and 1.15 (95% CI: 1.05–1.26), respectively [Sun et al. 2011].
Therefore, while AFI has been very sensitive for detecting premalignant airway lesions, use of this technology is limited by its comparatively lower specificity. The specificity of AFI in combination with WLB was only 65% of WLB alone in the meta-analysis by Sun and colleagues [Sun et al. 2011]. The reason for the low specificity is due to the inability of SFI to differentiate between areas of high blood flow and metabolism, commonly seen in chronic inflammatory conditions such as bronchitis [Nakajima and Yasufuku, 2013]. Raman spectrophotometry shows promise in overcoming this issue of low specificity [Nakajima and Yasufuku, 2013]. Raman spectrophotometry involves exposing tissue to low power laser light and collecting scattered light for spectroscopic analyses, allowing identification of biomolecular changes in histologically pre-malignant and non premalignant lesions [Ohtani et al. 2012]. Use of this technology in a pilot study with AFI and WLB showed a specificity of 91% and sensitivity of 96% [Short et al. 2011]. While AFI continues to be tested with other imaging techniques to improve its diagnostic performance, its utility as a standalone imaging modality is limited due to low specificity.
The results of our meta-analysis, the first of its kind, suggest that NBI significantly increases the sensitivity, specificity and the DOR for the detection of premalignant airway lesions. The DOR for NBI from our meta-analysis was 31.49 (95% CI: 12.17–81.45), significantly higher than the DOR of 11 (range: 8–16) reported by Chen and colleagues [Chen et al. 2011]. However, in our meta-analysis, except for improved sensitivity, other markers of diagnostic performance were not considerably improved with the combination of both NBI and AFI.
Baseline characteristics of studies and study participants.

n, total number of patients studied; N/A, data not attainable from study; SD, standard deviation; WHO, World Health Organization.
In addition to the ability of NBI to detect premalignant airway lesions, another hallmark of NBI is its ability to differentiate between pathological patterns of bronchial submucosal blood vessels, also known as ‘Shibuya’s descriptors’ [Shibuya et al. 2002, 2003, 2010]. Dotted, tortuous and abrupt ending blood vessels – Shibuya’s descriptors – are related to a specific histology of lung cancer. Most studies have found NBI to be useful in differentiating between squamous histology (squamous metaplasia, squamous dysplasia or squamous cell carcinoma) and adenocarcinoma. Earlier studies by Shibuya and colleagues found a significant association between the frequency of dotted vessels found by NBI and pathologically confirmed angiogenic squamous dysplasia (ASD) (p = 0.002) [Shibuya et al. 2003]. Emerging evidence from recent trials, however, suggests that the dotted blood vessels pattern favors mostly adenocarcinoma histology, while the tortuous blood vessels and abrupt-ending vessels pattern favors mostly a squamous histology [Zaric et al. 2013b].
In addition to the Shibuya descriptors, certain other patterns have also been described. In 92 patients with a total of 124 lesions, submucosal patterns were classified as intraepithelial capillary papillary loops (IPCLs), abnormal tumor vessels, extremely increased fine vascular networks, erythema and cobblestone appearance (dotted blood vessels) of mucosa [Miyazu et al. 2007]. IPCLs were indicative of squamous cell cancers and cobblestone appearance of adenocarcinoma [Miyazu et al. 2007].
NBI studies have also shown a strong correlation between the pattern of neovascularization and progression of invasiveness of lesions. Shibuya and colleagues studied capillary blood vessel and tumor vessel diameters with NBI and high-resolution video-bronchoscope and compared them between 11 ASD, 5 CIS, five micro-invasive carcinomas and 10 invasive carcinomas [Shibuya et al. 2010]. Increased vessel growth with complex networks of tortuous vessels of various sizes and only a few dotted vessels were observed with ASD [Shibuya et al. 2010]. While CIS lesions depicted mostly dotted vessels and small spiral or corkscrew-type tumor vessels, micro-invasive and invasive lung cancer lesions exhibited prominent spiral or corkscrew-type tumor vessels of various sizes and grades [Shibuya et al. 2010].
Even though NBI has been mostly studied and used for detection of premalignant lesions, its use has also been extended to assessing extension of centrally located lung cancers. Zaric and colleagues found NBI to reveal greater tumor extension in 19% of enrolled patients with mostly squamous cell cancers [Zaric et al. 2009]. As a result of NBI assessment of tumor extension, the treatment decision in 35% was changed from lobectomy to pneumonectomy, and to conservative treatment from lobectomy in 21% of these patients [Zaric et al. 2009]. Similar results were replicated in another study from Zaric’s group [Bojan et al. 2009].
Our meta-analysis has a few limitations. We did not construct funnel plots for assessing publication bias. This was decided a priori based on the evidence that the unique features of a meta-analysis of diagnostic test accuracy make the application of Begg, Egger and Macaskill tests of funnel plot asymmetry potentially misleading [Deeks et al. 2005]. Furthermore, simulation studies have indicated that the effect of publication bias on meta-analytic estimates of DOR is not likely to be large [Deeks et al. 2005]. Estimates of sensitivity, -LR and DOR for NBI showed high heterogeneity, and the design of this meta-analysis limited us in exploring potential sources of heterogeneity.
It is also pertinent to mention here the possibility of inherent selection bias in the studies included in this meta-analysis. Indications for NBI and/or AFI might have been different in different studies. Perhaps abnormal sputum samples or radiologic findings, or even the need to screen for malignancy in a high risk patient population, might have prompted these procedures – not to mention the investigators’ predilection for one over the other.
Conclusion
The results of our meta-analysis show that the test performance characteristics of NBI (in specific sensitivity, specificity and DOR) are better than AFI in the detection of premalignant airway lesions. Our results also indicate that combining AFI and NBI does not significantly improve test performance characteristics. However, before NBI finds its place in routine screening of early lung cancer, studies are warranted to better characterize the subset of at-risk patients with premalignant airway lesions likely to undergo malignant transformation, given that spontaneous regressions of these lesions have been described [Breuer et al. 2005]. Spontaneous regression aside, lack of a consensus on follow-up surveillance and treatment decision will likely hamper its widespread use for some time. Finally, it remains to be seen how NBI could potentially be utilized in combination with other emerging bronchoscopic imaging techniques such as high magnification bronchovideoscopy [Shibuya et al. 2002], the endocystoscopy system [Neumann et al. 2011] and confocal laser endomicroscopy [Thiberville et al. 2007].
Footnotes
Funding
The author(s) received no financial support for the research, authorship, and/or publication of this article.
Declaration of Conflicting Interests
The author(s) declared no potential conflicts of interest with respect to the research, authorship, and/or publication of this article.