
Abstract
Introduction
Chronic obstructive pulmonary disease (COPD) is a treatable and progressive disease characterized by an airflow limitation that is not fully reversible. Diagnosis is usually confirmed by spirometry, with a postbronchodilator forced expiratory volume in 1 second (FEV1)/forced vital capacity (FVC) ≤0.7 still supporting the presence of COPD [Celli and MacNee, 2004].
In addition to rehabilitation and smoking cessation programs, the current management of COPD patients is mainly carried out by using respiratory drugs, and GOLD guidelines strongly suggest that all stages of COPD should be treated effectively with long-acting bronchodilators (such as ß2-agonists, anticholinergics and methylxanthines) according to a monotherapy or combined strategy [Global Initiative for Chronic Obstructive Lung Disease, 2008].
At present, ß2-agonists (formoterol and salmeterol) and anticholinergics (tiotropium) represent the most effective therapeutic options for treating COPD [Richter et al. 2006]. Tiotropium acts through prolonged M3-receptor blockade, whereas ß2-agonists relax airway smooth muscle by stimulating ß2-adrenergic receptors which increase cyclic adenosine monophosphate and produce functional antagonism to bronchoconstriction [Bateman et al. 2008].
The effects of respiratory drugs on lung function are usually assessed by spirometrical indices, such as FEV1, FVC and FEV1/FVC. In particular, FEV1 is the parameter most frequently used because it is reproducible and highly related to disease progression and mortality in COPD.
A recent review concerning the impact of combined inhaled corticosteroids (ICS)/long-acting ß2-agonists (LABAs) on COPD outcomes confirmed that FEV1 is the parameter which is present in most considered studies [Hanania, 2008]. On the other hand, Bateman and colleagues regarded FEV1 changes from baseline (ΔFEV1) as the primary efficacy endpoint able to compare tiotropium versus an ICS/LABA combination [Bateman et al. 2008], and Tashkin and colleagues used the same parameter to assess the effect of a 4-year treatment with tiotropium in moderate and severe COPD [Tashkin et al. 2008].
Even though spirometric measures are usually employed to quantify airflow limitation in COPD, FEV1 can be insufficient in describing and discriminating the action of different drugs exhaustively in severe and very severe subjects. In particular, a substantial decrease in hyperinflation and breathlessness can be achieved also in the presence of small increases in FEV1, and this particular effect proves more evident in most severe stages of COPD [Celli and MacNee, 2004].
Actually, all effects of respiratory drugs cannot be effectively assessed by using only FEV1 as this parameter is obtained by means of a forced respiratory manoeuvre. It remains unknown whether the quiet breathing pattern at rest could be influenced by respiratory drugs even in the presence of small increases in FEV1. The assessment of quiet breathing pattern could represent a suitable parameter for investigating those possible differences between ß2-agonists and anticholinergics because they are different in terms of pharmacokinetics, mechanism of actions and also, presumably, in terms of site of impact along the airways.
Optoelectronic plethysmography (OEP) represents a novel technology, which provides noninvasive steady-state measurements of chest wall kinematics, together with the assessment of the relative contribution of all different thoracic and abdominal compartments to tidal volume [Cala et al. 1996; Aliverti et al. 2001].
The aim of this pilot study was to investigate the possible changes in quiet breathing due to different long-acting bronchodilators (namely, formoterol and tiotropium) administered to nonreversible moderate-to-very-severe COPD patients in a single inhalation form.
Materials and methods
Patients
The inclusion criteria were as follows:
- suffering from stable COPD, age >60 years, both sexes, nonactive smokers for 5 years;
- prebronchodilator FEV1 less than 60% of the predicted value [Quanjer et al. 1993];
- FEV1 increase (ΔFEV1) after salbutamol (400 µg) less than 12% of the predicted value;
- ratio of prebronchodilator FEV1 to FVC equal to or less than 0.70.
Exclusion criteria were: concomitant use of other bronchodilators; the occurrence of COPD exacerbation during the last 8 weeks and the study period; the presence of musculoskeletal disorders or thoracic dysmorphia affecting the chest wall.
All patients included in the study gave their written informed consent. The study was approved by local ethics review committees and was conducted in accordance with the Declaration of Helsinki and Good Clinical Practice guidelines.
Study design
As the bronchodilation pharmacologically induced in COPD is influenced by severity of the disease and the extent of reversibility in airway obstruction [Bateman et al. 2008], we decided on a crossover trial. All patients received a single inhalation of two long-acting bronchodilators: formoterol (LABA, 24 µg) and tiotropium (long-acting anticholinergic bronchodilator, 18 µg). The order of the treatments was randomized and 36 hours were set as the washout period between treatments.
Experimental setup
In order to evaluate the effects of the bronchodilator, we used the OEP. This recent methodology has been fully described in previous studies [Cala et al. 1996; Aliverti et al. 2001]: in brief, as concerned OEP analysis, 89 retroreflective passive markers were placed on the subject chest wall both on the front and back (Figure 1A). Three-dimensional (3D) marker positions were recorded by an optoelectronic system of eight cameras (OEP System, BTS s.p.a., Milan, Italy). A dedicated software (OEP Analyzer, BTS s.p.a., Milan, Italy) reconstructed the 3D position of each marker and computed the total and compartmental chest wall volumes: the overall chest wall (CW), the pulmonary rib cage (RCp), the abdominal rib cage (RCa), and the abdomen (AB) (Figure 1B).

(A) Position of markers on the front of the body, with highlighted the division of the three compartments. (B) From the 89 retroreflective markers, we obtained the volume exchanged by RCp, RCa and AB compartments.
Three acquisitions were performed for each treatment: acquisition before treatment (BASE), an acquisition after 120 minutes (120min), and the last acquisition after 420 minutes (420min). Each OEP data acquisition was performed for 3 minutes of quiet breathing, with subjects seated on an adjustable stool.
Data processing
An expert operator inspected visually the pattern of CW recorded during each acquisition and selected an interval lasting for 50–80 seconds, able to represent the most stable interval of the recording. The interval was chosen to evaluate subsequent parameters.
As concern the ventilation parameters, for each subject we computed the minute volume (Ve, l/min), the breath frequency (f, breath/min), the tidal volume mean (Vt, l) and the standard deviation normalized to Vt (Vt SD%), the inspiratory flow (V′IN, l/s), and the expiratory flow (V′OUT, l/s).
With regards to the different compartments we computed their partial contribution to Vt (RCp, RCa, AB) and the standard deviation (RCpSD, RCaSD, ABSD).
For each computed parameter we computed the variation in respect to the preceding acquisition:

where T1 = (BASE, 120min) and T2 = (120min, 420min). Thus, we obtained a set of variation indexes able to describe the treatment dynamics between BASE and 120min, and between 120min and 420min.
Statistical analysis
Considering the number of subjects, all statistical analyses were performed using nonparametric tests. Specifically, we used Friedman analysis of variance (ANOVA; p < 0.05) in order to test whether a specific drug introduced statistically significant changes during time. If that was the case the subsequent analysis was performed with Wilcoxon paired test between different acquisition times, with the p-value adjusted with Bonferroni’s correction (p < 0.017). Statistical analysis was applied in order to discover if treatments showed different dynamics between BASE and 120min, and between 120min and 420min: specifically the variations introduced by the different treatments were compared with Wilcoxon paired test (p < 0.05). All data were expressed as median and lower–upper quartiles.
Results
Patients
We recruited 12 patients, but four patients were excluded because they were supplemented with other bronchodilators (three patients: salbutamol 6–10 puffs; one patient: slow release theophylline 900 mg) during the 36-hour washout period: only eight (one female, seven males) were able to successfully complete the study. The main characteristics are reported in Table 1.
Main basal characteristics of analysed patients.
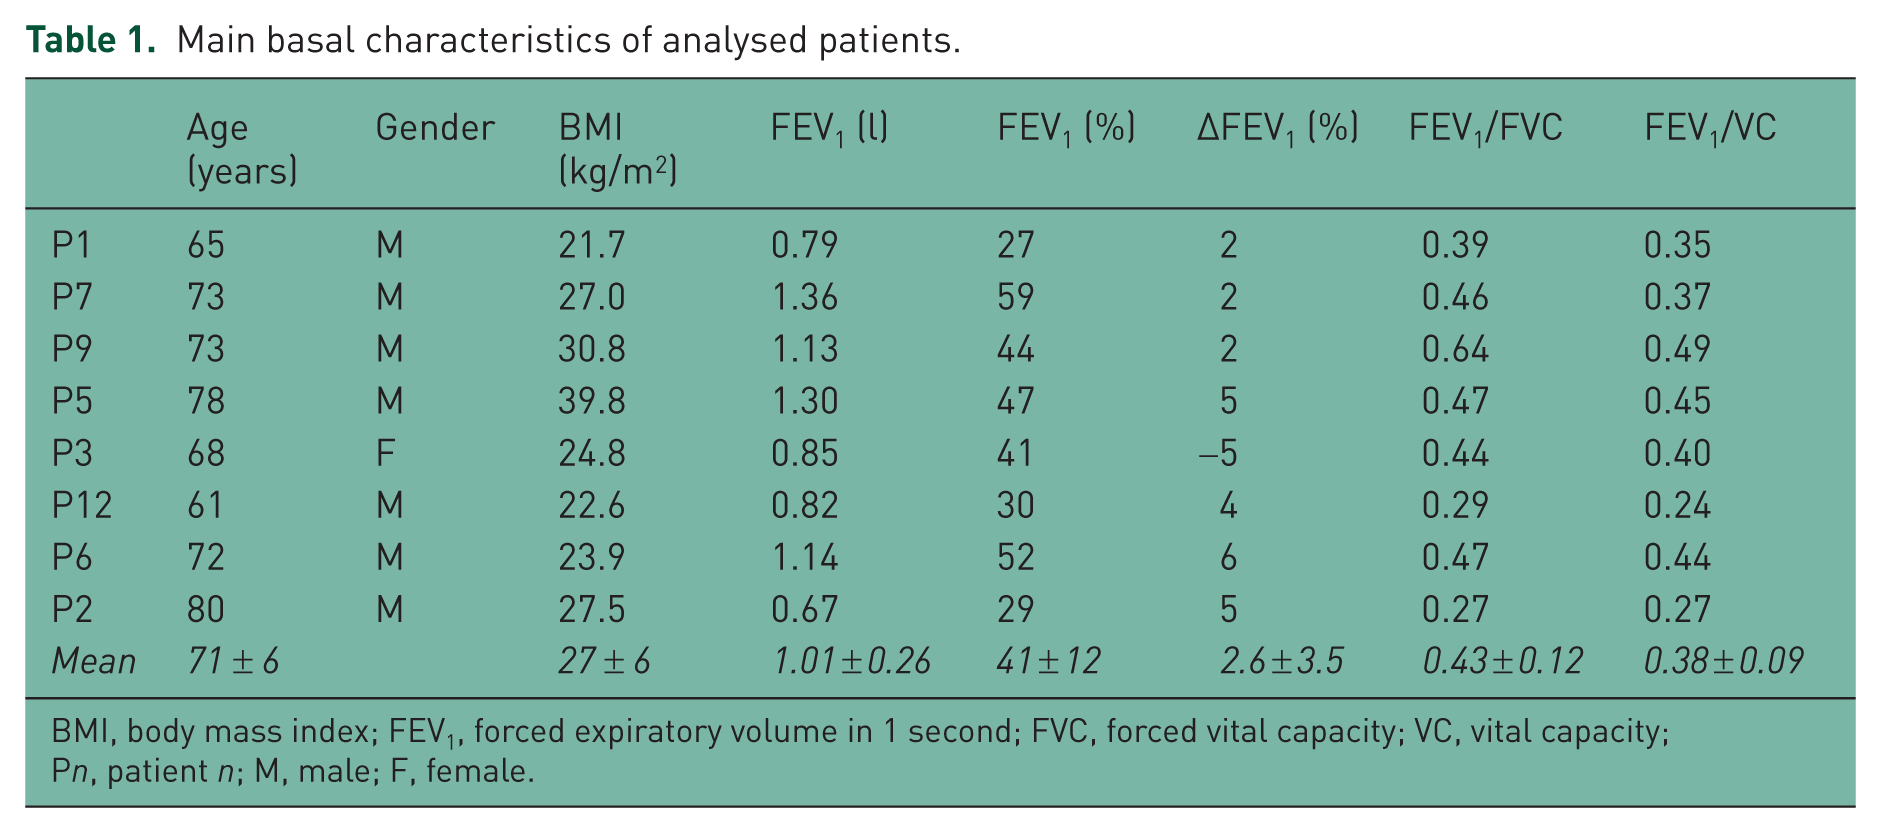
BMI, body mass index; FEV1, forced expiratory volume in 1 second; FVC, forced vital capacity; VC, vital capacity; Pn, patient n; M, male; F, female.
Drug effects during time on chest wall
The effects of each of the long-acting bronchodilators were studied in order to investigate the potential effects on chest wall kinematics in the specific selected patients. As concerned the ventilation parameters (Figure 2), tiotropium caused statistically significant differences in Ve (Friedman ANOVA p = 0.03), which increased between 120min and 420min (Ve (120min) = 9.8 (9.4–11.0) l/min, Ve (420min) = 11.5 (10.2–13.5) l/min, Wilcoxon p = 0.012), and the value at 420min resulted higher than that in BASE (Ve (BASE) = 10.5 (9.4–12.3) l/min, Ve (420min) = 11.5 (10.2–13.5) l/min, Wilcoxon p = 0.036). Conversely, even if formoterol showed positive effects on the ventilation parameters between BASE and 120min, the corresponding increase was not statistically significant (Ve (BASE) = 12.3 (10.0–15.5) l/min, Ve (120min) = 13.7 (11.0–19.0) l/min, Wilcoxon p = 0.12), and was followed by a decrease at 420min.

Left: Ventilation trend over time. Top right: Expiratory flow trend during time. Bottom right: Inspiratory flow during time. *Wilcoxon p < 0.05.
Observed results about expiratory flow were in accordance with changes reported about ventilation (Figure 2): tiotropium induced statistically significant differences (Friedman ANOVA p = 0.03), showing once again the main increase between 120min and 420min (V′OUT (120min) = 0.3 (0.2–0.3) l/s, V′OUT (420min) = 0.3 (0.3–0.4) l/s, Wilcoxon p = 0.012), while formoterol showed a not statistically significant increase between the BASE and 120min (V′OUT (BASE) = 0.3 (0.3–0.4) l/s, V′OUT (120min) = 0.3 (0.3–0.5) l/s, Wilcoxon p = 0.16), which was followed by a decrease at 420min.
As concerning the inspiratory flow (Figure 2), tiotropium showed an increase between 120min and 420min (V′IN (120min) = 0.5 (0.4–0.6) l/s, V′IN (420min) = 0.5 (0.5–0.7) l/s, Wilcoxon p = 0.036), but it was not confirmed by Friedman ANOVA (p = 0.41). Conversely formoterol showed statistically significant differences in inspiratory flow (Friedman ANOVA p = 0.03), which exhibited an increase between BASE and 120min (V′IN (BASE) = 0.5 (0.5–0.7) l/s, V′IN (120min) = 0.6 (0.6–0.8) l/s, Wilcoxon p = 0.012).
As concerning tiotropium, together with statistically significant results we observed concordant trends among other parameters: the increase of Vt (Vt (BASE) = 0.56 (0.45–0.66) l, Vt (120min) = 0.54 (0.40–0.66) l, Vt (420min) = 0.64 (0.49–0.72) l), and the related decrease of Vt SD% (Vt SD% (BASE) = 14.5 (13.6–19.8), Vt SD% (120min) = 15.6 (12.4–16.7), Vt SD% (420min) = 12.5 (9.6–15.1)). Likewise for formoterol, an increase at 120min (although not significant), was observed in many parameters, which was followed by a decrease at 420min.
Drug effects during time on chest wall compartments
The observed behaviour of different compartments was in accordance with main results found for the chest wall: formoterol introduced main changes between BASE and 120min, while tiotropium mainly induced changes between 120min and 420min. As shown in Figure 3, the partial contribution of RCp, RCa and AB was similar between drug sessions (tiotropium and formoterol), and was not influenced by bronchodilators. The only statistically significant variation was about the increase of the contribution of RCa induced by formoterol (Friedman ANOVA p = 0.02), specifically between BASE and 420min (RCa (BASE) = 10.3% (7.8–10.9%); RCa (420min) = 12.5% (8.7–14.5%), Wilcoxon p = 0.036).

Vt contribution (as a percentage of Vt) of chest wall compartments (RCp: no textures; RCa: diagonal line texture, AB: dotted texture), during different acquisitions and different drugs (left: formoterol; right: tiotropium).
Conversely, when the pattern of different compartments was investigated by the analysis of standard deviation, tiotropium showed a reduction in the variability of all compartments’ contributions (Figure 4), statistically significant about RCaSD (Friedman ANOVA p = 0.03). It was clearly shown by the visual analysis of volume curves of compartments, which not only showed a smaller standard deviation, but also a smoother mean curve, thus confirming the higher repeatability of each breath after the administration of the bronchodilator (Figure 4).
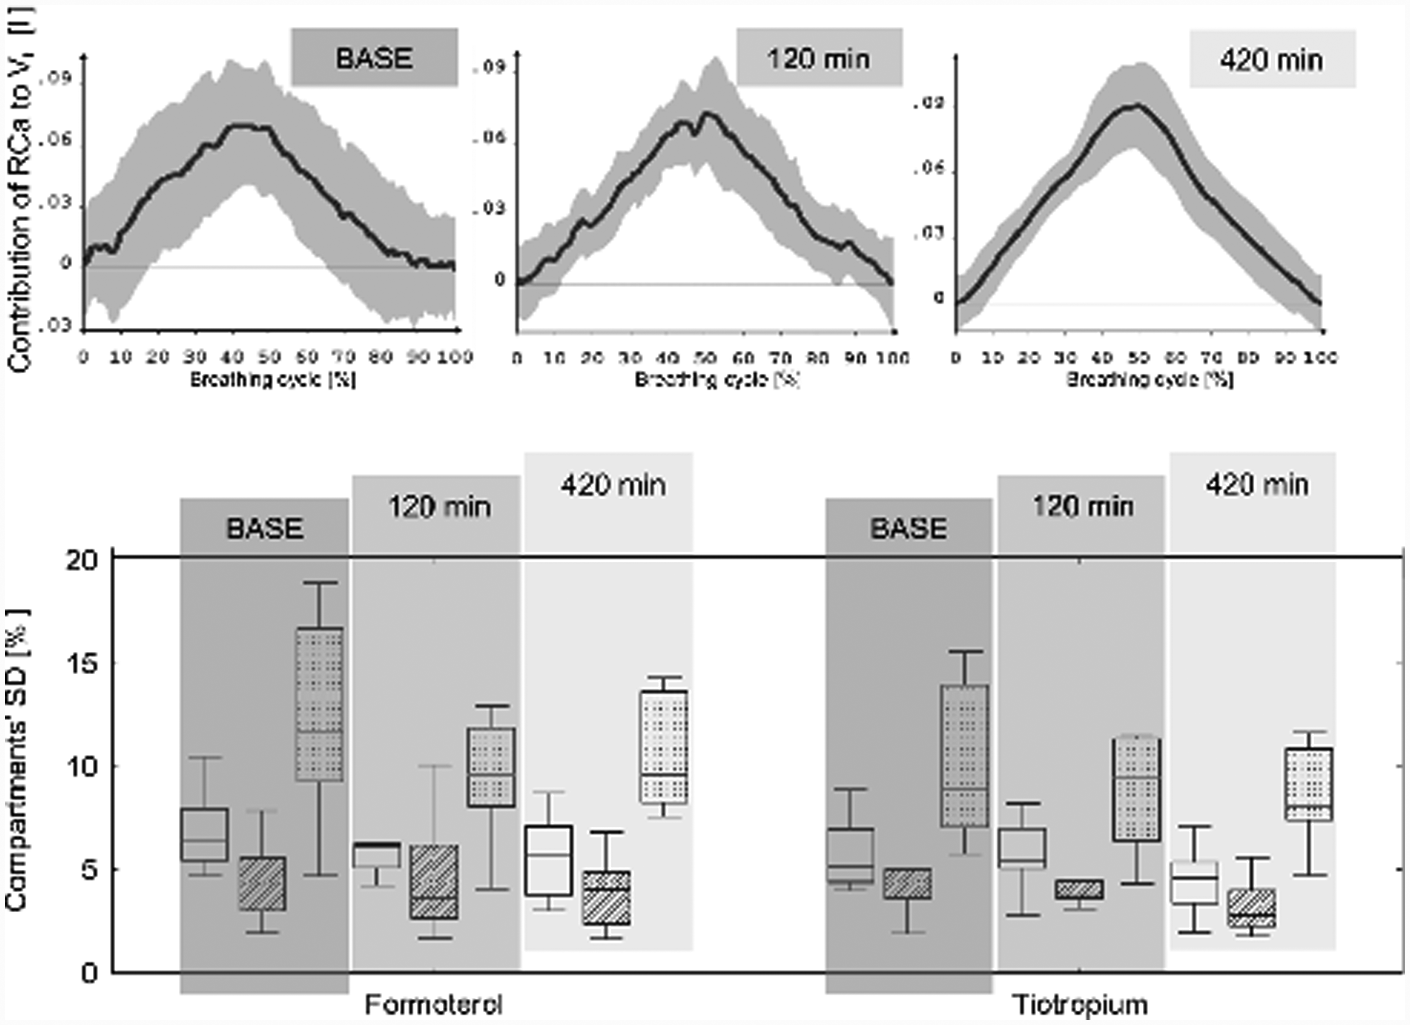
Top: Volume pattern of RCa compartment during breathing cycle, after the administration of tiotropiumml: it is clear the reduction of SD (grey) and the smoother profile of mean volume (dark grey). Bottomml: Standard deviation of chest wall compartments (RCpSD: no textures; RCaSD: diagonal line texture; ABSD: dotted texture) during different acquisitions and different bronchodilators (left: formoterol; right: tiotropium)
Differences between bronchodilators: the first 2 and last 4 hours.
The statistically significant changes introduced by both bronchodilators on chest wall kinematics led us to investigate whether there were some differences between drugs. Since the main differences where in terms of timing, we compared the increases or decreases caused by each bronchodilator on each time interval (BASE–120min and 120min–420min). We found that formoterol provided an increment of about 15% on many parameters during the first 2 hours (Figure 5). Conversely, tiotropium showed a less homogeneous trend (Figure 5). Even if the different behaviour was clearly visible in terms of medians, we did not find statistically significant differences between the variations introduced by drugs, except for Ve (tiotropium (120min–BASE) = +1%, formoterol (120min–BASE) = +13%, p = 0.049).

Comparison between the variations introduced by two different bronchodilators on Ve, Vt, V′IN and V′OUT during the first 2 hours after the administration.
Conversely the behaviour lasting for the last 5 hours (between 120min and 420min) showed many ventilation parameters influenced by the treatment (Figure 6): Ve (tiotropium (420min–120min) = +20%, formoterol (420min–120min) = −2%, p = 0.017), Vt (tiotropium (420min–120min) = +13%, formoterol (420min–120min) = −11%, p = 0.035), V′IN (tiotropium (420min–120min) = +11%, formoterol (420min–120min) = −9%, p = 0.012) and V′OUT (tiotropium (420min–120min) = +20%, formoterol (420min–120min) = 1%, p = 0.049).

Comparison between the variations introduced by two different bronchodilators on Ve, Vt, V′IN and V′OUT between 420min and 120min. *Wilcoxon p < 0.05.
Discussion
GOLD guidelines suggest that all stages of COPD should be treated with bronchodilating agents including ß2-agonists and anticholinergics [Global Initiative for Chronic Obstructive Lung Disease, 2008], even though the recommendation of one class over the other is still debated.
Recent studies still regard spirometric volumes and flows as the main quantitative parameters to take into account in order to assess the efficacy of respiratory drugs [Richter et al. 2006; Tashkin et al. 2008; Cazzola et al. 2005] despite different outcomes having been reported in other studies in recent years. Actually, in addition to spirometrical lung function measurements, the effects of treatments on frequency and severity of exacerbations, health status, quality of life and dyspnoea have also been considered and quantified [Hanania, 2008; Tashkin et al. 2008].
Only a very few studies used OEP in order to investigate lung function in COPD: recently, Bianchi and colleagues investigated the pattern of the chest wall kinematics during pursued-lip breathing in COPD at rest [Bianchi et al. 2007], while in 2005 Aliverti and colleagues investigated only the short-term effects of salbutamol in stable COPD [Aliverti et al. 2005].
The need to better investigate the effects of drugs on lung function also in nonreversible COPD patients of different severity led us to evaluate changes in quiet breathing pattern possibly induced by two different LABAs in these kinds of subjects. We decided to focus on quiet breathing because it represents the most ‘natural’ respiratory movement which is daily performed more than 1000 times per hour and is independent of forced inspiratory and expiratory manoeuvres.
The main and novel result of the present study is that single inhalations of both bronchodilators induce detectable and significant changes of quiet breathing pattern in moderate-to-very-severe COPD patients who previously proved spirometrically irreversible to salbutamol (Table 1). This result is very interesting even considering that the effect of tiotropium on lung volumes (i.e. FVC) needs more days of treatment, so it is possible that the present single inhalation study can underestimate the real effect of this drug. However, the kinetic of effect of each experimental drug on quiet breathing proves similar to that of FEV1 [Richter et al. 2006; Cazzola et al. 2005]: our results are generally confirming that the tiotropium maximum effect is in the range 120–420 min, while formoterol proves its maximum effect in the range 0–120 min.
Moreover, tiotropium induces a more regular breathing pattern in the last 5 hours of the monitoring period by acting on the RCa compartment, that is, the chest wall zone opposed to the diaphragmml: the statistically significant results obtained on RCa (namely, the diminished RCaSD) seem the main drive of the trend shown by Vt SD%. The regularization of breathing pattern (namely, the diminished Vt SD%) is parallel to the increase of expiratory flow (V′OUT), which on the other hand is likely related to the increase in Ve. The latter is also influenced by the increased Vt. The picture we obtain is that the assumption of tiotropium allows patients to breath more regularly at rest and the onset of this peculiar effect is particularly evident on long term. While Cazzola and colleagues reported that FEV1 is increased after 2 hours and its maximum increase occurs after 3 hours [Cazzola et al. 2005], we obtained significant changes in breathing pattern with tiotropium only between 2 and 7 hours of monitoring.
On the other hand, formoterol shows a different behaviour, which is characterized by its main effect on inspiratory flow (V′IN): it shows its maximum increase after 120 min, but confirms to decline in the last 5 hours of monitoring. Other effects (such as those on Ve, V′IN, Vt and Vt SD%) observed during the first 2 hours of monitoring proved not to be statistically significant. In other words, it can be suggested that formoterol is able to induce significant changes on quiet breathing only in the first 2 hours: even if not statistically significant, all ventilation parameters tend to decrease in the last 5 hours. These results are only partially in agreement with previous studies oriented to assess FEV1 changes over time: while the time course of maximum changes in quiet breathing and in FEV1 are phased (after 120 min), the long-term effects have a shorter duration in terms of effects on quiet breathing than in FEV1 effects with formoterol [Cazzola et al. 2005].
Present results regarding the comparison between treatments confirm the kinetics known for each drug. Furthermore, even though formoterol changed all parameters of quiet breathing by 15% in the first 2 hours, these changes were not statistically different from those obtained with tiotropium in the same experimental period except for Ve. Conversely, in the last 5 hours of monitoring (that is, between 120min and 420min), opposite trends of effect became evident between the two drugs, and the trend of tiotropium effects on Vt, Ve, V′IN, and V′OUT (namely, increasing) was significantly different from that of formoterol (namely, decreasing).
In general, we presume that both bronchodilators can induce small changes in airway patency also in patients in whom the extent of their FEV1 reversibility was actually negligible. We are also suggesting that these changes, which likely are unevenly distributed along the airways, can affect the distribution of ventilation, and that this effect is mirrored by the changes obtained in their ventilation pattern.
A substantial source of discrepancy between data concerning changes induced in FEV1 and quiet breathing pattern by means of long-acting bronchodilators can be suggested as depending of the manoeuvres to perform per se. Actually, spirometry requires several tools (e.g. the mouthpieces or face masks, and the nose clips) which can affect the patient’s steady state, awareness, anxiety and breathing pattern. In contrast, OEP, which is also completely noninvasive, allows prolonged recordings and does not require any connection to the patient whose thoracic movements are absolutely spontaneous and his steady-state results completely preserved [Cala et al. 1996; Aliverti et al. 2001].
Conclusions
Present pilot results concerning the effects of long-acting bronchodilators on quiet breathing pattern in moderate-to-very-severe COPD patients lead to the following conclusions: (a) even in the presence of a severe nonreversible flow limitation, significant functional changes due to long-acting bronchodilators are detectable via OEP, and their therapeutic role is thus further confirmed in these conditions; (b) in spirometrically nonreversible COPD subjects, OEP can help in discriminating the therapeutic effects of different bronchodilators; (c) OEP can represent a novel model for integrating the investigational approach to airway reversibility in moderate-to-very severe COPD; (d) in these cases, tiotropium, much more than formoterol, proves able to induce the stabilization of quiet breathing by decreasing the variability of the contribution of different chest wall compartments, in particular of that of the abdominal rib cage.
Data of the present study need further confirmation on larger samples of nonreversible COPD individuals.
Footnotes
Acknowledgements
The authors would like to thank BTS s.p.a. for their valuable contribution in technical support.
This research received no specific grant from any funding agency in the public, commercial, or not-for-profit sectors.
The authors declare no conflicts of interest in preparing this article.