
Abstract
The formation of neutrophil extracellular traps (NETs) is known as an important part of the innate immune response. Still, some mechanisms regarding their formation and role during a disease are not completely understood yet. To visualize NETs by immunofluorescence microscopy, a chemical fixation is required. Therefore, this study focused on the effect of chemical fixatives on immunofluorescence staining of selected neutrophil and NET-markers, including myeloperoxidase (MPO), DNA/histone-1-complexes and citrullinated histone H3 (H3cit). Neutrophils isolated from fresh human blood were stimulated with phorbol-12-myristate 13-acetate (PMA) to induce NETs and fixed with paraformaldehyde (PFA, 4%), glutardialdehyde (GA, 5%) or methanol (MeOH, 100%) using different incubation times depending on the used fixative. We found that different fixation times with PFA had no effect on the staining intensity of MPO or DNA/histone-1-complex antibodies. For the staining of H3cit, fixation with PFA for 24 h decreased the signal intensity whereas 30 min fixation time had no effect. In contrast, glutardialdehyde induced a high amount of autofluorescence, and the fixation with 100% MeOH resulted in visible cellular damage. Therefore, we recommend 15–30 min PFA fixation for the respective stainings. Our results provide a solid basis for future experiments to study neutrophil activation and NET-formation.
Introduction
Neutrophils are immune cells belonging to the polymorphonuclear leukocytes (PMNs) that account for about 50–70% of the white blood cells in the human peripheral blood.1,2 As a part of the innate immune response of the host defense mechanisms, neutrophils inherit various strategies to combat pathogens. 2 Antimicrobial strategies include phagocytosis, degranulation coupled with the release of lytic enzymes, as well as the ability to produce reactive oxygen species (ROS) with immunomodulatory potential.3,4 In 2004, Brinkmann et al. firstly described the formation of extracellular traps (NETs) by neutrophils. NETs consist of decondensed chromatin that form a web-like structure and are associated with histones, antimicrobial peptides and proteins e.g., myeloperoxidase (MPO) that entrap and neutralize pathogens. 5 Since oxidative burst is involved in the process of NET-formation, neutrophils can also be artificially stimulated in vitro by phorbol-12-myristate-13-acetate (PMA) in a ROS/NADPH oxidase dependent manner.2,6 The treatment with PMA leads to translocation of enzyme-containing granules, such as MPO, into the nucleus. In the nucleus, chromatin is decondensed and histones are citrullinated and degraded by a complex enzymatic interplay.2,6,7 The nucleic compounds mix with the granular proteins and this assembly is released into the extracellular space via perforation of the plasma membrane, finally leading to the process of NET-formation called NETosis.8,9 Studies using different stimuli to induce NETosis or blocking certain pathways indicate complex cell-intrinsic interactions of different factors, which are still not completely understood.10,11 Thus, more intense studies about the role of NET formation in health and diseases are still needed.
For microscopic visualization of NET-associated markers using immunofluorescence staining, prior fixation of samples is required. Since mechanical and thermal fixation preclude further histological use, we analyzed the most commonly used chemical fixatives formaldehyde (here used in the form of paraformaldehyde, PFA), glutardialdehyde (GA) and methanol (MeOH). Formaldehyde and GA cause structural changes among proteins present in the specimen. Formaldehyde reacts with the side chains of amino acids by forming reactive hydroxymethyl groups in a process called cross-linking. 12 It can penetrate nuclear proteins and nucleic acids and modifies their nucleotides by reacting with free amino groups.12,13
GA-fixed tissue is more extensively cross-linked than samples fixed with formaldehyde. 14 However, it may occur that not all aldehyde groups react, and subsequently free groups may cause undesirable background staining in methods such as the Periodic acid-Schiff (PAS) reaction. 15 Although extensive cross-linking during fixation with GA adversely affects immunohistochemical staining, the chemical provides excellent preservation of cellular ultrastructures. 16 Therefore, GA is especially recommended as fixative for electron microscopic examination. 13,17
In contrast, MeOH fixation is based on protein denaturation and thereby displacing water from the tissue, which interferes with hydrogen bonds and hydrophobic bonds. Internal hydrophobic groups of the amino acids are released, resulting in changes in the tertiary structure of the protein and its solubility. 18 MeOH is a common fixative for blood smears and cell culture.
Accordingly, the chemicals used for fixation generally affect the binding possibilities of various antibodies by structural modification or masking of epitopes.
For the visualization of NET-formation by immunofluorscence microscopy after fixation of activated neutrophils, most often a combination of DNA intercalating dyes (e.g., DAPI, Hoechst) with specific antibodies for NET-associated granular proteins (e.g., MPO, neutrophil elastase), DNA/histone-1-complexes or citrullinated histones (H3cit) is used. 19 As a drawback, staining intensity and quality of NET-associated markers vary between different labs, especially when NETs are quantified. 19 Therefore, we investigated the effect of three different chemical fixatives (PFA, GA or MeOH) and different incubation times on the efficiency of antibody staining (anti-MPO, anti-DNA/histone-1-complexes or anti-H3cit) on the visualization of NET-associated markers with immunofluorescence laser scanning confocal microscopy.
Materials and methods
Isolation and culturing of human neutrophils
Primary neutrophils were harvested from fresh human blood of voluntary, healthy donors as previously described. 19 The study was approved by the ethical committee of Hannover Medical School No: 3295-2016. In total, at least three independent experiments with three different blood donors were performed for each experiment. For the acquisition of the neutrophils, the blood samples were collected in heparin tubes (Sarstedt; 02.1065) and stored for not longer than 30 min until further processing. Neutrophils were separated using a density gradient. Therefore, 7 mL of blood were layered onto 7 mL of Polymorphprep (Progen; 114683) and then centrifuged for 30 min at 480 x g and 21°C without using a brake. Neutrophils were transferred to a fresh 50 mL tube and diluted with 40 mL sterile, lipopolysaccharide (LPS)-free phosphate-buffered saline (PBS; 1x) (Sigma-Aldrich; P5493-1 l). After centrifugation, the supernatant was discarded. Remaining erythrocytes were lyzed by LPS-free distilled water (Roth; 3225.1) for a few seconds, followed by addition of LPS-free PBS to counteract the osmotic pressure. After centrifugation, remaining neutrophils were resuspended in RPMI medium without phenol red (Gibco; 11835-063) at room temperature. Neutrophils were seeded with a density of 2 × 10⁵ cells per well in 48-well suspension plates (Greiner Bio One Cellstar; 677102) on 8 mm cover slips (VWR; MENZCB00080RA120) which were coated with 60 µl 0.01% poly-L-lysin (Sigma-Aldrich; P4707) on the day of the experiment. Cells in RPMI medium served as unstimulated negative control. Phorbol 12-myristate 13-acetate (PMA) (Sigma-Aldrich; 524400) with a concentration of 25 nM was added as NET inducer. Cells were incubated at 37°C and 5% CO2 for 2 h and afterwards fixed as described below.
Fixation of cells
After the incubation, the supernatant was removed and the cells were fixed with the pre-diluted fixatives as stated in Table 1: 100% MeOH (Roth; 4627.4, room temperature (RT) or ice cold stored at −20°C) was used undiluted, 16% PFA (EMS; 15710-250) was diluted in PBS to a 4% solution and the 25% GA (Roth; 4157.1) in 2% sodiumcacodylat (SERVA Electrophoresis GmbH, 15540) buffer to a final concentration of 5%. During the incubation time, the plates were kept at room temperature, closed with a lid and sealed with parafilm to prevent desiccation, if the incubation time exceeded the 30 min. MeOH was only used for 30 min fixation time, but differed in temperature (Table 1). The incubation times for fixations with GA were chosen as 24 h and 5 days. For PFA fixation various incubation times were tested as indicated in the Table 1. Subsequently, the plates were washed three times with 200 µl 1x PBS and stored at 4°C until further processing for immunofluorescence staining.
Fixative agents, concentration, temperatures and incubation times used for staining of neutrophil extracellular traps (NETs)-markers.

Immunofluorescence staining and laser scanning confocal microscopy
All wells were washed with 1 x PBS and cells permeabilized for five minutes with 0.5% Triton X-100 (Sigma-Aldrich; T8787) previously diluted in PBS and blocked for 20 min. The blocking buffer was prepared using 3% donkey serum (Biozol; SBA-0030-01), 3% cold water fish gelatine (Sigma-Aldrich; G7041-100G), 1% bovine serum albumin (BSA) (Roth; 1ETA.2) and 0.05% Tween 20 (Sigma-Aldrich; P1379-100 mL) previously diluted in PBS. The supernatant was removed and cells were incubated with the primary antibodies diluted in blocking buffer for 1 h as indicated in Table 2. After washing with 1x PBS three times, the mixture for the fluorophore conjugated secondary antibody consisted of goat anti-mouse (Alexa Fluor 488 plus Therrmo Fisher; 2 mg/mL; 1:500) + goat anti-rabbit (Alexa Fluor 633 Thermo Fisher; 2 mg/mL; 1:500). The concentration of all antibodies applied was calculated using the respective dilution factors mentioned. After the one hour of incubation at room temperature in the dark and washing with 1x PBS three times, the coverslips were transferred from the well plate to a microscope slide (Roth; H868.1) in 2 µl of ProLongTM Gold antifade reagent with DAPI (Invitrogen; P36931). The samples were kept at 4°C for maximum of seven days or until microscopic analysis.
Antibody preparations used for staining of neutrophil extracellular traps (NETs)-markers. *(n.i. = no information).

Images were acquired using a confocal laser scanning microscope (Leica TCS SP5 AOBS) with an HCX PL APO 40x 0.75-1.25 oil immersion objective and Leica Application Suite (LAS) software (version 2.7.3 9723). The pinhole was set to 87.51 µm. The isotype control sample after PFA fixation for 24 h was chosen to set the gain and offset for all microscope settings of each experiment, which were kept constant throughout all imaging processes. The lasers of choice were the argon laser (maximum excitation 488 nm), the helium-neon laser (maximum excitation 633 nm) and the diode laser (maximum excitation 405 nm) at 30 % power. To avoid collection of overlapping signal, the scanning was performed sequentially with the following collector settings: 417 nm −479 nm (diode laser); 500 nm–550 nm (argon laser); 639 nm–706 nm (helium-neon laser). Each sample was randomly screened to acquire six images per sample for later evaluation of the mean fluorescence intensity using the software ImageJ (Version 1.8.0_172). The mean grey value of each channel was measured by dividing the sum of all pixel values by the total of all pixels. The mean grey value of the red/green channel of every image was divided by the blue channel of the particular image and multiplied by 100 to get the percentage of mean fluorescence intensity calculated relative to the blue fluorescence intensity (DAPI). As additional control experiment, a setup was included without antibody staining (without isotype control antibody or secondary antibody treatment) to characterize potential auto-fluorescence signal of cells fixed with GA compared to PFA (Figure 7) and MeOH (Supplementary Figure 1).

Effect of different incubation times with 4 % paraformaldehyde (PFA) on the intensity of antibody-staining against DNA/histone-1-complexes. Depicted are the mean values and the standard deviation of the data. The percentage mean of the green fluorescence intensity was calculated in relation to the intensity of the blue channel (DAPI-stained nucleus DNA). Statistical comparison was done using a one-way ANOVA comparing isotype control staining (Iso) with respective non-stimulated neutrophils (Ctr) or PMA-stimulated neutrophils (PMA) stained with the antibody against DNA/histone-1-complexes (n = 15–36 of three independent experiments with different blood donors). The data suggest that the chosen DNA/-histone-1-complex antibody is able to consistently provide very effective staining results for cells fixed with PFA, even for extended incubation periods of up to five days. Information about the exact p-values can be obtained from Table 3. Exemplary micrographs of the respective staining are shown with size bar 100 µm. The brightness of all images was increased by 20%.
Diff-Quick staining and evaluation of cells fixed with methanol
To further investigate the effect of MeOH-fixation on cellular integrity, neutrophils were isolated and stimulated with PMA. For this, the previously described experimental setup was recreated and the same reagents used. Fixative agents used were MeOH (room temperature), ice cold MeOH (−20 °C) and PFA as control. Neutrophils were incubated with MeOH for 30 min and with PFA for 15 min. Subsequently, the fixatives were rinsed with PBS three times and cellular components stained using a Diff-Quick solution kit (LT-SYS; LT 001). The kit consists of three solutions: a fixing solution containing MeOH, a Haema 1 and a Haema 2 staining solution. The samples were dipped into the staining solutions five times for one second. The fixation step was omitted. Afterwards the samples were washed in distilled water using the same technique and the excess water dried off for a few seconds before placing the sample on a drop (∼5 µl) of mounting medium (Carl Roth, RotiR-Mount; HP68.1) onto a glass slide.
For the visual evaluation, the cells were observed using a ZeissTM Imager.M2 microscope through a 63 × 1.4 oil objective and the respective immersion oil (Carl ZeissTM; 10539438). Pictures were taken with the Axiocam 105 (ZeissTM).
Statistical analysis
The mean intensity in microscopic pictures was determined with the software ImageJ (Version 1.8.0_172). The scale was set for 13213 pixels/µm (Distance in pixels: 512; Known distance: 387.5; Unit: µm) and the mean gray value of each channel was measured by dividing the sum of all pixel values by the total of all pixels using Excel (Microsoft). Statistical analysis was conducted with GraphPad Prism 9.0.0 (GraphPad Software, San Diego, CA, USA), and the statistical test of choice was an ordinary one-way analysis of variance (ANOVA) with multiple comparisons and ROUT's outlier test. For the described analysis, all data from all experiments (a minimum of three independent experiments with different blood donors) were handled as individual data points and not conjoined into the mean of a respective experiment. The data in all figures are presented as mean and standard deviation (SD). Further details are described in the figure legends.
Results
Effect of paraformaldehyde (PFA) on staining intensity to visualize neutrophils and NETs
The effect of different incubation times with 4% PFA as a fixative was tested on the intensity of antibody staining to visualize unstimulated neutrophils (Ctr) and NETs after stimulation of neutrophils with PMA using the following three antibodies: anti-DNA/histone-1-complexes, anti-MPO or anti-H3cit (Figures 1–3).
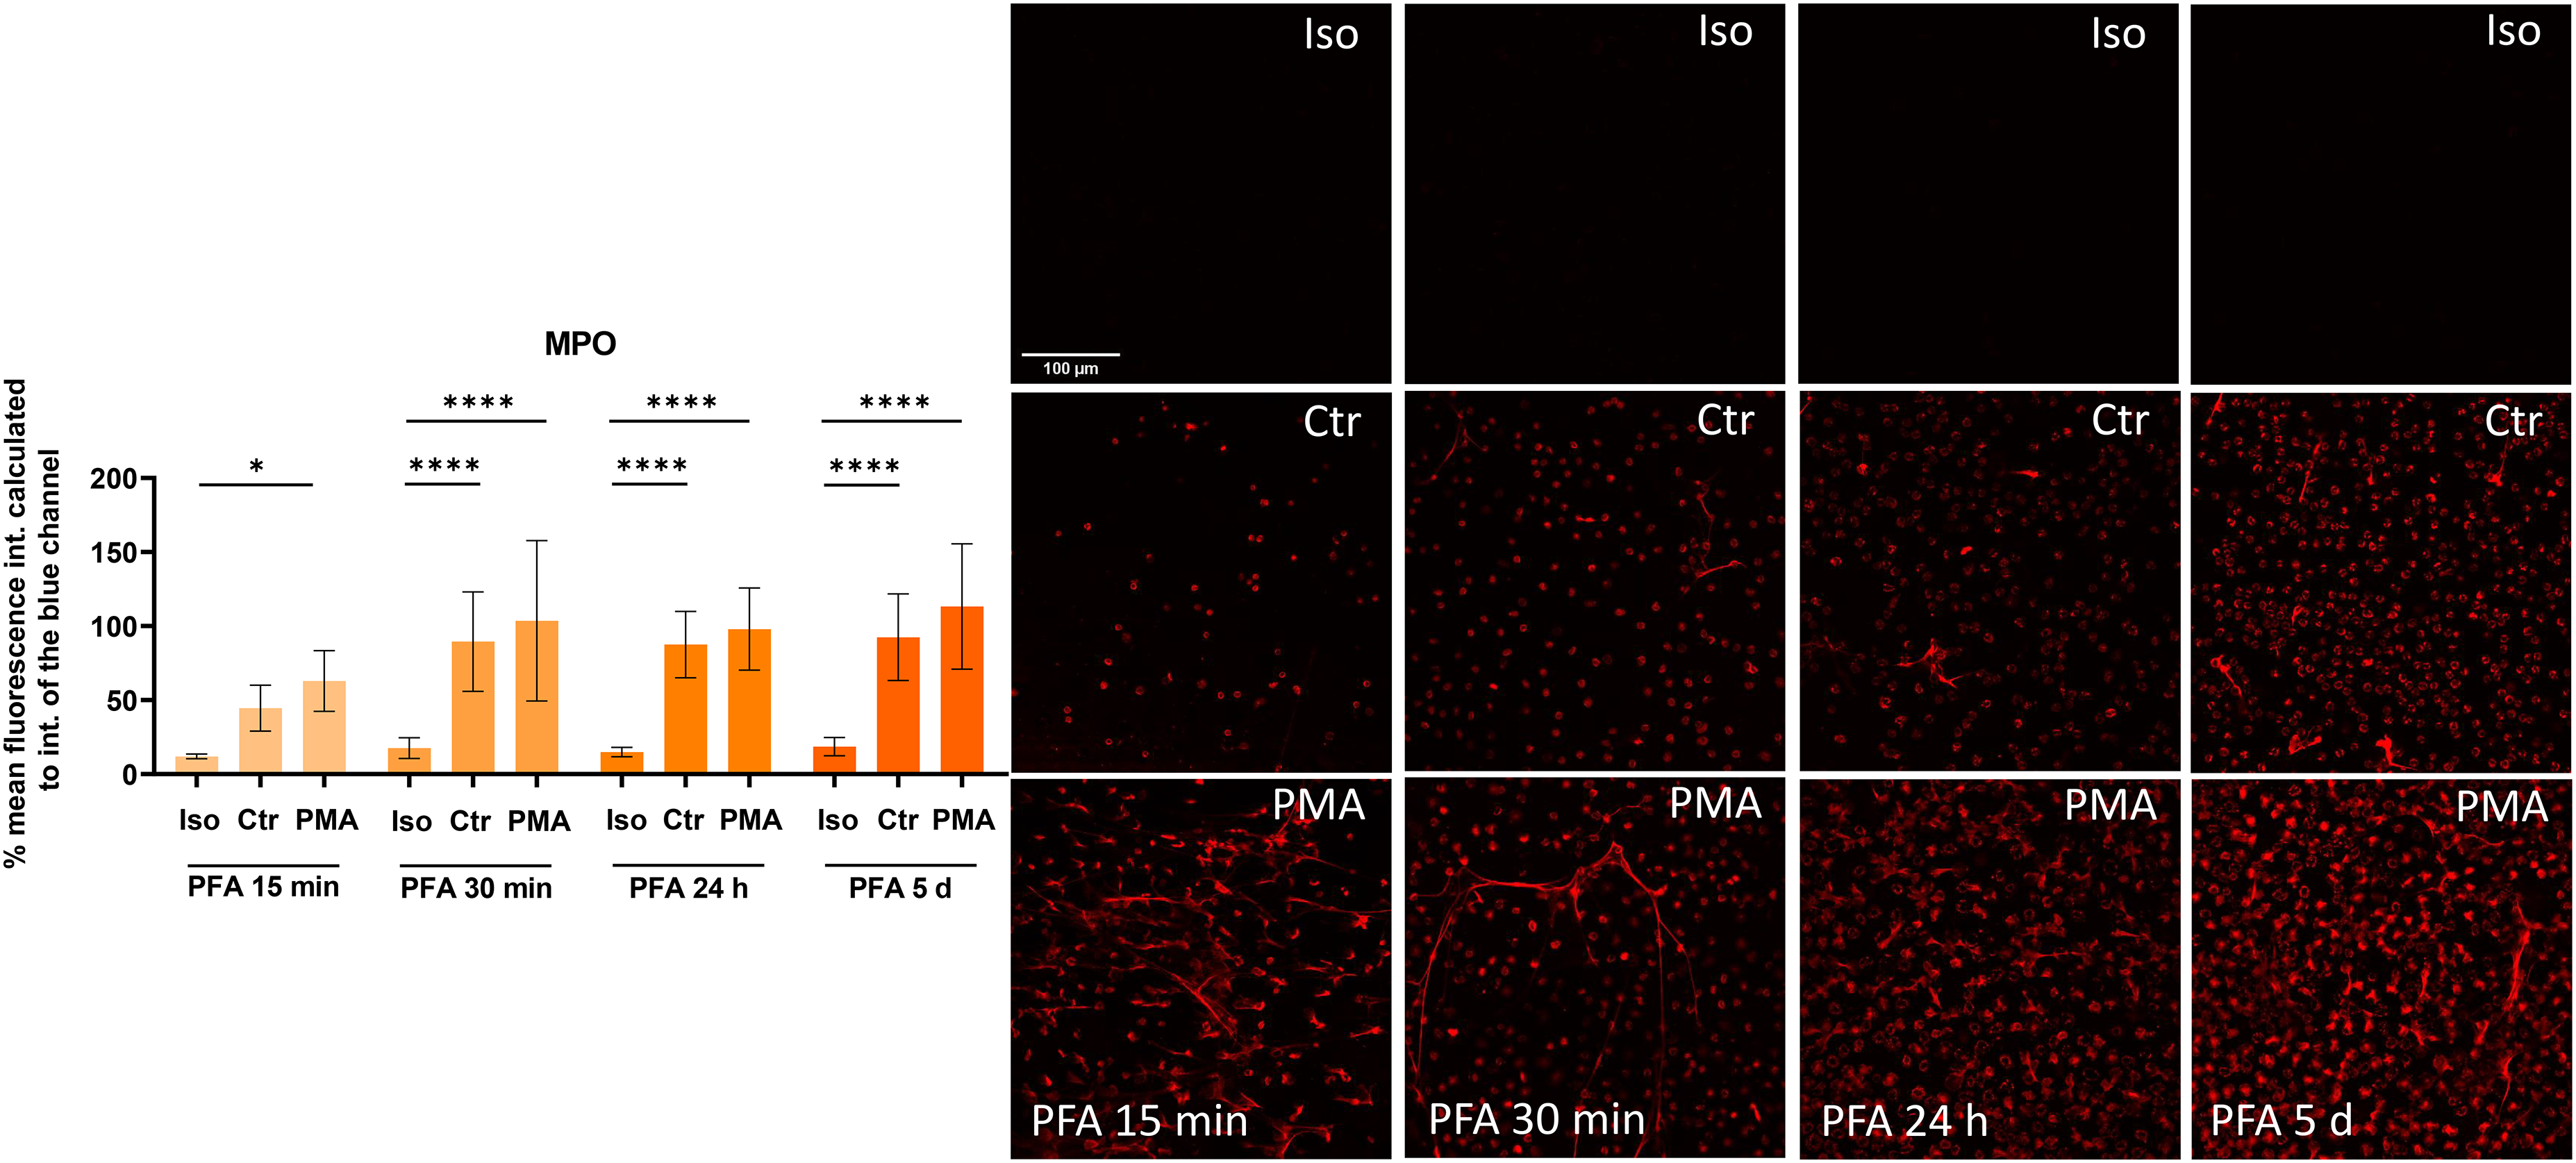
Effect of different incubation times with 4 % paraformaldehyde (PFA) on the intensity of antibody-staining against myeloperoxidase (MPO). Depicted are the mean values and the standard deviation of the data. The percentage mean of the red fluorescence intensity was calculated in relation to the intensity of the blue channel (DAPI-stained nucleus DNA). Statistical comparison was done using a one-way ANOVA comparing isotype control staining (Iso) with respective non-stimulated neutrophils (Ctr) or PMA-stimulated neutrophils (PMA) stained with an antibody against MPO (n = 6–18 of three independent experiments with different blood donors). The results indicate that the rabbit anti-human MPO antibody produces stable fluorescent staining results for fixations with PFA for fixation times of 15 min, 30 min, 24 h as well as 5 days. Fixation periods over 15 min were able to produce highly significant results (p < 0.0001). Information about the exact p-values can be obtained from Table 3. Exemplary micrographs of the respective staining are shown with size bar 100 µm.

Effect of different incubation times with 4 % paraformaldehyde (PFA) on intensity of antibody-staining against citrullinated histone 3 (H3cit). Depicted are the mean values and the standard deviation of the data. The percentage mean of the red fluorescence intensity was calculated in relation to the intensity of the blue channel (DAPI-stained nucleus DNA). Statistical comparison was done using a one-way ANOVA comparing isotype control staining (Iso) with respective non-stimulated neutrophils (Ctr) or PMA-stimulated neutrophils (PMA) stained with an antibody against H3cit (n = 6–18 of three independent experiments with different blood donors). The depicted results imply that the used antibody staining against citrullinated histone 3 only generates significant staining results only for fixation periods of 15 and 30 min. However, this observation cannot be discerned for incubation times of 24 h or 5 days with PFA. Information about the exact p-values can be obtained from Table 3. Exemplary micrographs of the respective staining are shown with size bar 100 µm. The brightness of all images was increased by 20%.

Effect of different incubation times with 5% glutardialdehyde (GA) on intensity of antibody-staining against DNA/histone-1-complexes. Depicted are the mean values and the standard deviation of the data. The percentage mean of the green fluorescence intensity was calculated in relation to the intensity of the blue channel (DAPI-stained nucleus DNA). Statistical comparison was done using a one-way ANOVA comparing isotype control staining (Iso) with respective non-stimulated neutrophils (Ctr) or PMA-stimulated neutrophils (PMA) stained with an antibody against DNA/histone-1-complexes (n = 6–36 of three independent experiments with different blood donors). Information about the exact p-values can b,e obtained from Table 3. Exemplary micrographs of the respective staining are shown with size bar 100 µm.
Overview of different methods used for staining of neutrophil extracellular traps (NETs)-markers and results of the ordinary one-way ANOVA. Asterix indicate the degree of significant differences between % mean fluorescence staining of the isotype control and negative control (Ctr) or phorbol-myristate-acetate (PMA) by staining method. (n.s. = not significant).

Independent of the incubation time, the samples of unstimulated control cells as well as PMA-stimulated neutrophils show a significantly enhanced signal in samples stained with antibodies against DNA/histone-1-complexes or MPO compared to the respective isotype control staining (Figures 1,2). These data indicate that PFA has no impact on the staining intensity with the DNA/histone-1-complexes and MPO antibodies.
When staining against H3cit (Figure 3), a significant difference between isotype control staining and staining of unstimulated (p < 0.0001) or PMA-stimulated (p < 0.0001) neutrophils with specific H3cit-antibodies was detectable in case of 15 min as well as the 30 min incubation time. After 24 h and 5 day long fixation, we detected no significant differences between the isotype control staining and the staining with specific H3cit-antibodies. These data indicate, that PFA has a visible impact on staining intensity, at long incubation times for more than 24 h, assuming a reduced staining efficiency of the H3cit-antibody.
Effect of glutardialdehyde (GA) on staining intensity to visualize neutrophils and NETs
The effect of different incubation times with 5% GA as fixative was tested on the intensity of antibody staining to visualize neutrophils and NETs (Figure 4–6). Only for the staining of DNA-histone 1-complex antibody, a significant enhancement of the staining intensity of PMA-stimulated cells, compared to the respective isotype control, was detected at 24 h incubation (p = 0.0474) as well as at the longest incubation time of 5 days (p < 0.0001) (Figure 4). Furthermore, the absence of any statistical significant differences between isotype control staining and MPO or H3cit-antibody staining (Figures 5 and 6) were detected, indicating a strong interference of GA on the staining of NET-markers. However, all isotype controls exhibited a strong fluorescent signal of at least 45% (Figure 4). To verify, if the result was impacted by GA-induced autofluorescence, a control experiment without any primary, secondary or isotype control antibodies was included. As shown in Figure 7, a fixation with only GA itself for only 30 min resulted in a massive autofluorescence signal in contrast to the other tested fixatives (Figure 7 and Supplementary Figure 1).
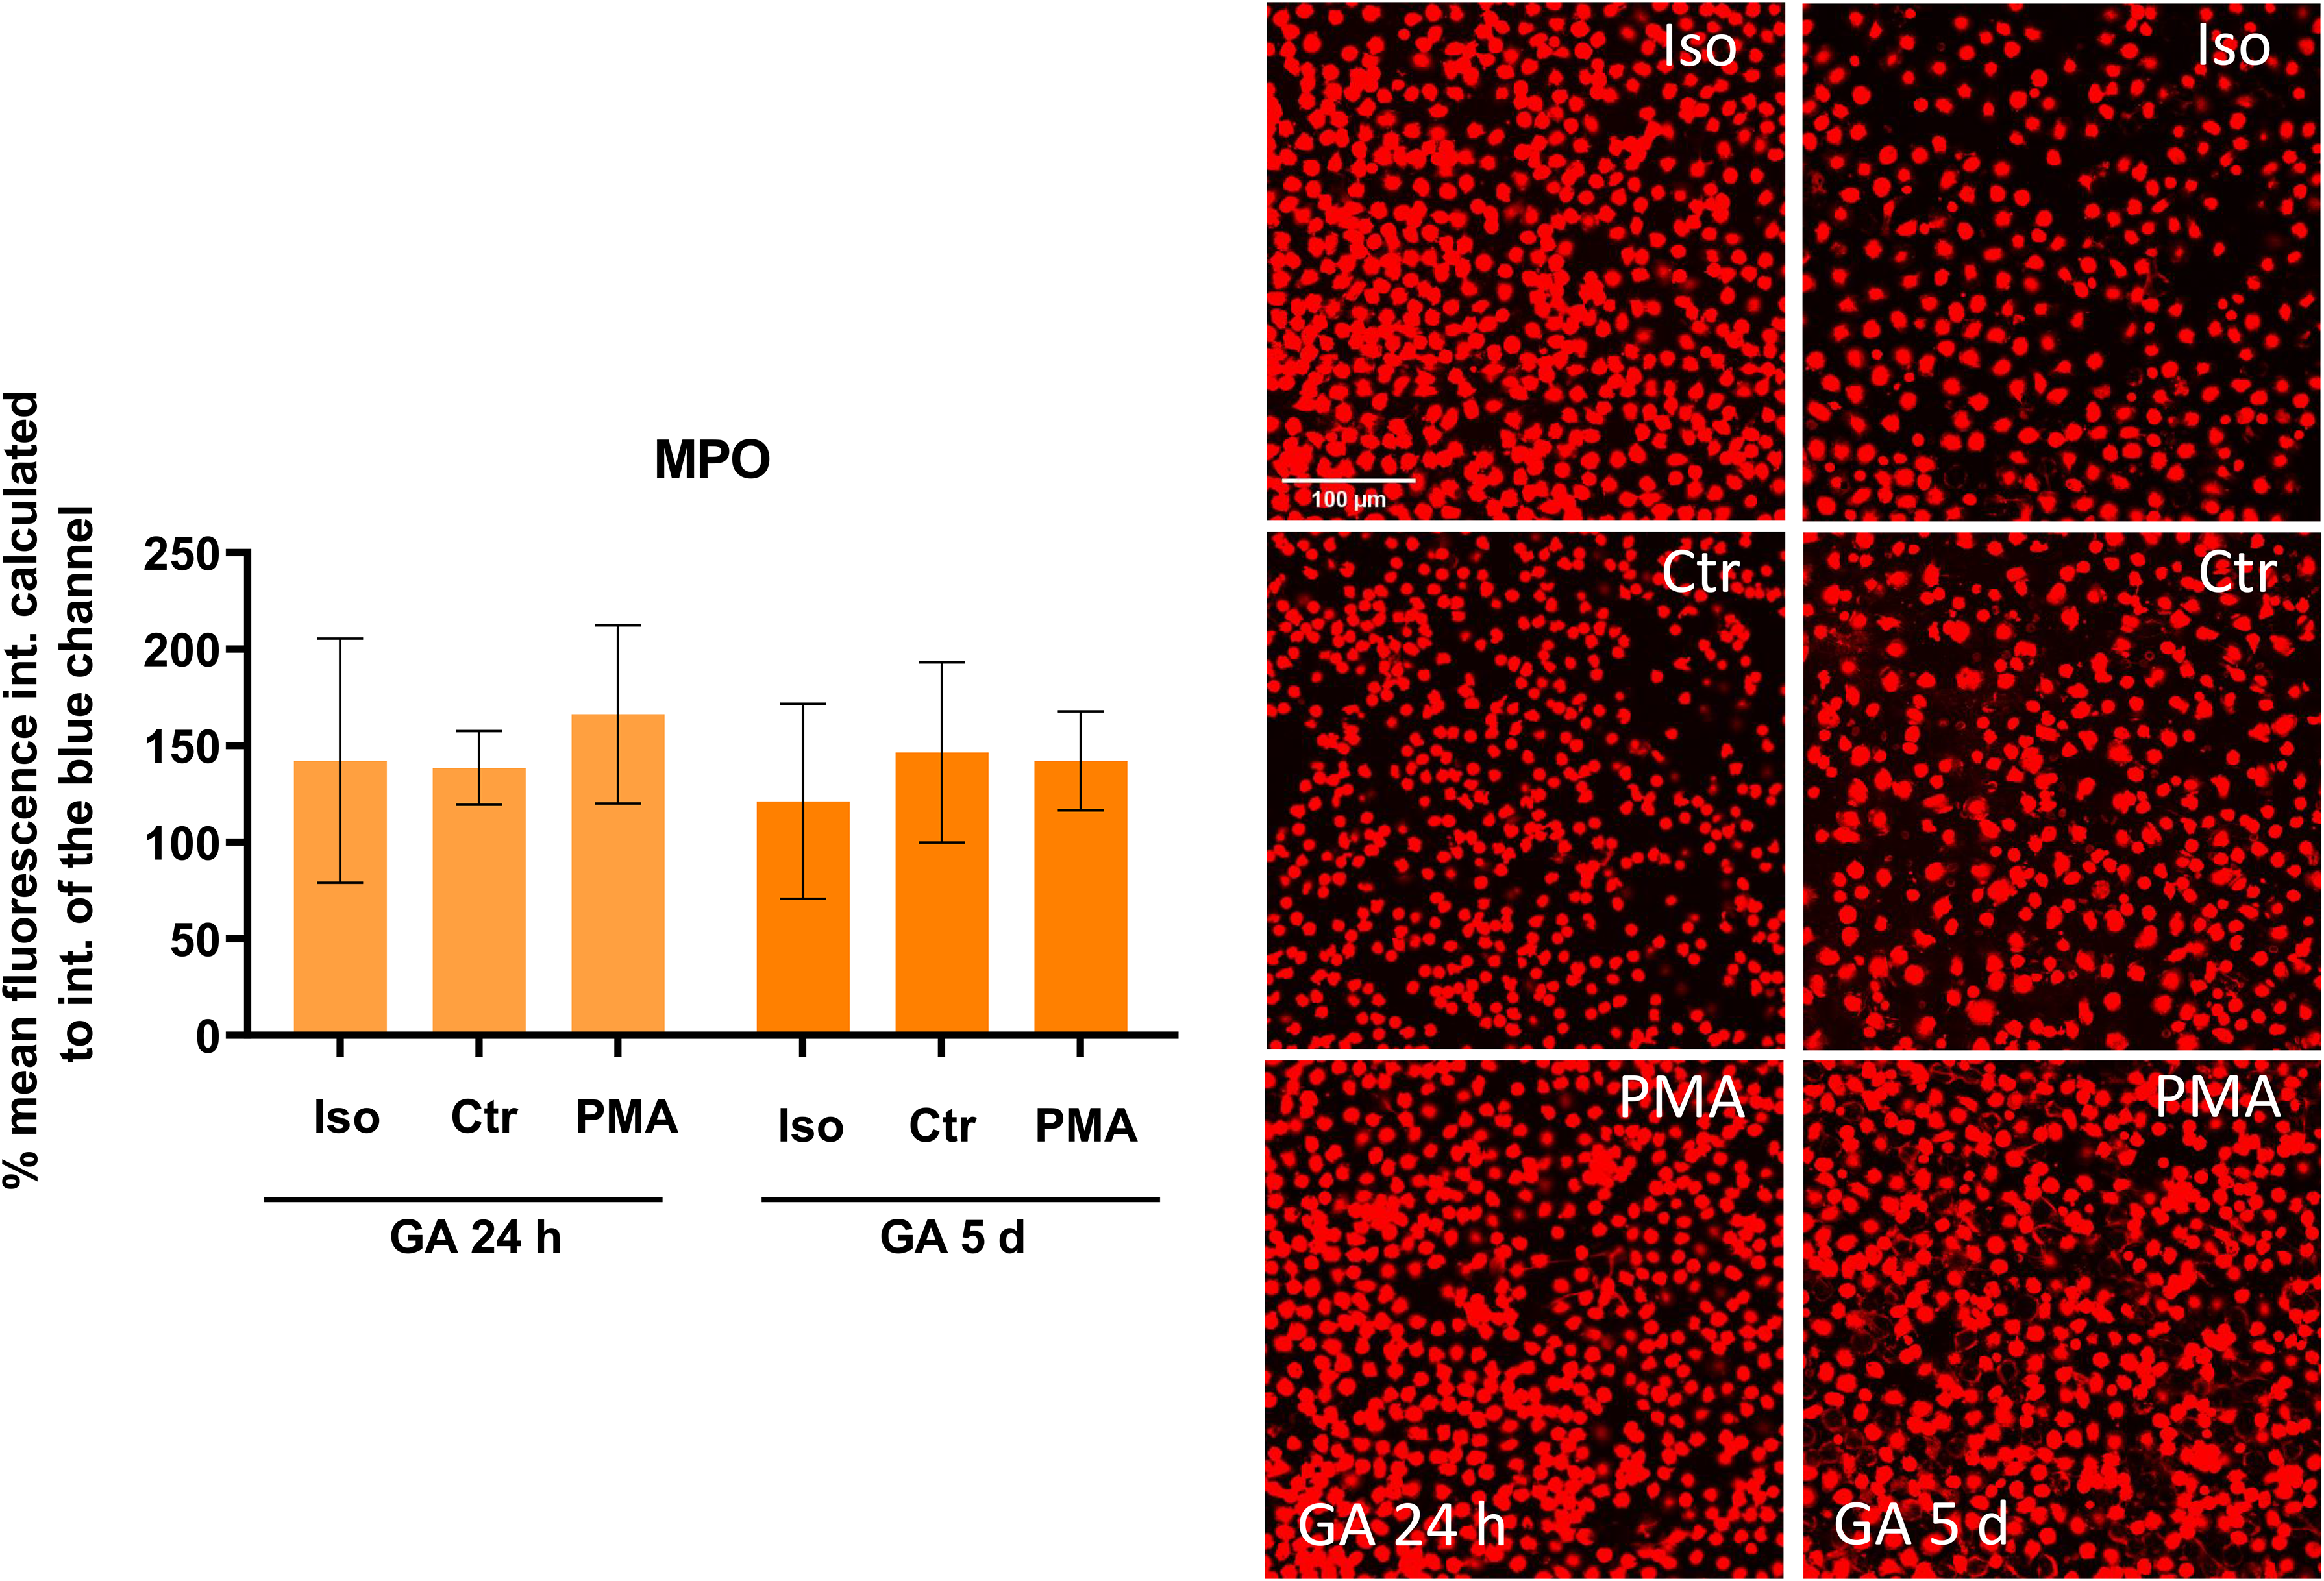
Effect of different incubation times with 5% glutardialdehyde (GA) on intensity of antibody-staining against myeloperoxidase (MPO). Depicted are the mean values and the standard deviation of the data. The percentage mean of the red fluorescence intensity was calculated in relation to the intensity of the blue channel (DAPI-stained nucleus DNA). Statistical comparison was done using a one-way ANOVA comparing isotype control staining (Iso) with respective non-stimulated neutrophils (Ctr) or PMA-stimulated neutrophils (PMA) stained with an antibody against MPO (n = 6–18 of three independent experiments with different blood donors). Information about the exact p-values can be obtained from Table 3. Exemplary micrographs of the respective staining are shown with size bar 100 µm.

Effect of different incubation times with 5 % glutardialdehyde (GA) on intensity of antibody-staining against citrullinated histone H3 (H3cit). Depicted are the mean values and the standard deviation of the data. The percentage mean of the red fluorescence intensity was calculated in relation to the intensity of the blue channel (DAPI-stained nucleus DNA). Statistical comparison was done using a one-way ANOVA comparing isotype control staining (Iso) with respective non-stimulated neutrophils (Ctr) or PMA-stimulated neutrophils (PMA) stained with an antibody against H3cit (n = 6–18 of three independent experiments with different blood donors). As for the myeloperoxidase antibody, no significances could be detected for both incubation times. Information about the exact p-values can be obtained from Table 3. Exemplary micrographs of the respective staining are shown with size bar 100 µm.
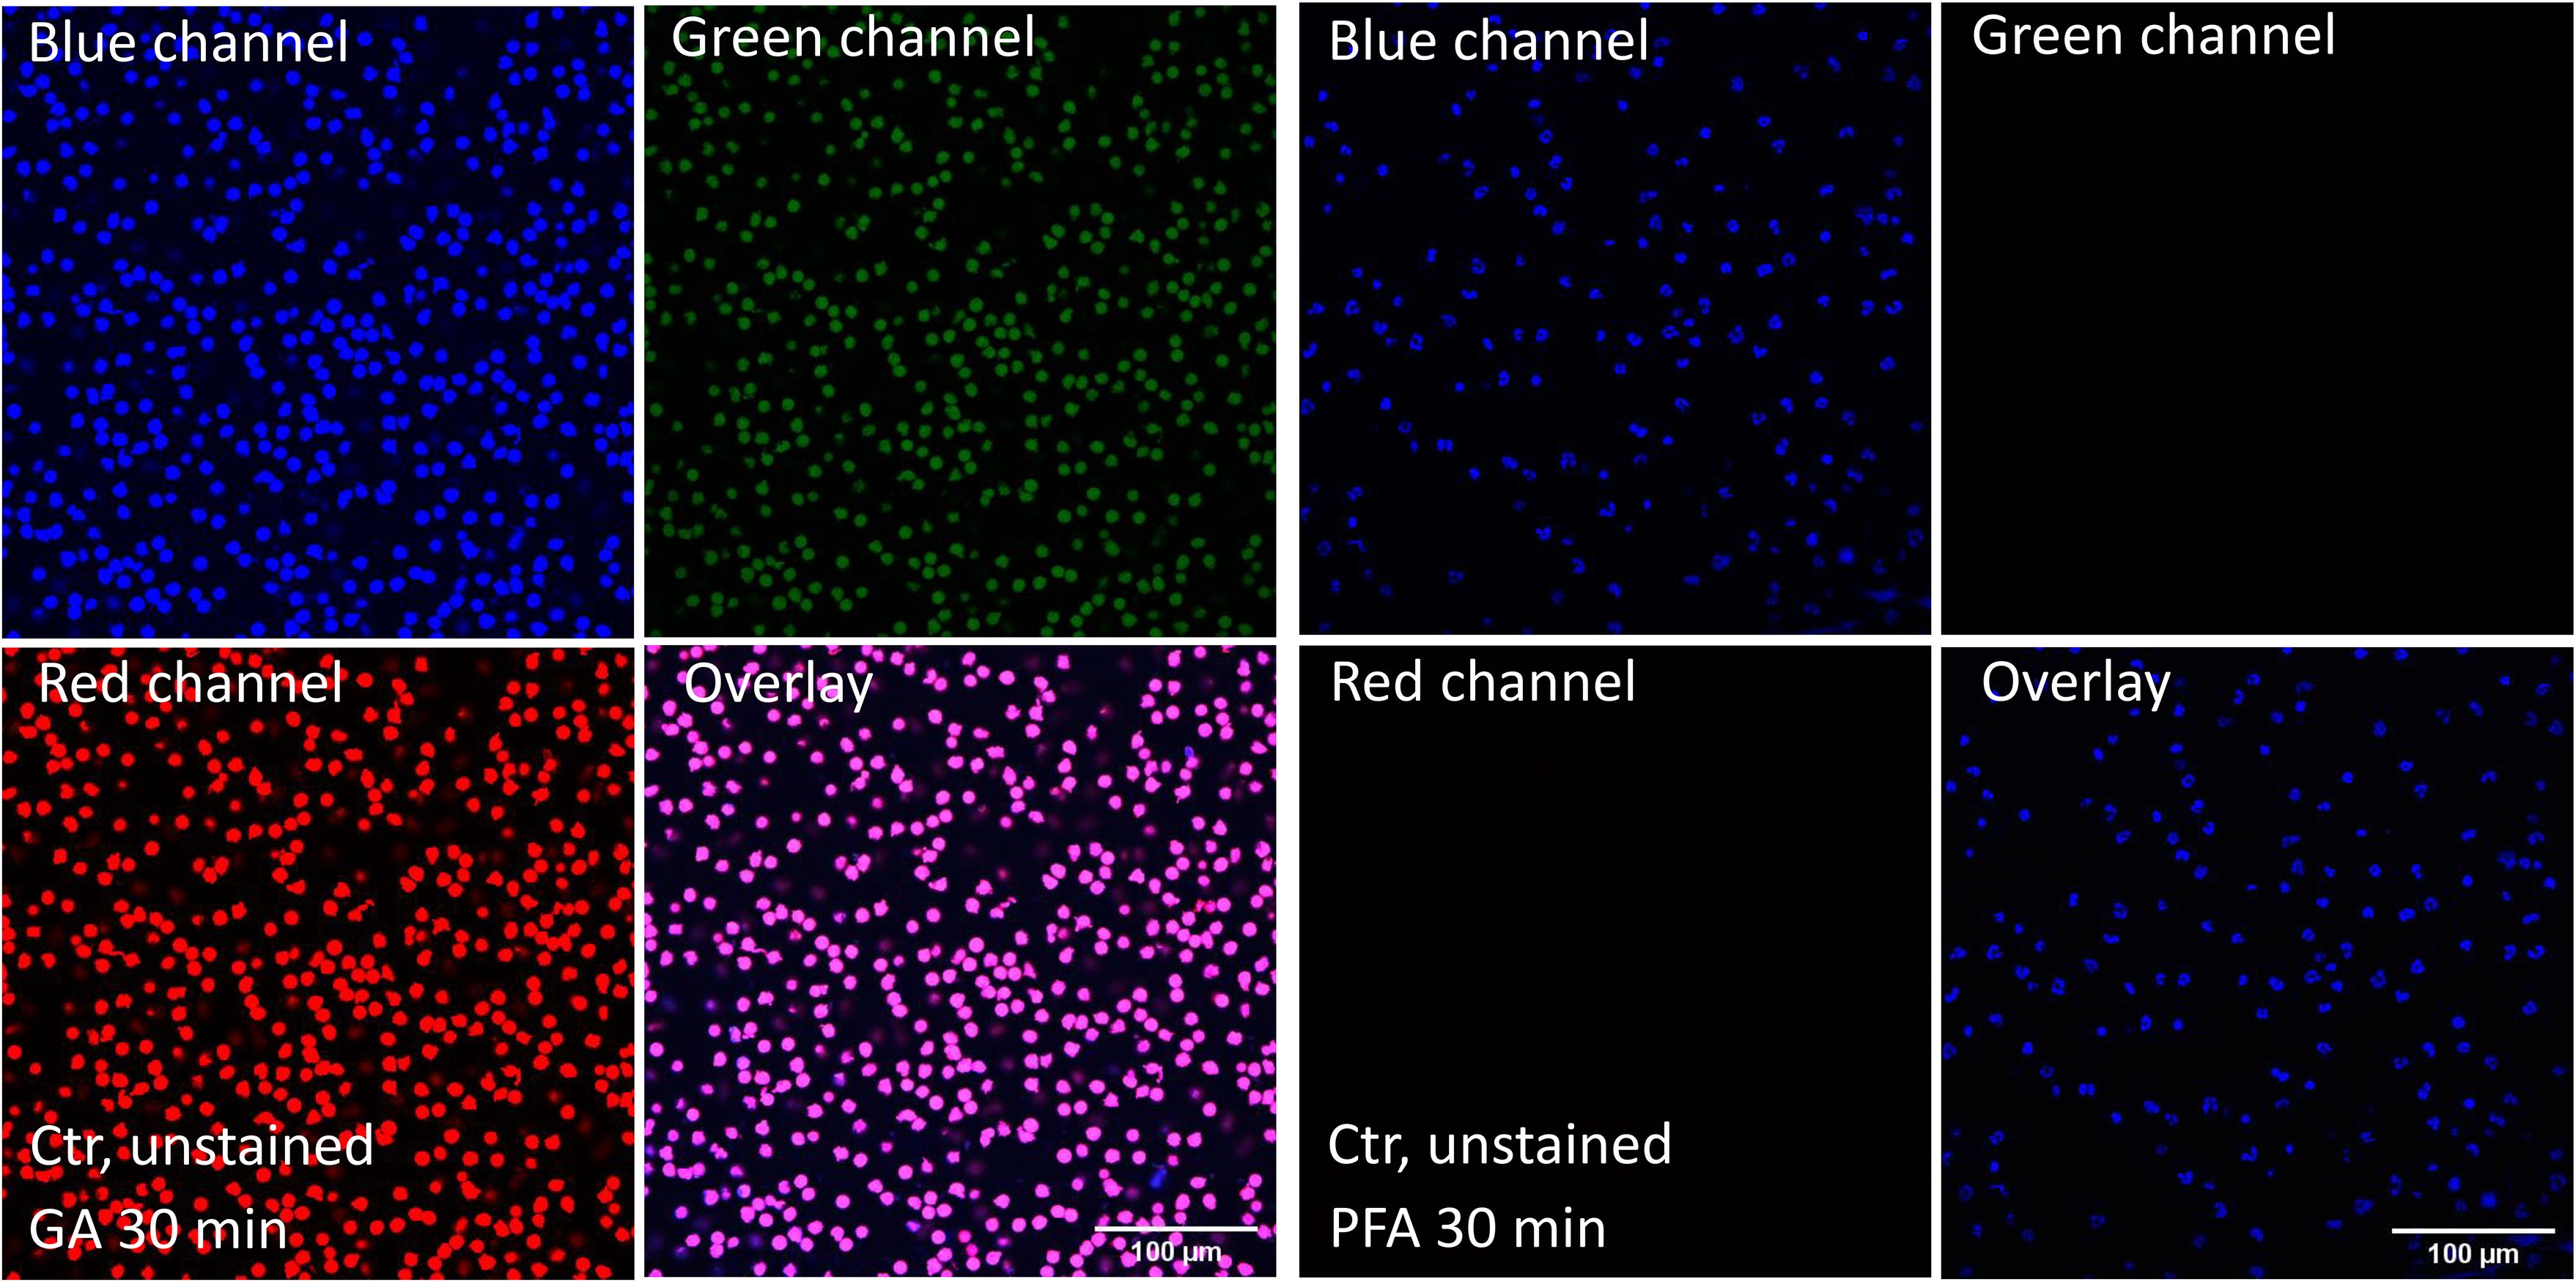
Effect of 5% glutardialdehyde (GA; left hand panel) and 4% paraformaldehyde (PFA; right hand panel) on autofluorescence of neutrophils. Human blood-derived neutrophils were isolated and embedded in Prolong Gold with DAPI to stain the nuclei. Similar microscope gain settings, as shown in Figures 4–6, were chosen, and revealed massive autofluorescent background after fixation with glutardialdehyde. After a fixation with the paraformaldehyde for 30 min however, no autofluorescence is visible. Exemplary micrographs of the respective background fluorescence are shown with a size bar 100 µm.
Effect of methanol (MeOH) on staining intensity to visualize neutrophils and NETs
The effect of 30 min fixation time with 100% MeOH kept at room temperature or ice cold (−20°C) MeOH as fixative was tested on the intensity of antibody staining to visualize unstimulated neutrophils and NETs (Figures 8–10). Independent of the MeOH temperature, there was a significant difference visible between isotype control staining and NETs-specific staining of untreated neutrophils or PMA-stimulated neutrophils in case of antibodies against DNA/histone-1-complexes (Figure 8). The degree of significance had a minimum p-value of p = 0.0002 (PMA MeOH −20°C) and, in all other cases, was as low as p < 0.0001. A similar observation can be made for the MPO-antibody (Figure 9A), here the minimum p-value amounts to p = 0.0005 (Ctr MeOH −20°C), whereas all other p-values again were lower than 0.0001. For H3cit-staining, no difference between isotype controls and specific antibody-treatment was found, since no specific signal was detectable after fixation with MeOH, regardless of the temperature (Figure 9B). Remarkably, the morphological phenotype of the neutrophils differed, in comparison to all other stainings, when MeOH was used as fixative agent. A staining of the nucleus DNA with DAPI (blue channel) revealed an incomplete staining with a smear-like effect, indicating cellular damage or an incomplete fixation of cellular content (Figure 10). Following this observation, a Diff-Quick staining of neutrophils fixed with MeOH confirmed damage to cellular structures and cellular membranes in comparison to PFA, resulting in seemingly depleted cells. Exemplary micrographs of the respective staining are shown in Figure 10.

Effect of room temperature (RT) or ice cold (−20°C) methanol (MeOH) on intensity of antibody-staining against DNA/histone-1-complexes. Depicted are the mean values and the standard deviation of the data. Calculated was the % mean green fluorescence intensity calculated relative to the intensity of the blue channel (DAPI-stained nucleus DNA). Statistical comparison was done using a one-way ANOVA comparing isotype control staining (Iso) with respective non-stimulated neutrophils (Ctr) or PMA-stimulated neutrophils (PMA) stained with an antibody against DNA/histone-1-complexes (n = 18–36 of three independent experiments in duplicate with different blood donors). For fixations with methanol, both at room temperature and ice cold methanol, the antibody was able to produce significant staining results in both cases. Information about the exact p-values can be obtained from Table 3. Exemplary micrographs of the respective staining are shown with size bar 100 µm.

Effect of room temperature (RT) or ice cold (−20°C) methanol (MeOH) on intensity of antibody-staining against myeloperoxidase (MPO) or citrullinated histone 3 (H3cit). Depicted are the mean values and the standard deviation of the data. Calculated was the % mean red fluorescence intensity calculated relative to the intensity of the blue channel (DAPI-stained nucleus DNA). Statistical comparison was done using a one-way ANOVA comparing isotype control staining (Iso) with respective non-stimulated neutrophils (Ctr) or PMA-stimulated neutrophils (PMA) stained with an antibody against MPO or H3cit (n = 9–18 of three independent experiments with different blood donors). While the MPO antibody produces significant staining results, when comparing unstimulated and stimulated cells to the isotype control for both incubation temperatures, and therefore is seemingly suitable for methanol as fixative, contrary observations can be made for the anti-H3Cit antibody. Here, the measured fluorescent signal never exceeded the isotype control. The absence of specific signal indicates that the chosen antibody is not stable after fixation with methanol. Information about the exact p-values can be obtained from Table 3. Exemplary micrographs of the respective staining after fixation with room temperature methanol are shown with size bar 100 µm.
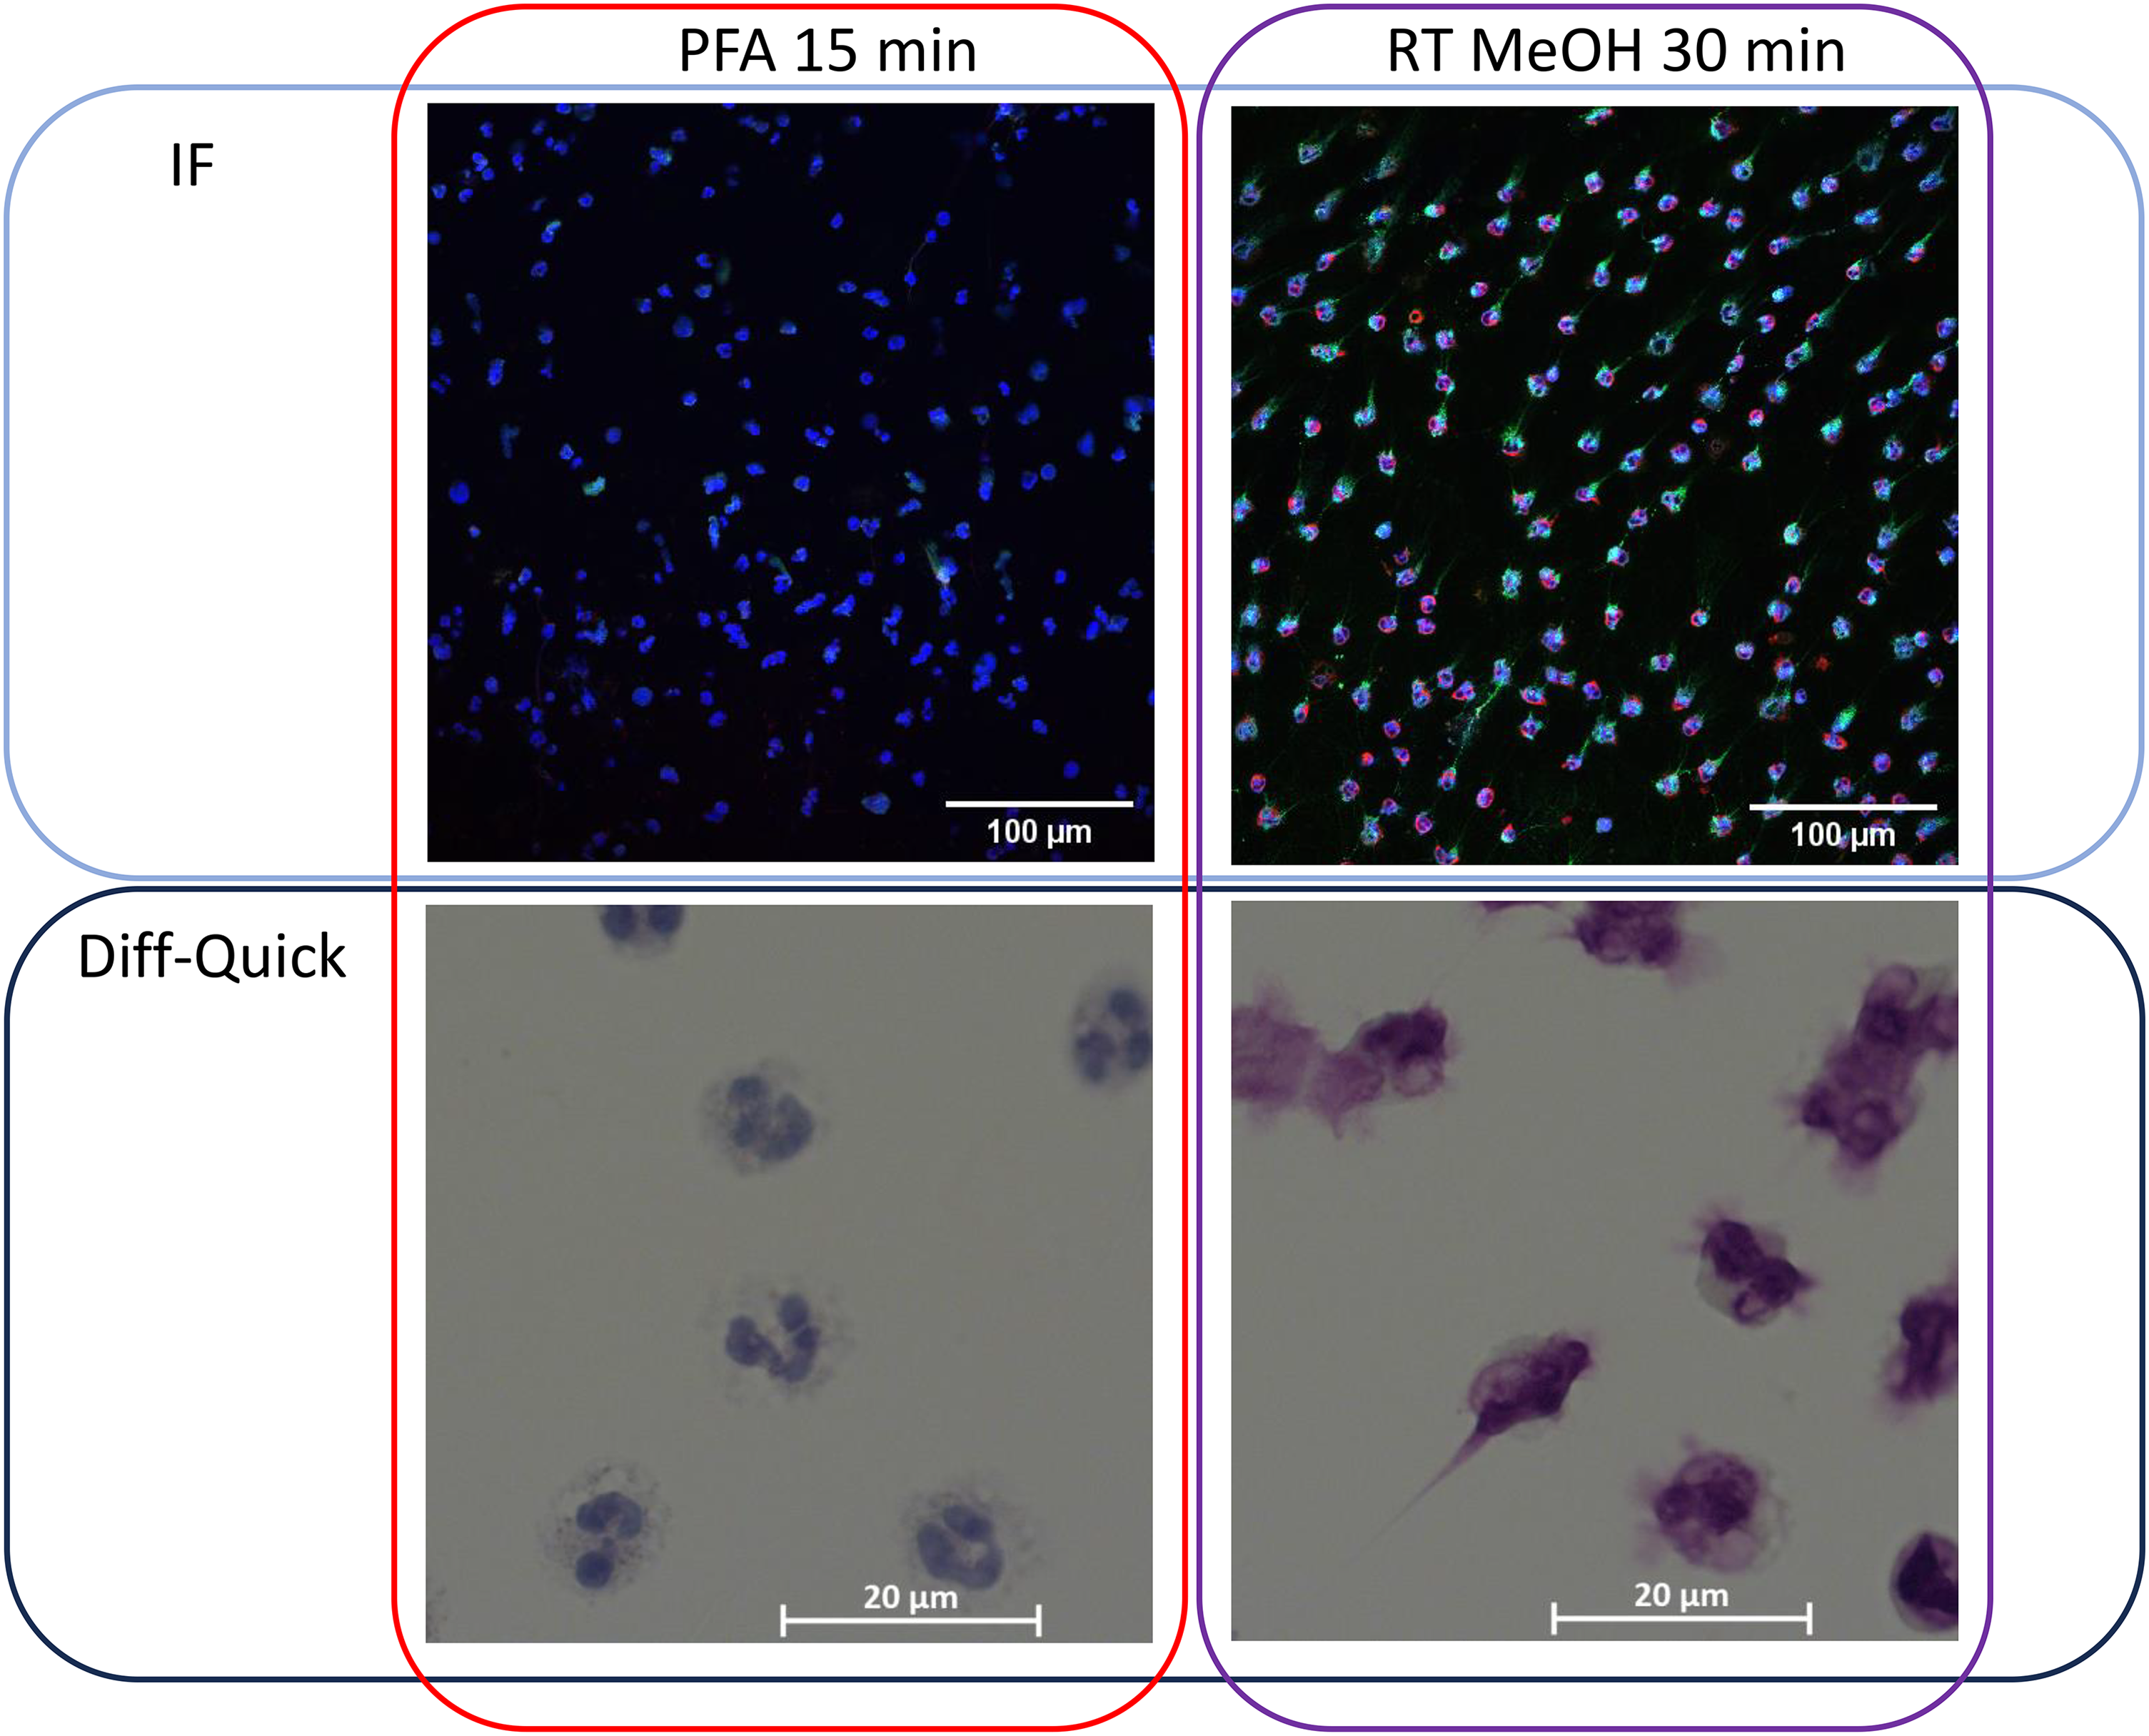
Effect of 100% methanol (MeOH) at room temperature (RT) on cellular staining and cellular structure of neutrophils. Human blood-derived neutrophils were isolated and fixed with MeOH for 30 min. Cells were then stained with antibodies against myeloperoxidase (MPO) (red) and DNA/histone-1-complexes (green) to visualize neutrophils and NETs. Nuclei were stained with DAPI (blue) and revealed cellular damage with incomplete staining of the nucleus. Cells were also stained with a Diff-Quick solution kit to visualize cellular structures. In contrast to fixation with MeOH, the neutrophils were also fixed for 15 min with 4% paraformaldehyde (PFA), to compare changes in cellular structure. Exemplary micrographs of the respective staining are shown. (IF, immunofluorescence, overlay micrographs of MPO, DNA/histone-1-complexes and DAPI stainings).
An overview of all data and respective p-values of differences comparing the various staining groups is shown in Table 3.
Discussion
The central topic of this work was the comparison and optimization of protocols using different fixatives (4% PFA, 5% GA, 100% MeOH) by applying respective antibody stainings for visualization of markers for NETs and associated granular proteins that were evaluated with immunofluorescence laser scanning confocal microscopy. For this purpose, fresh blood-derived human neutrophils were first fixed for varying incubation times. Subsequently, initially defined markers for neutrophils and NET-formation were visualized with different primary antibodies against MPO, H3cit or DNA/histone-1-complexes by linked fluorescently labeled secondary antibodies. During evaluation, the mean fluorescence intensity of each marker was determined and calculated relative to the intensity of the nucleus counterstaining (DAPI staining).
Since DNA forms the primary structure of NETs, various DNA-intercalating dyes like DAPI, propidium iodide, SYTOX Orange, or SYTOX Green are commonly used to visualize NETs. However, as histones and other granule components, such as MPO or elastase, are also present in high amounts within NETs, additional immunostaining of these enzymes with specific antibodies can improve NET visualization (summarized by de Buhr and von Köckritz-Blickwede 20 ). Findings show that cationic antimicrobial peptides, like the cathelicidin LL-37, which are associated with NETs, inhibit the binding of DNA-intercalating dyes to NETs, thus reducing their visibility. 21 Therefore, antibody-based techniques should always be the preferred approach for visualizing and quantifying NETs.
In our study we used DAPI only to stain the nuclei of the cells. In order to detect cfDNA or NETs we chose an anti-DNA/Histone-1-antibody, which among other histones, can be found in the extracellular NET-structures. 5
It has to be mentioned that no focus was given on the amount or percentage of NET-forming neutrophils. The measured fluorescent intensity does not reflect the quantity of NETs or NET-forming cells, therefore no conclusions regarding the effectiveness of NET-induction by a certain stimulus was drawn. The focus was set on the effect of fixation on the intensity of antibody staining by fluorescent microscopy evaluation of the samples to characterize staining efficiency compared to a respective negative isotype control staining. Of particular interest, when choosing the fixatives and incubation conditions, was the use of these regarding sample inactivation. Such inactivation may be of high relevance in the context of infection studies and/or the transport of sample material from a higher to a lower biosafety level. For this reason, a fixation with PFA at a low temperature of 4°C was excluded, even though some cellular structures are better preserved than with a fixation at room temperature. 22 At low temperatures, peptide cross-linking occurs more slowly, requiring an extension of incubation times. 23 But as shown in this study, longer incubation times can negatively affect the staining intensity of certain antibodies.
The results of the immunofluorescence staining indicate that the used anti-H3cit antibody is unsuitable for samples fixed with MeOH or GA, regardless of the time of fixation. The only significant differences between the isotype and the stimulated anti-H3cit-stained samples were found for PFA fixations for 15 and 30 min (Figure 3). In all longer stainings, the staining intensity or efficiency compared to the isotype negative control was partially reduced and not clearly evident. These results indicate that shorter incubation times between 15 and 30 min are recommended for cellular fixation with 4% PFA, if a staining with H3cit antibody is intended. In contrast, the MPO antibody can be used for all PFA-incubation times as well as for MeOH fixation. The most stable of all three antibodies was the anti-DNA/histone-1-complex antibody. Here, a significant difference between the stained control samples and the respective isotype controls was detected even after long incubation times of 24 h and 5 days.
Specific alterations of the background autofluorescence were observed when using GA as a fixative, independent of the incubation time. It may be assumed that GA leads to an enhancement of a non-specific autofluorescent signal. This is in line with the data from different groups that used GA as a suitable fixative for electron microscopy, but criticize the autofluorescence in samples stained by immunofluorescence labeling.24–26 It is important to mention, that in contrast to the 5% GA used in our study, a lower concentration of 2 to 2.5% GA is often used for fixation and inactivation by some groups,27–29 which presents an opportunity for further future adjustments in the experimental setup. However, in line with our study, 5% GA is commonly used for fixation of tissue samples 30 and, thus, is relevant for certain structural research questions.
We compared room temperature and ice cold MeOH. Published standard protocols generally include ice cold MeOH around −20°C.28,31 A combination of MeOH with different reagents, for instance with acetone or paraformaldehyde, and a lower than 100% concentration are frequently used.28,29 Here, we showed that MeOH fixation leads to artefacts including damage of the cell structural of neutrophils. Similar findings were previously reported, describing complete loss of integrity of cytoplasmic organelles, to the extent of them being undetectable via reflection contrast microscopy when fixing human Michigan Cancer Foundation-7 (MCF-7) cells with pure and ice cold (−20°C) methanol for 10 min. 32 Similar observations were made by imaging of mouse embryonic fibroblasts, after fixation under previously mentioned conditions, describing a loss of cytoplasmic material. 28 Thus, we conclude that MeOH fixation might not be an optimal fixation procedure for neutrophils and NETs.
Furthermore, it is important to mention that the choice of anti-coagulant can affect the fixation process. EDTA and citrate, for instance, chelate calcium ions and can alter cell membrane integrity, particularly in the presence of fixatives like PFA and GA, which cross-link proteins. This could affect fixation quality by changing the membrane properties or causing mild changes in cell morphology. Since calcium has many functions within the cell (as reviewed by Berridge et al. 33 ), including the stabilization of cellular structures, it is logical that prior binding of calcium may also influence the quality of fixation. Furthermore, EDTA would not have been the anticoagulant of choice in our study, as it has also been shown to lead to a reduced response of neutrophils to PMA as an activating stimulus. 34 Heparin binds to antithrombin and prevents clotting without removing calcium ions, which can make it less disruptive to cell surface proteins and potentially more compatible with fixatives that require intact membrane structures, like GA. However, heparin has also been shown to not only exhibit a high binding affinity with neutrophils via a surface protein on the cellular membrane, 35 it furthermore induces the up- and down-regulation of certain (adhesion) molecules on the cell surface. This might be dependent on the dosage of heparin 36 and could, thus, also partially affect the efficiency of peptide cross-linkers such as PFA or GA. Methanol (MeOH), which precipitates proteins and disrupts lipids, and thereby inherently permeabilizes cells, is generally less sensitive to the type of anticoagulant used. However, anticoagulants that impact cell membrane integrity may still lead to increased cell fragility or permeability during methanol fixation, altering cell morphology and protein staining.
In summary, while heparin in our opinion is generally preferred for its minimal impact on cell integrity and protein interactions, anticoagulants like EDTA or citrate can interfere with fixation outcomes by chelating ions and massively affecting membrane properties. If precise morphological preservation or consistent staining is crucial, especially for PFA or GA fixation, heparin or similar anticoagulants are usually the best choice.
Before we proceed to our final conclusion we want to shortly address the statistical analysis. Generally, the results of stimulated samples display a greater variability compared to the unstimulated controls. For one, the error bars plotted in the graphs are based on the standard deviation and thus display the greatest possible variability of the measured intensities. For a better visualization of this, we have added exemplary graphs which display the SEM and the 95% CI to the supplementary (Supplementary Figure 2). A biological reason for the high standard deviation can be donor-specific differences in neutrophil-response. The neutrophil population of even one donor exhibits great heterogeneity and plasticity.37–39 Besides genetics, environmental factors such as psychological stress, 40 the microbiome, as well as the age of the circulating neutrophil 41 can impact the reaction of neutrophil to a stimulus.
Finally, we conclude that MeOH and GA-fixation of neutrophils and NET-associated markers are of limited use for immunofluorescence stainings with antibodies against MPO, H3cit or DNA/histone-1-complexes. In contrast, PFA showed a clear staining result and greatest significance comparing the activated cells to respective isotype control stainings, as indicator for best efficiency, when the fixation was performed for 15–30 min. Thus, for the selected staining we recommend 15 min PFA fixation. In our opinion this is important knowledge that bears potential to also improve future protocols when studying neutrophils and NETs.
Neutrophils and the formation of NETs with associated granular proteins are key factors for the innate immune response and disease development.2,42,43,44 Further optimization of the visualization of neutrophils themselves or NET formation driven by neutrophils triggered for example by virus or bacterial infection can contribute to a better understanding of innate immunity and the role of neutrophils in the pathogenesis of certain diseases.
Limitations of the study
We have selected only three NET-associated markers using antibodies from specific companies. The results might vary when antibodies against other epitopes or from other companies are applied. However, our data lead to the sensitization that fixation and different times of fixation might have a major impact on the staining intensity and subsequent data generation. Furthermore, we would like to point out the restricted sample size of independent experiments from different donors. Although a larger sample size with additional donors introduces greater variability and can complicate the analysis, it also improves the validity and reliability of the findings by offering a broader data foundation, leading to more generalizable results.
Supplemental Material
sj-pdf-1-ini-10.1177_17534259241307563 - Supplemental material for The effect of chemical fixation with paraformaldehyde, glutardialdehyde or methanol on immunofluorescence staining of neutrophils and neutrophil extracellular traps
Supplemental material, sj-pdf-1-ini-10.1177_17534259241307563 for The effect of chemical fixation with paraformaldehyde, glutardialdehyde or methanol on immunofluorescence staining of neutrophils and neutrophil extracellular traps by Veronika Pilchová, Armina Richter, Marita Meurer, Claudia Schulz and Maren von Köckritz-Blickwede in Innate Immunity
Footnotes
Acknowledgements
The authors wish to thank the technicians of the research group Infection Biochemistry for excellent lab management.
Declaration of conflicting interests
The authors declared no potential conflicts of interest with respect to the research, authorship, and/or publication of this article.
Funding
This work was supported by the Ministry of Science and Culture of Lower Saxony in Germany (14-76103-184 CORONA-15/20, M.v.K.-B.). This Open Access publication was funded by the Deutsche Forschungsgemeinschaft (DFG, German Research Foundation) within the program LE 824/10-1 “Open Access Publication Costs” and University of Veterinary Medicine Hannover, Foundation.
Author contributions
V.P., A.R., M.M., C.S. planned and designed the experiments under supervision of M.v.K-B. A.R., V.P. generated the data. All authors contributed to the analysis and interpretation of the data. Original manuscript drafting was done by V.P., A.R. and M.v.K.-B. All authors have read and agreed to the published version of the manuscript.
Ethics approval
The study was approved by the ethical committee of Hannover Medical School No: 3295-2016.
Data availability
The authors declare that all data supporting the findings of this study are available within the paper, and any raw data can be obtained from the corresponding author upon request.
Supplemental material
Supplemental material for this article is available online.
References
Supplementary Material
Please find the following supplemental material available below.
For Open Access articles published under a Creative Commons License, all supplemental material carries the same license as the article it is associated with.
For non-Open Access articles published, all supplemental material carries a non-exclusive license, and permission requests for re-use of supplemental material or any part of supplemental material shall be sent directly to the copyright owner as specified in the copyright notice associated with the article.