
Abstract
Impaired Glc tolerance and hyperinsulinemia are a hallmark of type 2 diabetes (T2D) and are associated with an altered innate and adaptive immune response. In this study, we used a high-fat diet (HFD)-induced model of pre-diabetes to explore the pathological implications of altered innate lymphoid cell (ILC) profiles in a state of impaired Glc tolerance. Sixteen male C57BL/6 mice were randomized to receive two experimental diets (n = 8 per group), low-fat (LFD), and HFD for 8–13 wk. We evaluated the levels of circulating innate lymphoid cells and their respective cytokines following HFD-feeding. The HFD group had impaired Glc tolerance, elevated insulin levels, and increased total cholesterol levels. Notably, the levels of circulating ILC1s were elevated following 13 wk of HFD-feeding. Moreover, the levels of TNF-α were decreased, but there were no changes in IFN-γ levels. Lastly, the levels of circulating ILC2s and ILC3s were comparable between the HFD and LFD group. The findings demonstrated that short-term HFD-feeding increases postprandial blood Glc, total cholesterol and insulin levels. However, the metabolic changes did not alter ILC2 and ILC3 levels and their respective cytokine profiles.
Introduction
Noncommunicable diseases (NCDs) account for approximately 71% all deaths. 1 Notably, obesity is a major risk factor for the development of NCDs, including type 2 diabetes (T2D), 2 which is characterized by persistent activation of both the innate and adaptive immune system. 3 Activated immune cells infiltrate metabolic tissues, such as adipose tissue, muscle and the liver, thus promoting a pro-inflammatory state leading to insulin resistance. 4 In fact, altered innate and adaptive immune responses, are associated with the pathogenesis and progression of T2D.5,6 Th cells play a crucial role in modulating adaptive immune responses have been linked with complications metabolic disease, including T2D.3,7 Briefly, upon activation, Th cells differentiate into the functionally polarized subsets; which comprise of Th1, Th2, Th17 and regulatory T cells. 8 The Th1 and Th17 subsets may orchestrate inflammatory responses through the production of IFN-γ and IL-17. 9 In a state of obesity, enhanced production of these cytokines is associated with the development of insulin resistance.10,11 Thus, highlighting the role of these immune cells during an abnormal inflammatory response that may lead to metabolic dysfunction.12–14
Previous experimental models of pre-diabetes have already shown that low-grade inflammation is a crucial initiator and determinant of developing overt T2D. 12 Moreover, adipose tissue-resident innate lymphoid cells (ILCs) promote inflammation, insulin resistance and impaired Glc tolerance in pre-clinical models of pre-diabetes and T2D.13,14 For instance, through the suppression of anti-inflammatory IL-5 and IL-13, the ILC2 subtype can dys-regulate an immune response, leading to a state of chronic inflammation and metabolic dys-function. 15 On the other hand, elevated IL-5 and IL-13 levels are associated with improved Glc metabolism in both human and experimental mouse models. 4 Thus, the role of ILCs in a state of pre-diabetes or diet-induced obesity remains unclear. Thus, we propose that a better understanding of the function of ILCs in pre-diabetes or in experimental models of obesity may guide therapeutic interventions aimed at alleviating the inflammation and associated metabolic complications. Therefore, in this study we aimed to enumerate circulating innate lymphoid subtypes using a short-term high-fat diet (HFD)-induced pre-diabetic model. Moreover, we evaluated the cytokine profiles associated with each ILC subtypes using this prediabetic mouse model.
Methods
Study design and experimental procedures
Sixteen, 8-wk-old C57BL/6 male mice were purchased and housed at the Biomedical Research Unit (BRU) at the University of KwaZulu-Natal, South Africa. The animals were housed in two separate cages (n = 8/cage) in an environment-controlled 12 h light cycle and dark cycle. The animals had unrestricted access to food and water throughout the experiment. The study protocol was approved by the University of KwaZulu-Natal (UKZN) Animal Research Ethics Committee (AREC) protocol number: AREC/081/018D. Pre-diabetes was induced by short-term HFD (60 Kcal% derived from fat) feeding. The experimental model and the composition of diets has been previously described. 16 The body masses were measured weekly, during the experimental period (Figure 1). We further evaluated the levels Glc tolerance, following 8 wk of HFD-feeding, by performing an oral Glc tolerance test (OGTT). Briefly, the mice were fasted for 8 h and 3 g/kg Glc solution was administered via oral gavage. Basal Glc levels and post-prandial Glc levels were measured at varying time intervals (0, 30, 60, 90, 120 min) using the OneTouch®Select® handheld glucometer (LifeScan Inc., Milpitas, CA, USA) as previously described. 17
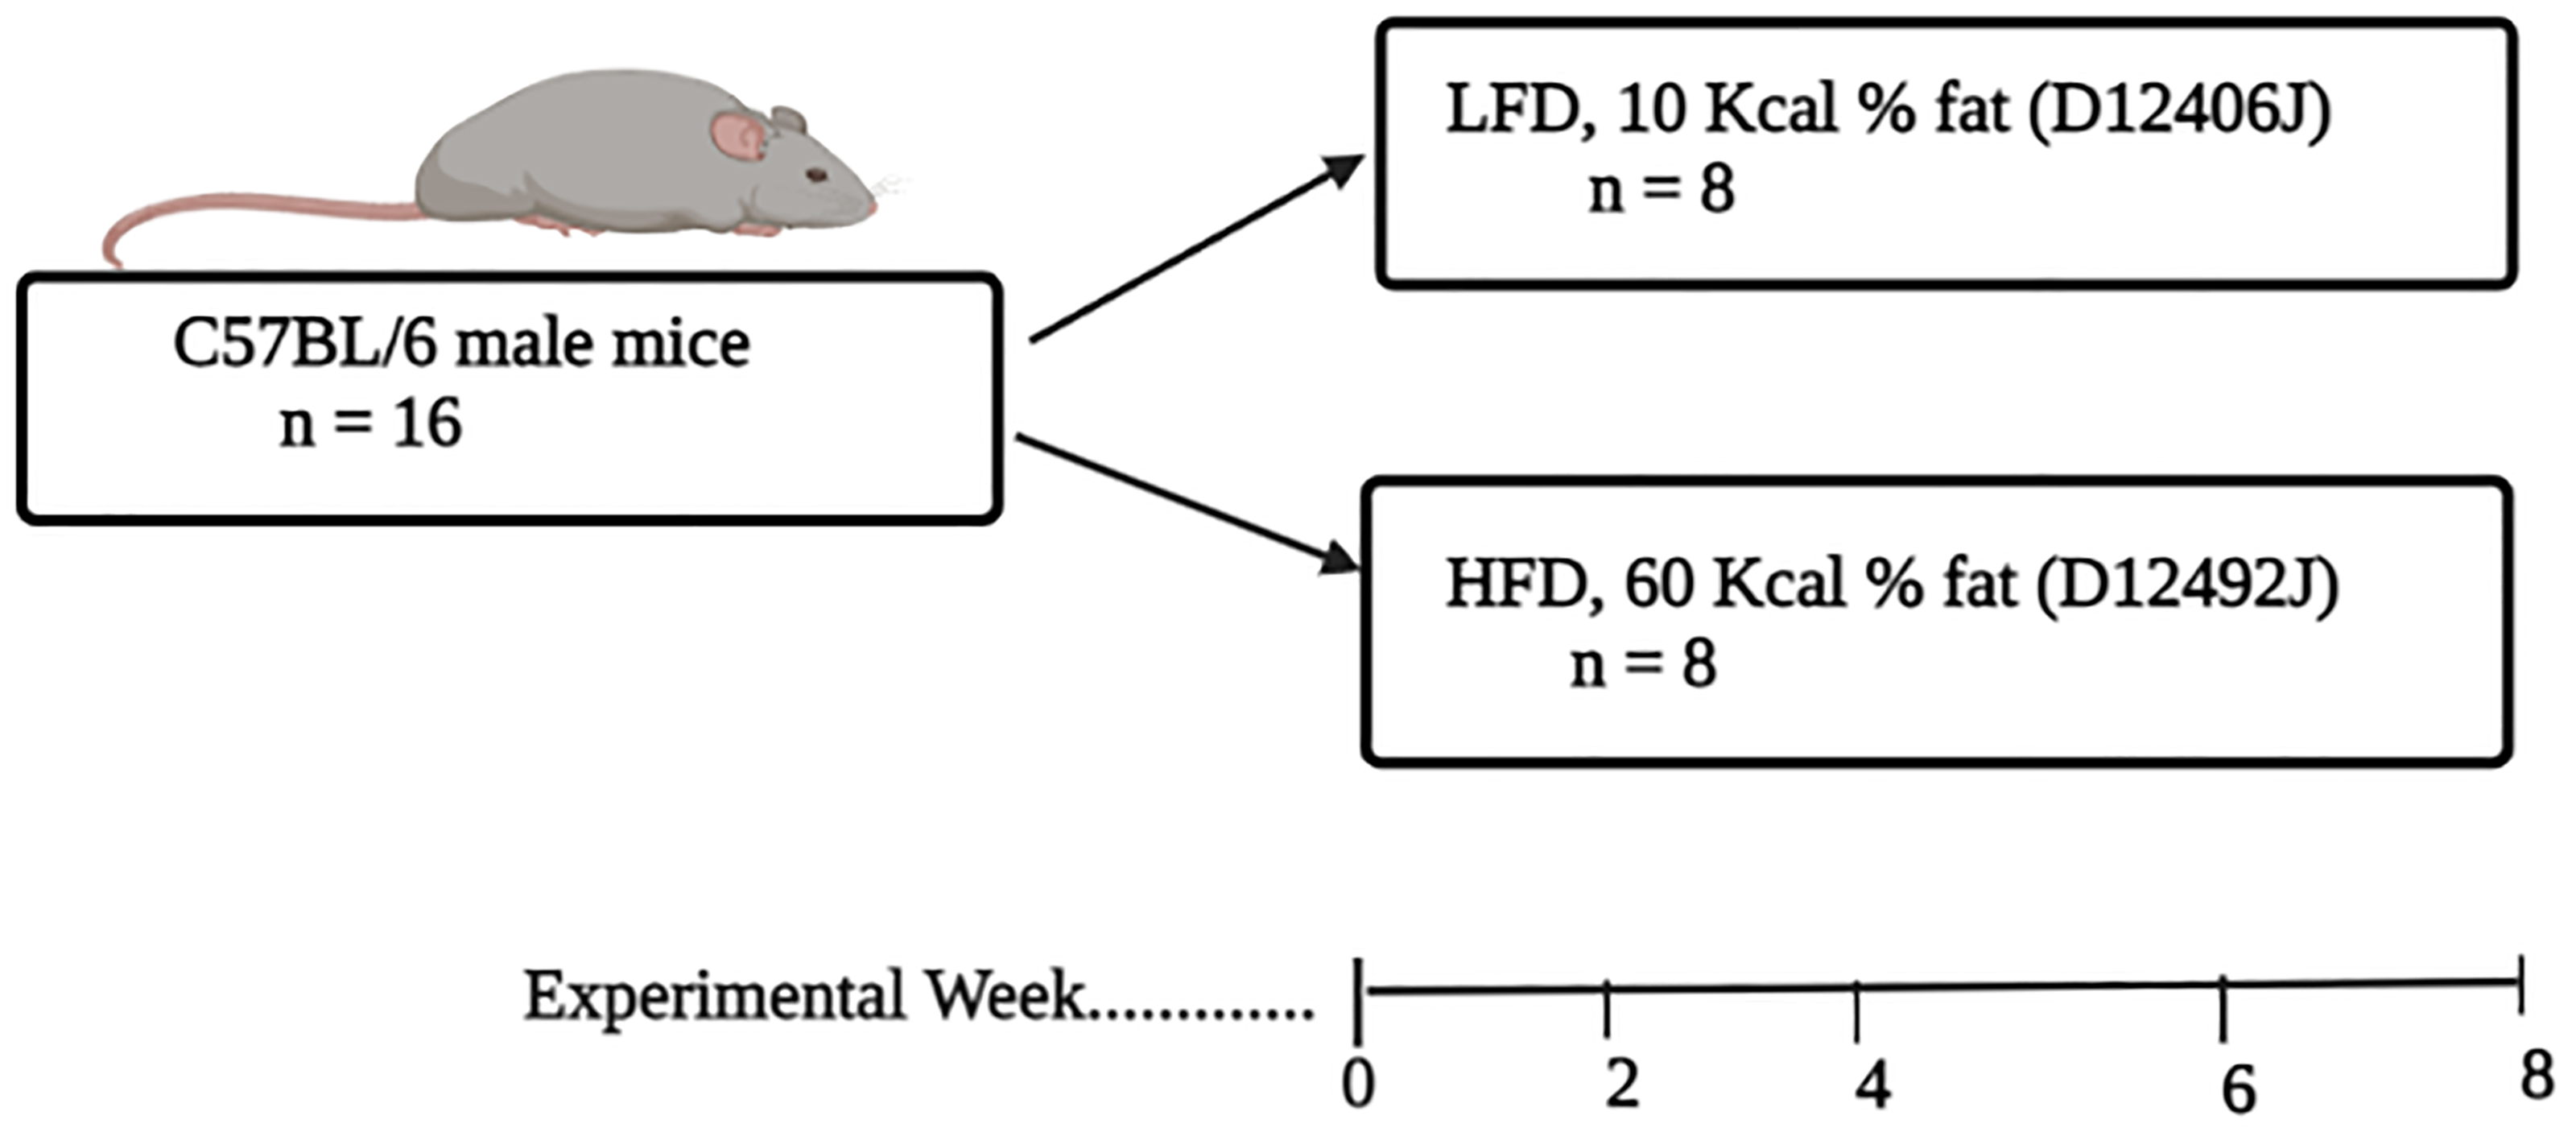
Experimental design. Sixteen C57BL/6 male mice were randomized into two diet groups (n = 8/per group), the diet comprised of a LFD and HFD. The mice were kept on their respective diets for 8 wk. The changes in body masses was monitored on a weekly basis. While oral Glc tolerance testing, insulin levels and other parameters were assessed after 8 wk of diet feeding.
Measurement of haematological markers
All haematological parameters were measured using the Beckman Coulter Ac T diff hemo-analyzer (Beckman Coulter, Brea, CA, USA), as per the manufacturer's protocol. These included the white cell count (WCC), RBC, as well as lymphocytes and platelet counts.
Measurement of metabolic parameters and cytokine profiles
Serum insulin levels were also determined following an 8 h fast, using an ELISA kit (Thermo Fisher, Massachusetts, U.S.A), as per the manufacturer's protocol. While, plasma lipid profiles were determined using high density lipoproteins and low density lipoproteins/very low density lipoproteins, cholesterol assay kit (Abcam, Cambridge, MA, USA), as per the manufacturer's protocol. Furthermore, the levels of serum Th1, Th2 and Th17 cytokines levels were evaluated using the Bio Legend, LEGENDplex™ Mouse Th Cytokine Panel (BD Biosciences, San Diego, USA). While the data was acquired using the BD FACS CANTO II flow cytometer, as previously described. 18
Enumeration and measurement of innate lymphoid cells
We depleted monocytes and granulocytes using the BD™ IMag Cell Separation system. Briefly, we performed positive selection of monocytes (Anti-CD11b Magnetic Particles, Clone M1/70) and granulocytes (Anti-Mouse Ly-6G and Ly-6C Particles, Clone RB6-8C5) as per manufacturer's instructions. The following mouse Abs were used to characterize ILCs CD55-PE (clone: RIKO-5), CD117-PE-Cy5 (clone: 2B8) and CD4-BV42 (clone: GK1.5), CD3-FITC (clone: 17A2) and CD19-APC-Cy7 (clone:6D5) (BD Bioscience, NJ, USA). To enumerate ILC subtypes, we applied a gating strategy based on the lack of expression of the classical lineage markers (CD19, CD3, CD4). We identified the ILC1 subtype as lineage markers negative (Lin-) and CD55 positivity (CD55+) (Figure 2D). Whereas ILC3s were gated and identified as Lin- CD4 positive events (Lin-CD117+, CD4+) (Figure 2F). All the data was acquired using BD FACS CANTO II flow cytometer.
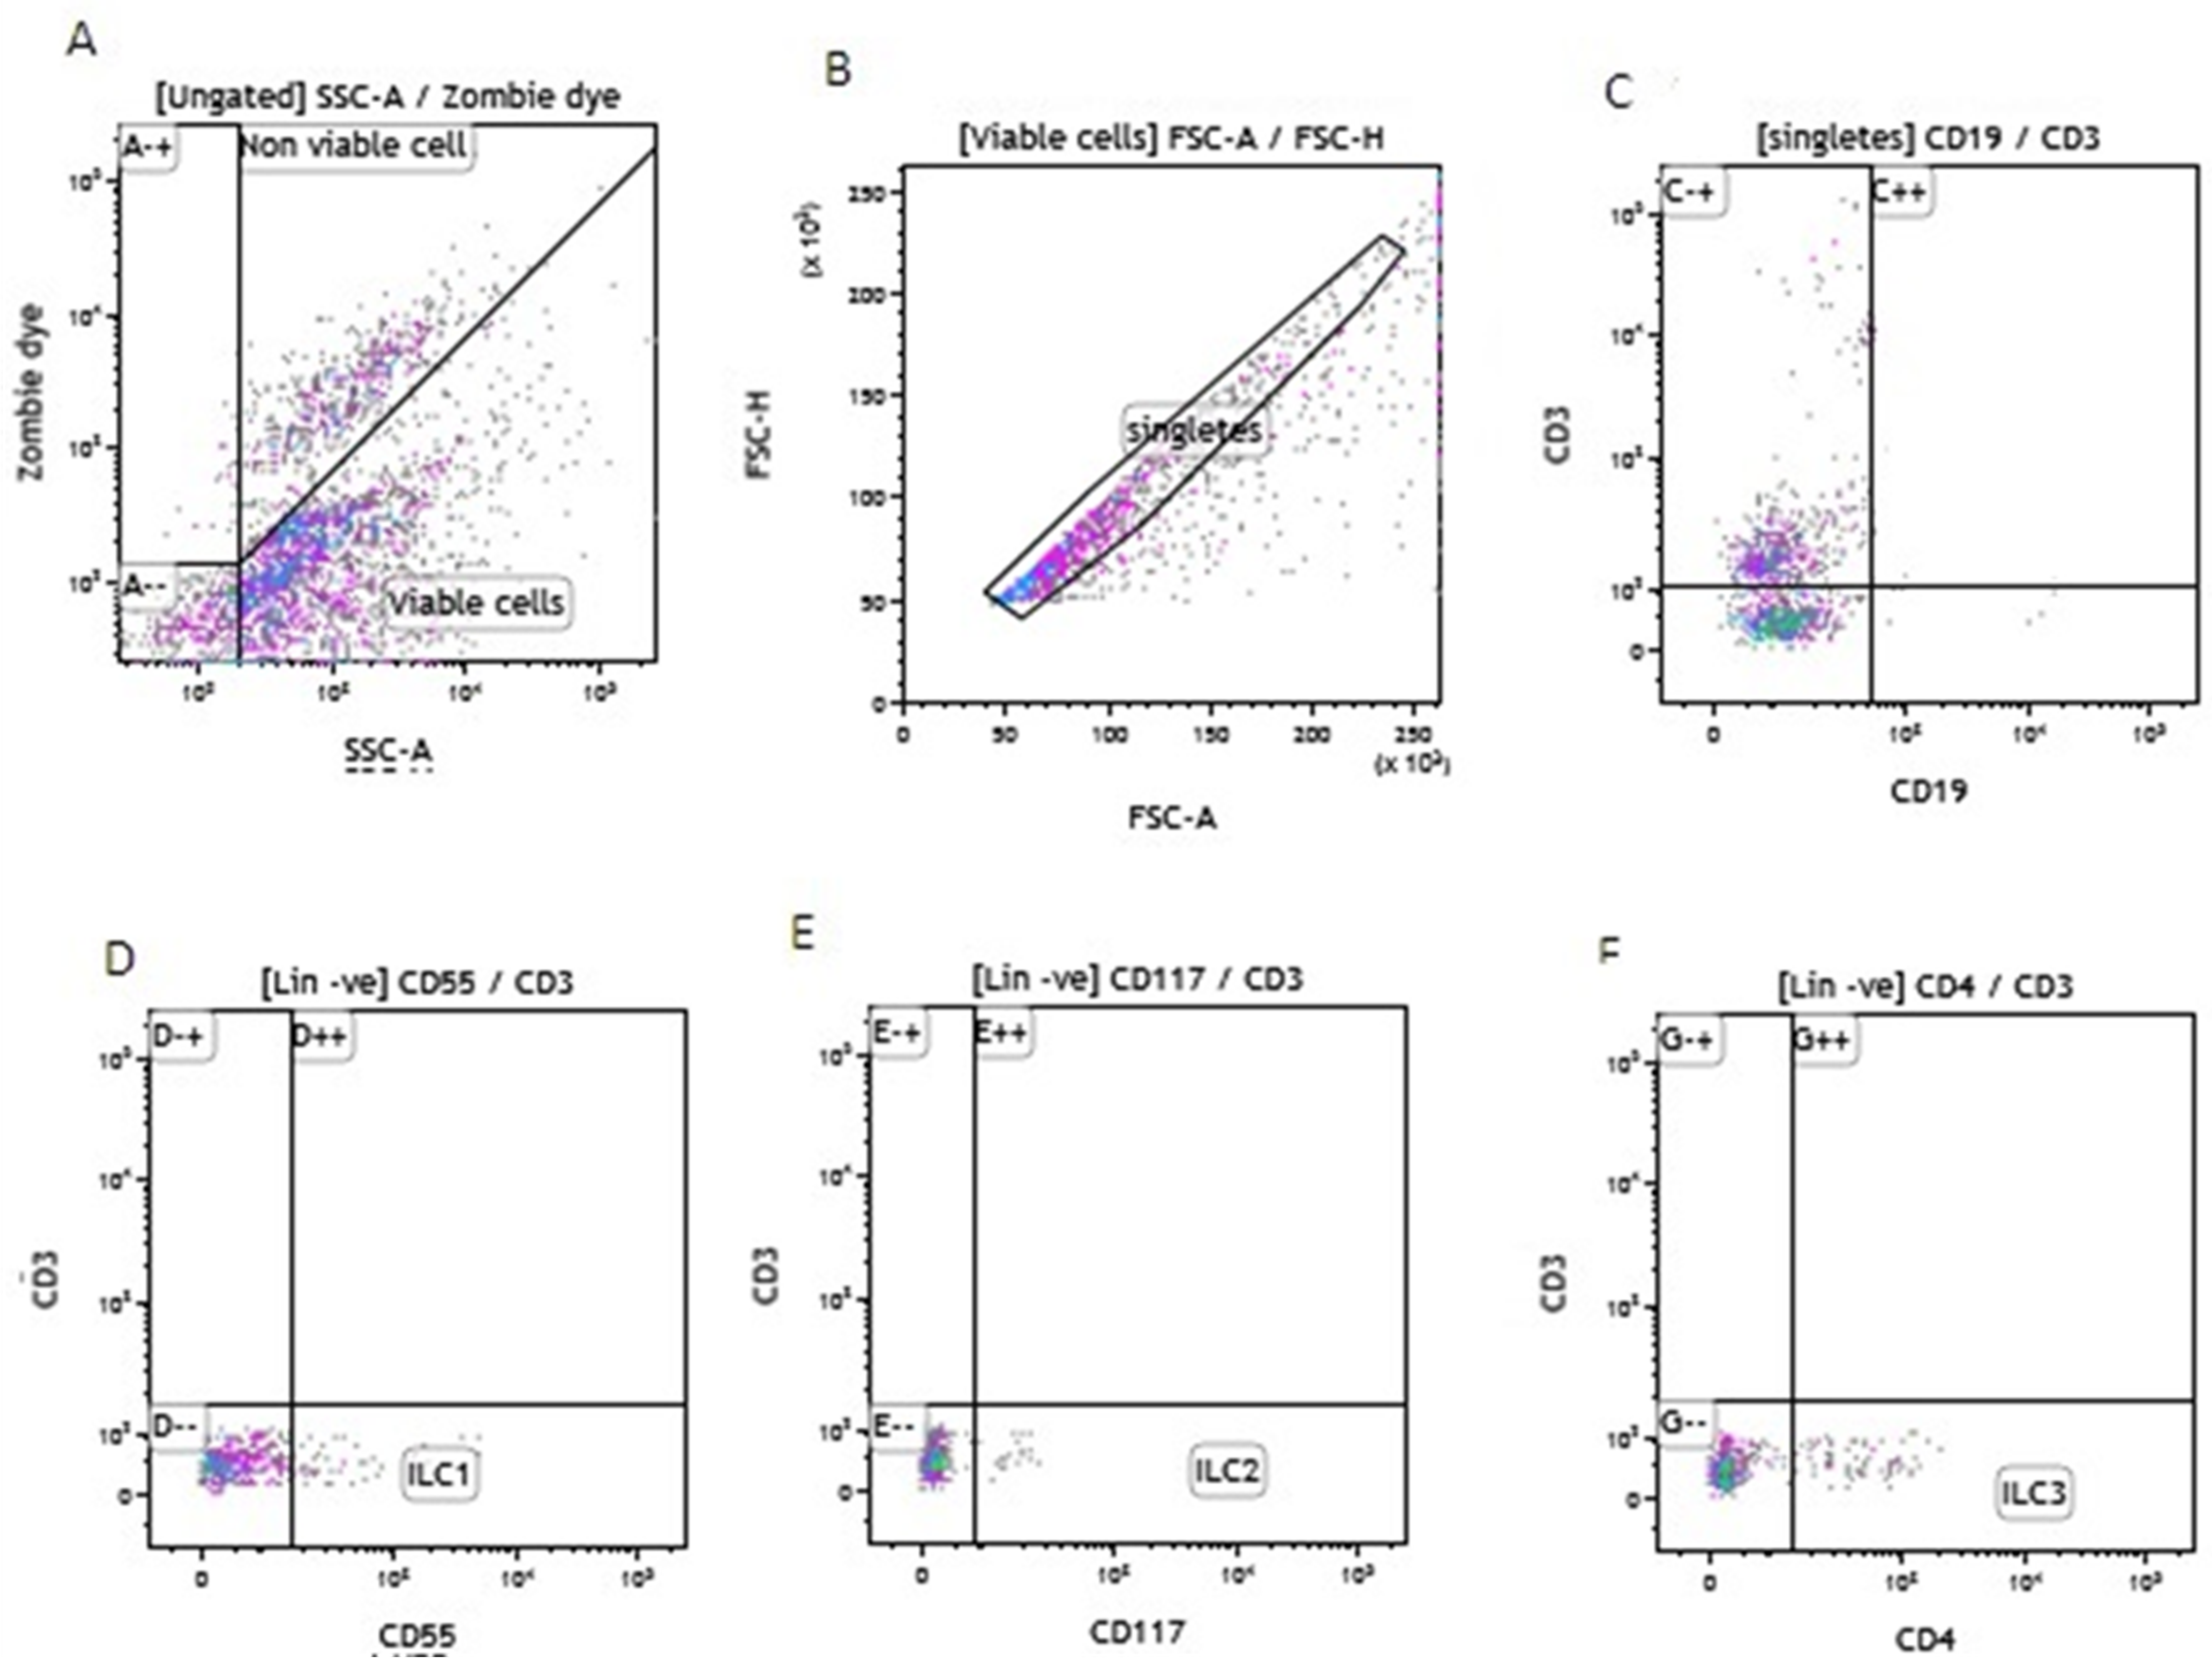
The gating strategy used for the measurement of innate lymphoid cells. Figure A illustrates the viable and non-viable cells from monocyte and granulocyte depleted PBMCs. Figure B shows the singlets gated from the viable cells in A. D, E, and F illustrate ILC1, ILC2 and ILC3 gated from lineage negative viable cells.
Statistical analysis
All statistical analysis was performed using GraphPad Prism version 8 software, (GraphPad Software Inc, San Diego, CA, USA). All non-parametric data was log-transformed to meet the assumptions of normality prior to statistical analysis and reported as mean and standard deviation. Differences between the means of the independent low-fat diet (LFD) and HFD groups were assessed using an unpaired student t-test A P value of ˂ 0.05 was considered as statistically significant. Additionally, we reported on the mean difference (MD), and the 95% confidence of the ILC subtypes across the two groups. The effect size was calculated using Cohens D method, and a Z-score of 0.2, 0.5 and 0.8 was interpreted as small, medium and large effect size respectively. 19
Results
Metabolic changes and Glc tolerance following 8 wk of HFD and LFD feeding
Sixteen male C57BL/6 mice were kept on their respective diets for a period of 8 wk. Although the weighed weekly mass increased during feeding in both the HFD-fed (F(8, 63) = 21.80; P = 0.0001) and LFD-fed animals increased (F(8, 63) = 6.314; P = 0.0001) (Figure 3A and B), the animal masses were comparable at the end of the 8 wk (P > 0.05) (Table 1). Moreover, the 2 h-post-prandial Glc levels were significantly increased in the HFD-fed group compared to LFD group (0.77 ± 0.08 vs. 0.61 ± 0.17; P = 0.04) (Figure 3C). Similarly, the fasting insulin levels were significantly higher in the HFD group compared to LFD group (4.50 ± 0.06 vs. 7.94 ± 1.86; P = 0.01) (Figure 3D).
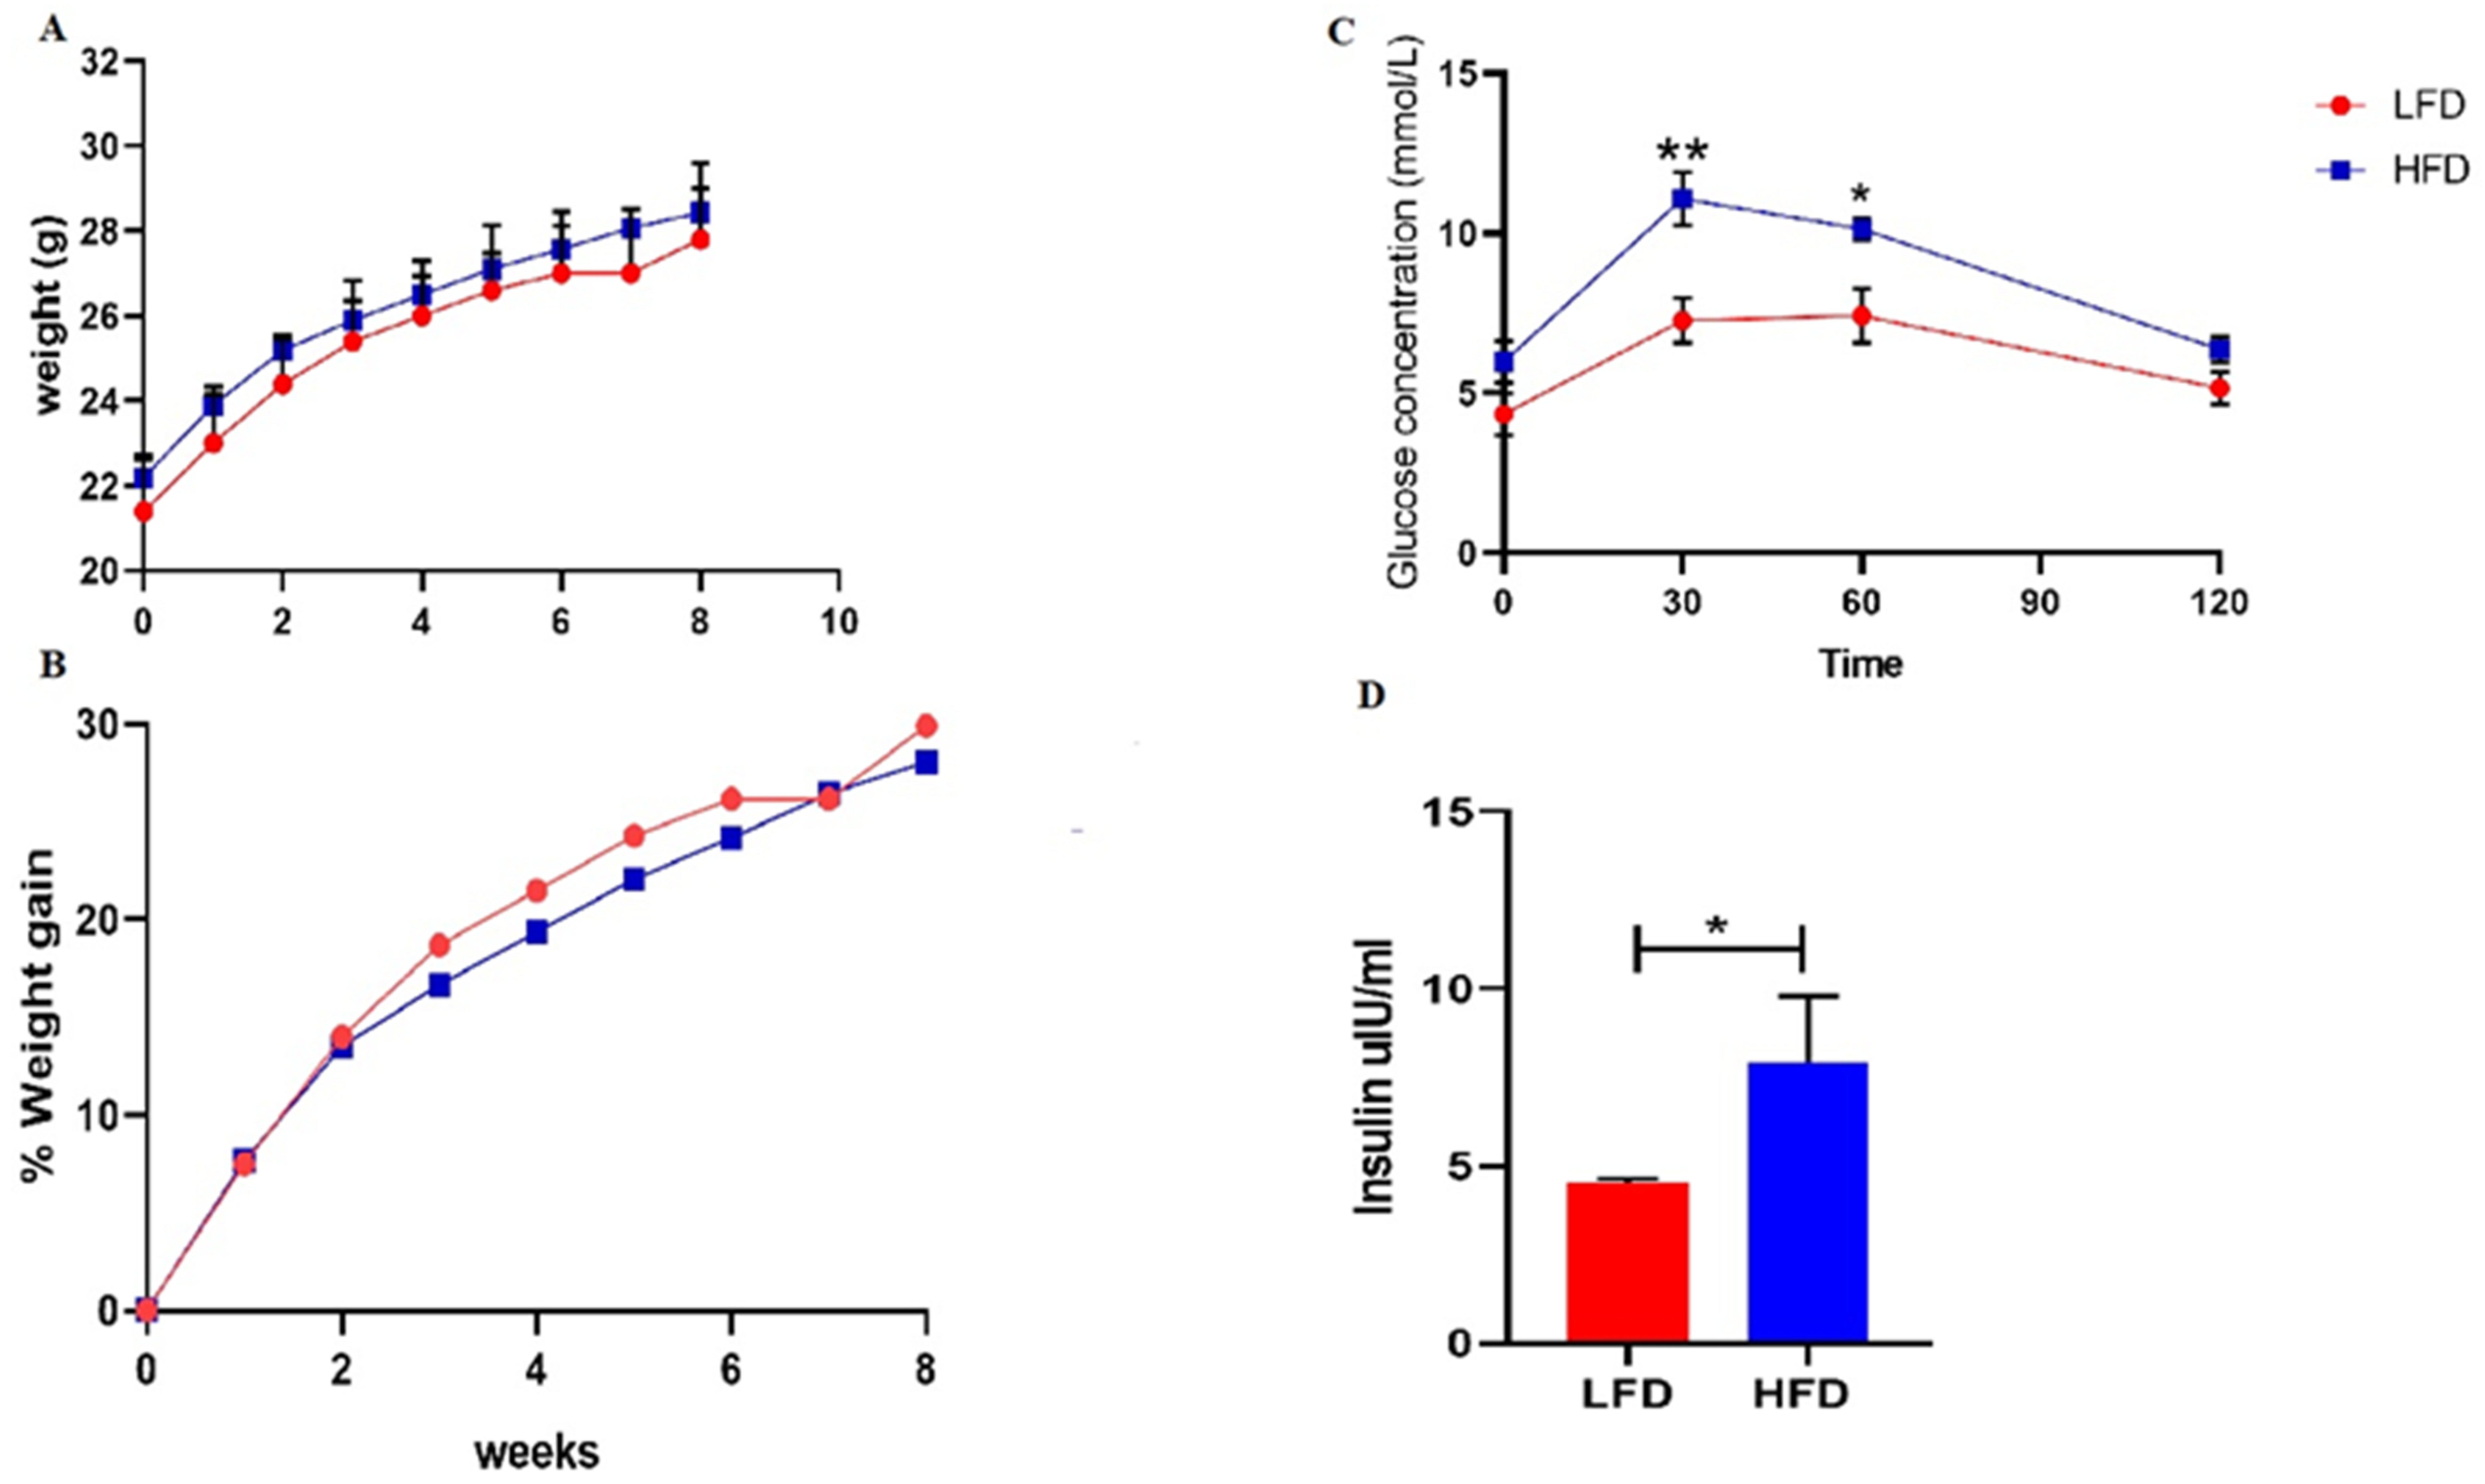
Changes in body masses, Glc tolerance and insulin levels following 8 week HFD feeding. Figure A and B demonstrates weekly body mass gain in HFD compared to LFD group. While Figure C and D illustrate postprandial Glc, and insulin levels following 8 wk of HFD and LFD feeding. Results expressed are means ± SEM (n = 8). * illustrate statistically significant values (P < 0.05) between HFD and LFD.
An overview of metabolic and haematological parameters between HFD and LFD groups after 8 wk of feeding.
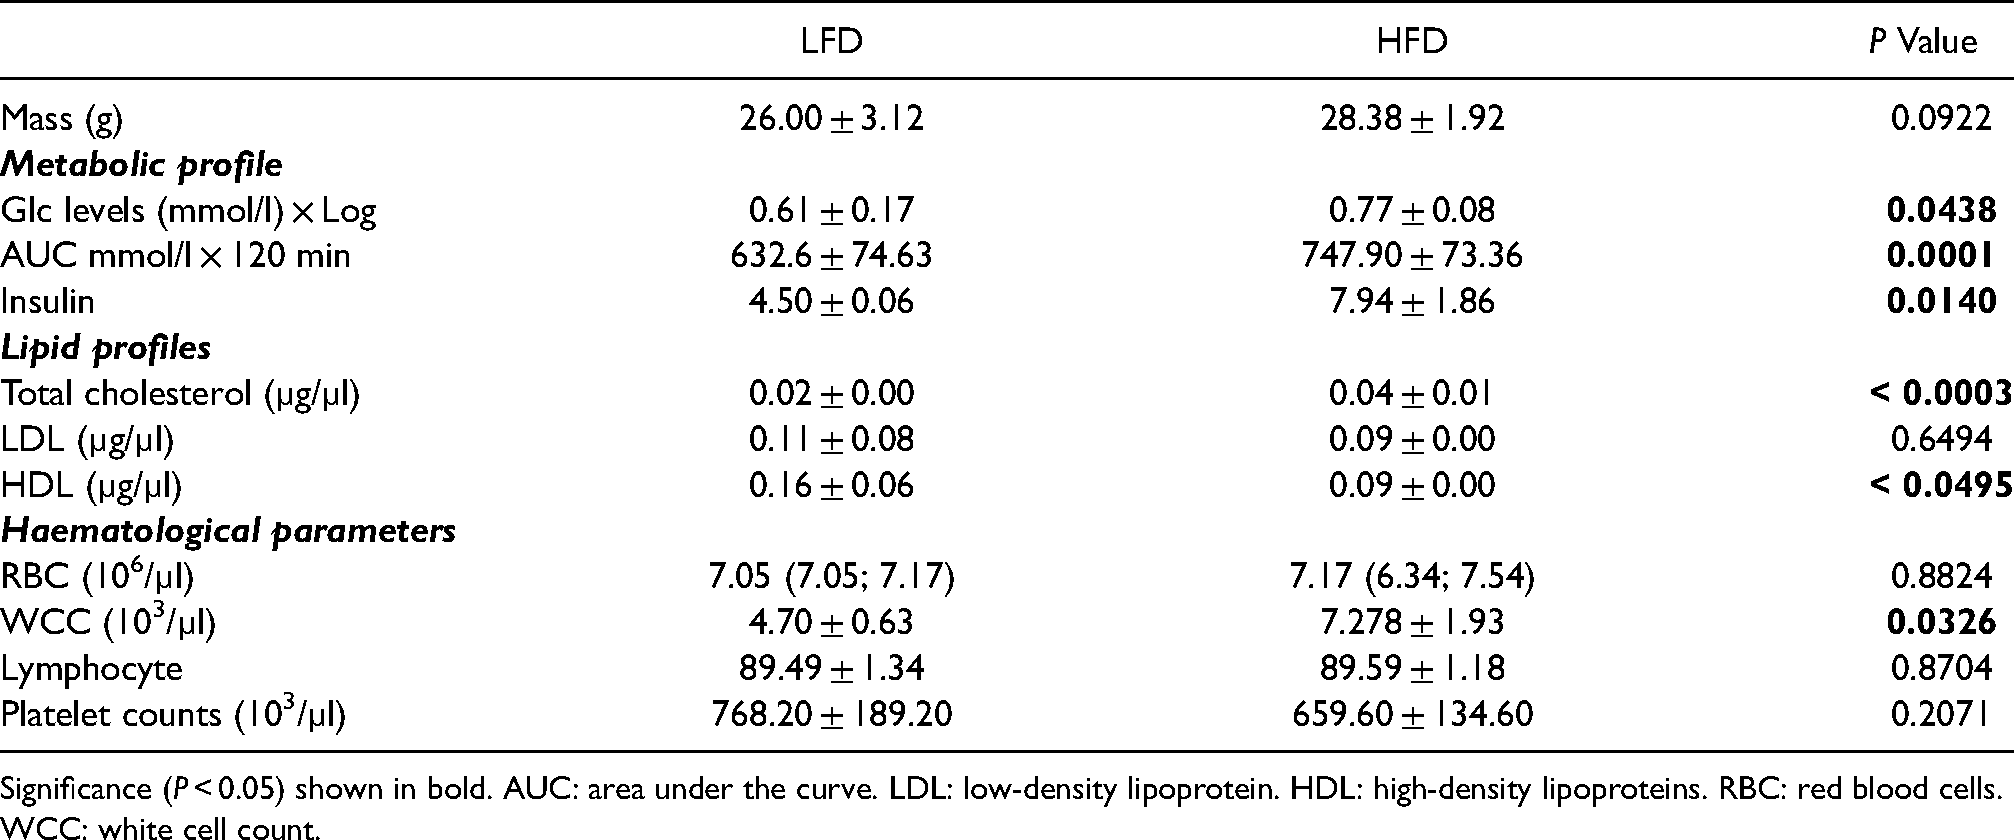
Significance (P < 0.05) shown in bold. AUC: area under the curve. LDL: low-density lipoprotein. HDL: high-density lipoproteins. RBC: red blood cells. WCC: white cell count.
Lipid and haematological parameters following short-term HFD compared to LFD
The lipid profiles were measured after 8 wk of high fat and low-fat diet feeding as shown in Table 1. In this study, we demonstrated that total cholesterol and HDL levels were significantly increased in the HFD compared to the LFD group (P = 0.049). Whereas LDL levels were comparable (P = 0.44). In order to ascertain whether short-term HFD-feeding alters haematological profiles we measured the WCC, RBC, platelet and lymphocyte count following 8 wk of HFD-feeding. Interestingly, WCC was markedly elevated in the HFD group compared to the LFD group (P = 0.003) (Table 1). Notably, the RBC, platelets and lymphocyte counts were comparable (Table 1).
ILC-associated cytokines following short-term HFD compared to LFD
After 8 wk of HFD-feeding, the cytokine levels associated with each ILC subtypes were measured. The HFD group had significantly decreased levels of TNF-α compared to the LFD group (MD: −0.14[−0.28; −0.01]; P = 0.04; Z = −2.80). However, there were no differences in INF-γ levels observed in the HFD group compared to the LFD group (MD: −0.10[−0.24; 0.04]; P = 0.14; Z = −2.00) (Figure 3A). The ILC 2-associated cytokine (IL-5, IL-9, IL-13) levels were similar in HFD compared to LFD group (Figure 3B). The ILC 3 cytokines levels namely IL-17 (MD: 0.09[−0.34;0.52]; P = 0.65; Z = 0.23) and IL-22 were comparable (MD: 0.10[−0.07; 0.27]; P = 0.22; Z = 0.91) (Figure 4C) The levels of peripheral ILCs were comparable in the HFD compared to the LFD. Lastly, the levels of circulating ILC3 were not changed after 8 wk of HFD feeding (2.85 ± 0.51 vs 3.74 ± 1.71, P = 0.1941). To ensure reproducibility of these results, we perfomed a replication study and data is presented in the supplementary table (Table 1S).
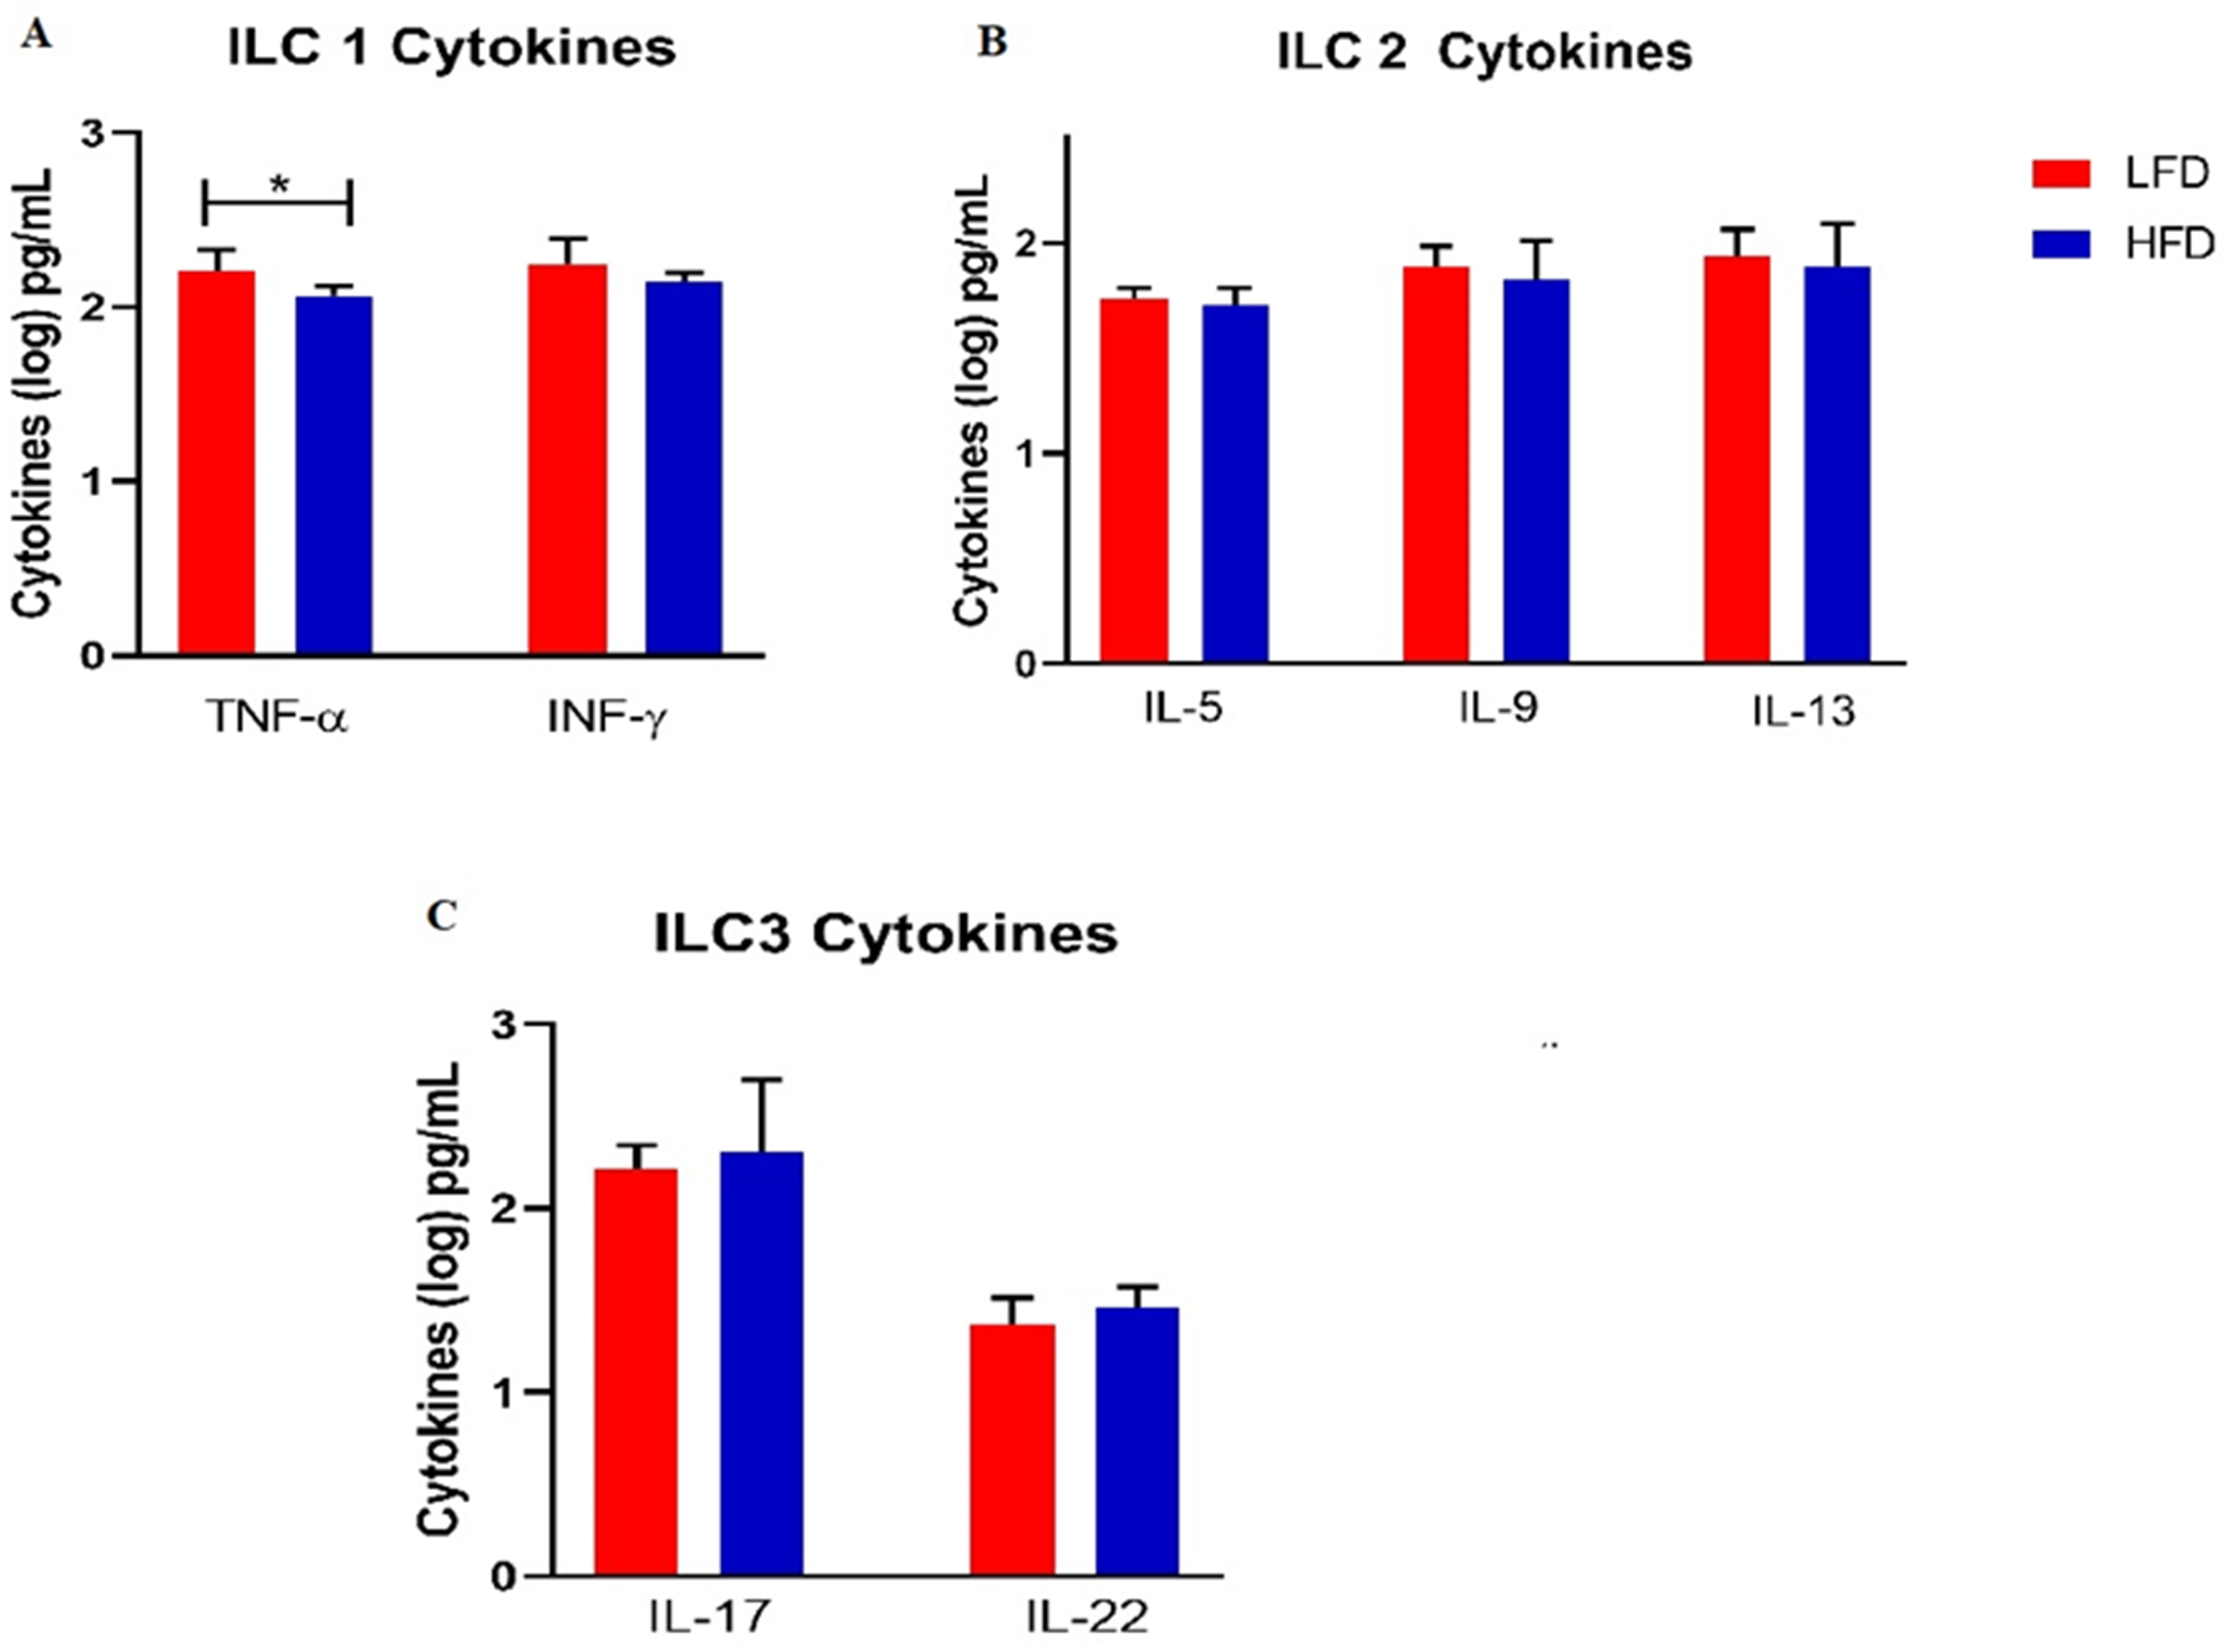
ILC cytokine profile in HFD compared LFD group after the 8 week diet feeding. A, B, and C demonstrate ILC, ILC2 and ILC3 associated cytokine respectively. Significant values (P < 0.05) shown in boldface.
Circulating ILC levels following 13 wk of HFD-feeding
To further determine whether an extended period of HFD-feeding affects the levels of circulating ILCs, we evaluated the changes in circulating ILCs following 13 wk of HFD feeding. Notably, the levels of circulating ILCs1 were higher in the HFD group (31.33 ± 8.04) compared to the LFD group (22.54 ± 1.96), P = 0.02640 (Table 2). Moreover the levels of circulating ILC2s remained comparable between HFD (4.77 ± 1.13) and LFD group (4.10 ± 0.64), P = 0.2364. Lastly, the levels of circulating ILC3s were similar in the HFD group (21.36 ± 9.21) compared to the LFD group (16.21 ± 8.11), P = 0.3756 (Table 2).
Circulating innate lymphoid cell levels following 13 wk of HFD-feeding.
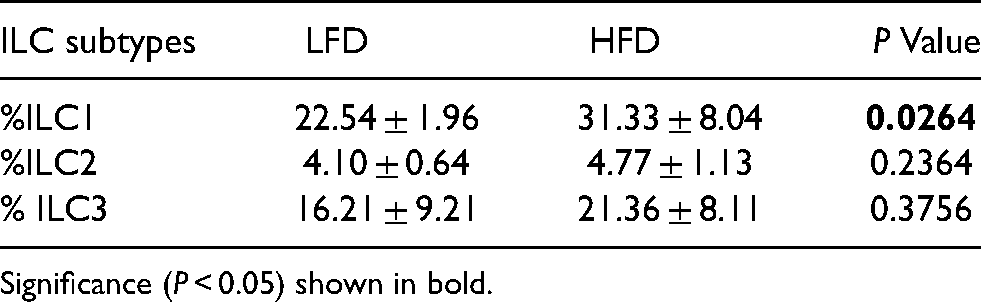
Significance (P < 0.05) shown in bold.
Discussion
The primary aim of this study was to enumerate the levels circulating ILCs in a HFD-induced pre-diabetic mouse model. We also aimed to evaluate the cytokine profiles associated with each of the ILC subtypes in pre-diabetes. In addition, we also evaluated total cholesterol and haematological indices after 8 wk of HFD feeding. In this study, a HFD was used to induce pre-diabetes in a mouse model. Pre-diabetes was characterized by impaired Glc tolerance and significantly elevated levels of insulin. The reported results are consistent with our previous results of HFD-induced Glc intolerance.16,20 In our study impaired Glc metabolism and elevated insulin levels were observed in the HFD group and these were independent of mass gain following 8 wk of HFD-feeding. Notably, elevated levels of ILC2 activity is associated with impaired Glc tolerance and dysregulated cholesterol in patients with metabolic syndrome. 15 However, evidence on the role of these diverse ILCs and their associated cytokines in the early development of T2D remains elusive. This experimental model remains relevant since previous human studies have shown a positive correlation between Glc tolerance and circulating ILC1 levels. 21
Briefly, ILCs are one of the major components of the innate immune system 22 and regulate the secretion of several pro-inflammatory cytokines.23,24 ILCs are classified into 3 groups (ILC1, ILC2, and ILC3) based on their primary function which is similar to that of Th1, Th2 and Th17.14,24 The current study demonstrated that the peripheral blood ILC1 levels were comparable between HFD and LFD after 8 wk feeding. However these were elevated after 13 wk of HFD-feeding. Notbly, ILC2 and ILC3 levels remained comparable even during an extended period of HFD-feeding. These findings suggest that although ILC2 and ILC3 evels remain unchanged following HFD-feeding, marked changes in ILC1 levels may be observed following 13 wk of HFD. This further suggests that in HFD-diet induced Glc tolerance the duration of feeding may be crucial factor in understanding the changes in peripheral ILC subtypes. We also established that the ILC3 levels in peripheral blood were comparable after 8 wk short term HFD feeding and these findings were also reproduced in our replication study. Importantly, only a few studies have shown that elevated ILC1 and ILC2 contribute to insulin resistance and in obesity and T2D. 25 Additionally, ILC2 levels are decreased in obesity while a reduction ILC1 levels is associated with inflammation, impaired Glc tolerance and insulin resistance. 26 To our knowledge these is the first study to report on the ILC3 profiles in HFD mouse model of pre-diabetes.
There is a strong link between ILC mediated inflammation and metabolic disease. In fact, chronic inflammation which leads to insulin resistance and as a consequence overt T2D, is attributed to impaired immune function.26,27 In the present study, we evaluated the changes in systemic ILC-associated cytokine profiles in a state of pre-diabetes. Our findings showed that following the short-term HFD-feeding, the levels of ILC1 pro-inflammatory cytokines such as TNF-α were decreased. However, HFD-feeding did not alter the levels of IFN-γ pre-diabetes model which is an early phase in development of T2D. In contrast, increased IFN-γ levels were reported following longer duration of HFD-feeding duration of 12–16 wk in a diet-induced obesity model. 28 Increased IFN-γ levels would promote the inhibition of ILC2 activation in adipose tissue leading to reduced production of anti-inflammatory cytokines. 29 In our study, it was apparent that short-term HFD-feeding did not affect anti-inflammatory ILC2 cytokine levels (IL-5, IL-9, IL-13). This may suggest that in T2D, ILC2 responses remain unaltered, although IL-5 and IL-13 cytokines may play an indirect role in the development of T2D related complications. As the ILC2-associated cytokines such as IL-13, regulate Glc metabolism and anti-inflammatory responses,4,30 while IL-5 orchestrates the recruitment and activation of eosinophils in adipose tissue and ultimately promoting insulin sensitivity. 27 The total lymphocyte count, WBC did not change after the 8 wk of HFD feeding as is the case with ILC subtypes in the current study.
Here, we demonstrated that following short-term HFD-feeding, the pro-inflammatory IL-17 and IL-22 which are ILC3-associated cytokines31,32 are not altered in a state of impaired Glc tolerance. The current study only evaluated ILC levels in peripheral blood and this limits our understanding of the role of ILCs in metabolic organs. However,previous studies have already provided insght on the role of ILCS in metabolic organs including adipose tissue33,34 and in the lungs. Future studies profiling ILC subtypes in metabolic tissues such as adipose tissues, liver and kidney are recommended. Furthermore, the cytokine levels were measured from serum and the source of these cytokines may be derived variety of cell lineages.
Conclusion
Short-term HFD-feeding induces metabolic dysfunction as indicated by increased blood Glc, insulin and total cholesterol levels. However, the metabolic changes do not alter peripheral blood ILC subtypes and their subsequent cytokine profiles.
Supplemental Material
sj-docx-1-ini-10.1177_17534259211053634 - Supplemental material for Circulating innate lymphoid cell subtypes and altered cytokine profiles following an atherogenic high-fat diet
Supplemental material, sj-docx-1-ini-10.1177_17534259211053634 for Circulating
Footnotes
Ethics approval
The study was approved by the University of KwaZulu Natal's Animal Research Ethics Committee (AREC) with the ethics number: AREC/081/018D.
Declaration of conflicting interests
The author(s) declared the following potential conflicts of interest with respect to the research, authorship, and/or publication of this article: BBN is also a University of KwaZulu-Natal (UKZN) Developing Research Innovation, Localisation and Leadership in South Africa (DRILL) fellow. DRILL, is a NIH D43 grant (D43TW010131) awarded to UKZN in 2015 to support a research training and induction programme for early-career academics. PV Dludla was partially supported as a Post-Doctoral Fellow by funding from the South African Medical Research Council (SAMRC) through its division of Research Capacity Development under the Intra-Mural Postdoctoral Fellowship Programme from funding received from the South African Treasury.
Funding
The author(s) disclosed receipt of the following financial support for the research, authorship, and/or publication of this article: This work was supported by the University of KwaZulu-Natal, College of Health Sciences [Grant Number: 592781] and the National Research Foundation of South Africa (grant number 10107519).
Supplemental material
Supplemental material for this article is available online.
References
Supplementary Material
Please find the following supplemental material available below.
For Open Access articles published under a Creative Commons License, all supplemental material carries the same license as the article it is associated with.
For non-Open Access articles published, all supplemental material carries a non-exclusive license, and permission requests for re-use of supplemental material or any part of supplemental material shall be sent directly to the copyright owner as specified in the copyright notice associated with the article.