
Abstract
The sensitivity of pigs to deoxynivalenol (DON) might be increased by systemic inflammation (SI), which also has consequences for hepatic integrity. Liver lesions and a dys-regulated gene network might hamper hepatic handling and elimination of DON whereby the way of initiation of hepatic inflammation might play an additional role. First and second-pass exposure of the liver with LPS for triggering a SI was achieved by LPS infusion via pre- or post-hepatic venous route, respectively. Each infusion group was pre-conditioned either with a control diet (0.12 mg DON/kg diet) or with a DON-contaminated diet (4.59 mg DON/kg diet) for 4 wk. Liver transcriptome was evaluated at 195 min after starting infusions. DON exposure alone failed to modulate the mRNA expression significantly. However, pre- and post-hepatic LPS challenges prompted transcriptional responses in immune and metabolic levels. The mRNAs for B-cell lymphoma 2-like protein 11 as a key factor in apoptosis and IFN-γ released by T cells were clearly up-regulated in DON-fed group infused with LPS post-hepatically. On the other hand, mRNAs for nucleotide binding oligomerization domain containing 2, IFN-α and eukaryotic translation initiation factor 2α kinase 3 as ribosomal stress sensors were exclusively up-regulated in control pigs with pre-hepatic LPS infusion. These diverse effects were traced back to differences in TLR4 signalling.
Keywords
Introduction
The hepatic portal vein drains large parts of the digestive tract to the liver and consequently provides nutrients to be processed for metabolic purposes by hepatocytes, highlighting the liver as a central metabolic organ. 1 Not only are nutrients transported to the liver, but also Ags and xenobiotics are recognized and processed by non-parenchymal (e.g. Kupffer cells, as the organ-resident macrophages, hepatic stellate cells, liver sinusoidal endothelial cells, and other immune cells) and parenchymal (hepatocytes, cholangiocytes) cells. 2 While xenobiotics mainly originate from feed, Ags or non-self-compounds might be derived both from feed and from resident intestinal microbiota. Therefore, the host is also permanently exposed to bacterial compounds, such as endotoxins, most notably to small amounts of LPS. 2 Gut-derived LPS are well known for inducing an inflammatory response by immune-competent hepatic non-parenchymal and parenchymal cells when immune homeostasis and endotoxin tolerance are disturbed. 2 Thus, these cells are acting closely together in an orchestrated manner leading to endotoxin tolerance or inflammation, and indicate the liver both as a secondary immunological organ and a second line of defence located beyond the intestinal mucosal barrier. Therefore, any disturbance of the intestinal mucosal barrier might be sensed by the liver, ultimately resulting in a modified immune answer and eventually mounting a local and systemic inflammatory response.
Deoxynivalenol (DON) is a mycotoxin formed by several Fusarium species and represents a common contaminant of feed and food. 3 , 4 DON has been discussed to compromise the intestinal mucosal barrier by influencing tight junction and other proteins forming a selective barrier at the paracellular space. However, experimental results are not conclusive so far. Some authors reported DON effects on tight junction proteins in vitro and in vivo.5–7 Other studies failed detecting such influences. 8 , 9 Moreover, pigs fed a DON-contaminated diet for approximately 4 wk showed comparable LPS levels both in portal and jugular blood compared with the control group, suggesting that DON does not trigger an enhanced LPS transfer from gut to liver. 10 Furthermore, LPS levels in jugular blood of both treatment groups were reduced compared with the concentrations measured in portal blood. Together with the observation that both unchallenged groups did not mount a systemic inflammatory response, the role of the liver in LPS clearance and tolerance is highlighted. 11 , 12 DON itself is mainly metabolized by gut microbiota, intestinal mucosa and liver. 13 As a xenobiotic DON is not only processed by the liver, but this organ might be a target for toxic effects of DON as well. Again, experimental results are controversial and range from absent DON effects to DON-associated hepatic histopathological lesions.14–16
To further explore the role of the liver in the interplay between DON and LPS we hypothesized that a chronic dietary exposure to DON (1) would modulate the mRNA expression of hepatic genes involved in mediating the toxicity of DON as described for immune cells in vitro and in vivo; and (2) would predispose the liver for a subsequent LPS challenge differently depending on the route of LPS entry, i.e. pre- or post-hepatic, leading to tolerance or exacerbating the LPS-induced systemic inflammation (SI) at the mRNA level.
For testing these hypotheses, we used a standardized pig model which included two feeding groups fed either a control diet with background DON contamination (CON, C, first letter in group designation; 0.12 mg DON/kg diet) or a diet contaminated with 4.59 mg DON/kg (D, first letter in group designation) which is approximately five times higher than the critical dietary DON concentration of 0.9 mg/kg for pigs. 17 To exclude DON effects on voluntary feed and consequently energy and nutrient intake, both groups were fed similar feed amounts over the entire exposure period of 4 wk. To be independent of an unpredictable LPS transfer across the intestinal mucosa, the feeding groups were further subdivided into infusion groups which were exposed either to LPS (L, second or third letter in group designation) or to physiological saline as control (C, second or third letter in group designation) via the pre-hepatic portal vein (third letter in group designation) and the post-hepatic jugular vein (second letter in group designation), finally resulting in six treatment groups (CCC, CCL, CLC, DCC, DCL, DLC). Thus, pigs were in a feeding steady state regarding DON exposure and acutely challenged by LPS, either pre- or post-hepatic. Not-perfused liver samples of all animals were collected 195 min after the beginning of the 1 h-lasting LPS infusion and processed for transcriptome analysis. Accordingly, the generated data represent the net result of the action of all hepatic and non-hepatic cells involved in the early stage of the acute-phase response (APR) in the liver.
Materials and methods
Animal trial
Liver samples used for the present investigations originated from an experiment described in detail elsewhere. 11 , 12 , 14 , 18 , 19 In short, 20 pigs were fed a DON-contaminated diet (4.59 mg DON/kg) over a period of 29 d restrictively twice a day, while 23 pigs served as a control group, that received a diet with background DON contamination (0.12 mg DON/kg diet) in a similar manner (Figure 1). At d 27 all pigs were surgically equipped with indwelling catheters as described elsewhere. 12 On d 29 the two feeding groups were further subdivided into three infusion groups each. Thus, the respective groups received LPS infusion (7.5 µg LPS/kg body mass (BM); Escherichia coli LPS, O111:B4, Sigma-Aldrich, Taufkirchen, Germany)) either into the pre-hepatic portal vein (Vena portae hepatis) or into the post-hepatic jugular vein (Vena jugularis externa) while the control groups were solely infused with 0.9% NaCl. Infusions were completed after 1 h. All pigs were sacrificed 195 min after the beginning of the infusion. Liver tissue samples were collected from Lobus hepatis dexter medialis and directly frozen in liquid nitrogen. Samples were stored at –80°C until further processing.
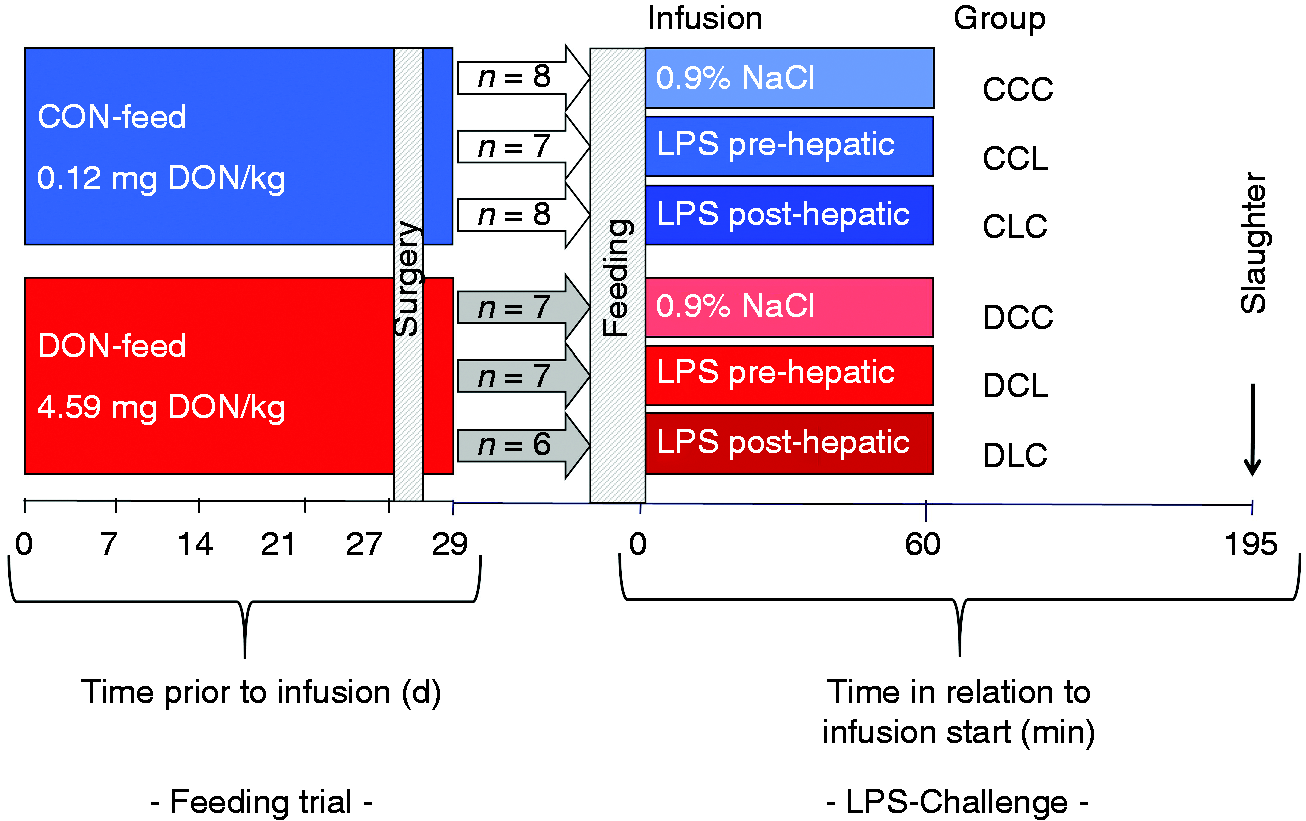
Experimental design as described previously. 19
RNA preparation
Deep-frozen tissue was first homogenized in liquid nitrogen using a ball mill. The resulting powder was kept under liquid nitrogen until RNA purification using the NucleoSpin® RNA kit (Macherey-Nagel GmbH & Co. KG, Düren, Germany). Quality and integrity of the isolated RNA was controlled with a NanoDrop™ 1000 and denaturing agarose gel electrophoresis. 20 RNA was stored at –80°C until further processing.
Microarray processing
For genome-wide analyses of the pig transcriptome, single-stranded cDNA was synthesized, biotin-labelled and fragmented (GeneChip™ WT PLUS Reagent Kit) according to the manufacturer’s instructions (Affymetrix, Santa Clara, CA, USA). 21 Individual samples (n = 43) were hybridized on snowball arrays. Each of the six treatment groups was represented by 6–8 arrays. The arrays were processed following the manufacturer’s instructions using the GeneChip Hybridization, Wash and Stain Kit (Affymetrix, Santa Clara, CA, USA). Raw data were generated with Affymetrix GCOS 1.1.1 software. Data were deposited in a MIAME-compliant database, the National Center for Biotechnology Information Gene Expression Omnibus (www.ncbi.nlm.nih.gov/geo; accession number: GSE171991). 22
Data analyses
The assignments of probes to probe-sets and their corresponding annotation information (Sus scrofa 11.1 genome map release 106) were compiled using the workflow according to Hadlich et al. 23 Analysis was carried out using R scripts, including the oligo package. 24 The quality of the microarray data was assessed as proposed previously. 25 The appropriate quality control criteria were met by all samples. The raw data were normalized using the Robust Multichip Average approach (Log2). To improve statistical power, uninformative data were excluded from further data processing, such as control probe-sets, internal controls, and probe-sets with low intensity values (mean < 2.5) or low standard deviation (sd < 0.27). 26 The filtering process resulted in 15,140 probe-sets that were used for further analyses. Relative mRNA differences were analysed with a linear model that included the effect of treatment (SAS version 9.4; SAS Institute, Cary, NC, USA). To correct for multiple testing in large datasets, P-values were converted to a set of q-values. 27 The level of significance for differentially expressed genes (DEGs) was set at q ≤ 0.001 and P ≤ 0.05. DEGs were split into subsets with higher abundance upon LPS application and lower abundance upon LPS application. Association of DEGs from both subsets with DON contamination and location of LPS application was conducted by Venn analysis using Venny 2.1.0. 28 Functional annotation, classification and clustering of DEGs were performed using the Database for Annotation, Visualization and Integrated Discovery (DAVID) v6.8 with default settings and a false discover rate (FDR) cutoff of 10%. 29 Visualizations of comparisons of gene expression to existing literature data were conducted using RStudio Version 1.1.456 with R version 3.6.0 and the packages ggpplot2 and plotly.30–32
qRT-PCR
The procedure for the qRT-PCR is described by Dänicke et al. in detail. 33 Briefly, RNA was transcribed into cDNA using the qScript™ cDNA Synthesis Kit (Quanta Biosciences™, Inc., Gaithersburg, MD, USA) according to the manufacturer’s protocol. Gene-specific primer pairs (supplemental material Table S2) were selected with Primer-BLAST and acquired from Eurofins Genomics GmbH (Ebersberg, Germany). 34 Corresponding PCR products were validated by melting curve analysis, agarose gel electrophoresis and sequencing. For gene expression evaluation, duplicate 15 µl PCR reactions using iTaq™ Universal SYBR® Green Supermix (Bio-Rad Laboratories, Hercules, CA, USA) were run on a CFX96™ Real-Time PCR System (Bio-Rad Laboratories, Hercules, CA, USA) with primer concentrations listed in Table S2 and the cDNA equivalent to 22.5 ng RNA. PCR conditions included an initial denaturation step of 30 s at 95°C, 40 cycles of 5 s, denaturation at 95°C and 30 s of annealing and elongation at 60°C, and a melting curve analysis from 60°C to 95°C in 0.5°C increments; each run was controlled by a no-template control in triplicate. Cq-values of target and reference genes were determined using CFX Manager™ Software 3.1 (Bio-Rad Laboratories, Hercules, CA, USA) and gene expression was analysed with qbase+ (Version 3.1, Biogazelle, Zwijnaarde, Belgium). Normalized expression levels were calculated using the geometric mean of the reference genes for GAPDH, hypoxanthine phosphoribosyltransferase (HPRT) and TATA box binding protein (TBP) (mean reference target stability M value of 0.36) considering the primer pair-specific efficiencies (Table S2) determined with a five-point dilution series of a cDNA sample mixture of the experiment.
Results
Microarrays of hepatic gene expression in context of DON and LPS exposure
The analysis of liver gene expression resulted in no significant changes upon DON contamination in the feed in the groups receiving a physiological saline infusion instead of an LPS infusion (DCC vs. CCC), whereas LPS challenge had an extensive impact on the liver gene expression. The changes in gene expression under LPS challenge were mostly independent of LPS infusion location and DON contamination of feed. A general overview on liver gene expression via the microarray dataset in context of a challenge by LPS infusion showed 1114 DEGs that had increased mRNA abundance upon LPS infusion (Figure 2a). Among these DEGs, 77.1% (858) were not related to infusion location or feeding group, while 12.2% (136) only showed increased mRNA abundance in the groups fed a control diet and 8.6% (96) only displayed increased mRNA abundance in the groups fed the DON-contaminated diet. Moreover, 5.1% (57) of the DEGs showed increased mRNA abundance only upon LPS infusion into the hepatic portal vein, while 10.1% (112) displayed increased mRNA abundance only upon infusion into the jugular vein (Figure 2a). In contrast, 1771 DEGs had lower mRNA abundance after LPS infusion. In detail, 72.7% (1288) of these repressed genes were not related to infusion site or DON contamination of feed, while 15.1% (268) exclusively displayed lower mRNA abundance in the groups fed a control diet and 10.3% (183) only showed decreased mRNA abundance in the groups fed the DON-contaminated diet (Figure 2b). Additionally, 7.6% (135) of the DEGs with lower mRNA abundance only occurred upon LPS infusion into the portal vein, whereas 12.1% (214) only occurred after LPS infusion into the jugular vein (Figure 2b). Remarkably, overall relative proportions of DEGs were apparently higher in groups that received the control diet than in groups fed the DON-contaminated diet, and also infusion of LPS into the portal vein resulted in a lower number of DEGs than infusion into the jugular vein.
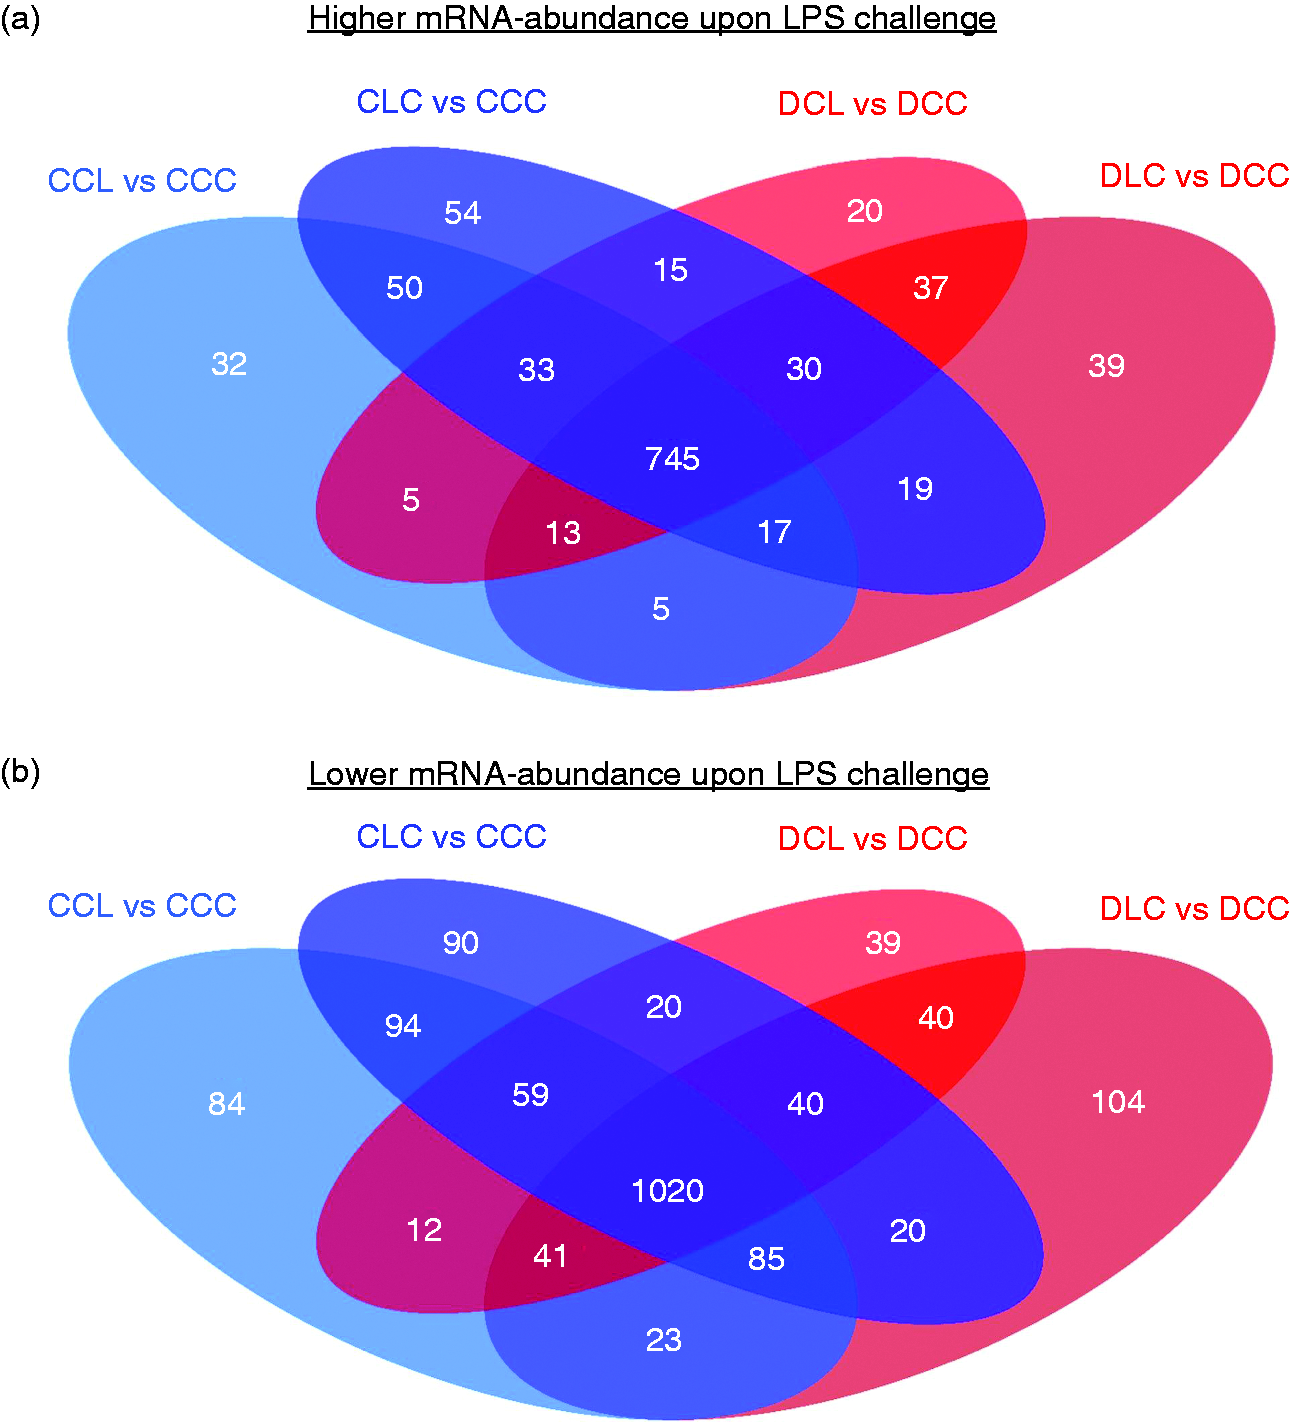
Differentially expressed genes upon LPS challenge by pre- or post-hepatic infusion to pigs fed a DON contaminated or a control diet. Depicted are Venn’s diagrams of the numbers of differentially expressed genes (DEGs, q ≤ 0.001 and P ≤ 0.05). (a) The analyses revealed 1114 DEGs with higher mRNA abundance upon LPS challenge and (b) 1771 DEGs with lower mRNA abundance upon LPS exposure. Groups fed a control diet (blue) have C as first letter in their group designation, while groups fed a deoxynivalenol contaminated diet (4.59 mg/kg, red) have D as first letter in their group designation. Infusion of 7.5 µg LPS/kg BM (L) or physiological saline (C) are indicated by the second letter when the infusion was given via jugular vein post-hepatic or third letter when the infusion was applied via portal vein pre-hepatic.
Functional analysis of genes with changed mRNA abundance upon LPS challenge
Functional characterization of DEGs was performed using the DAVID functional annotation database. Of 1114 DEGs with higher mRNA abundance upon LPS exposure, 1081 were assigned to the S. scrofa background in DAVID. Using DAVID’s default settings, 457 of these genes were mapped to 63 different pathways in the Kyoto Encyclopedia of Genes and Genomes (KEGG). Within these 63 KEGG pathways, 42 overlapping pathways including 236 genes were considered to have a significant enrichment (P < 0.05 and FDR < 10%, Table 1).
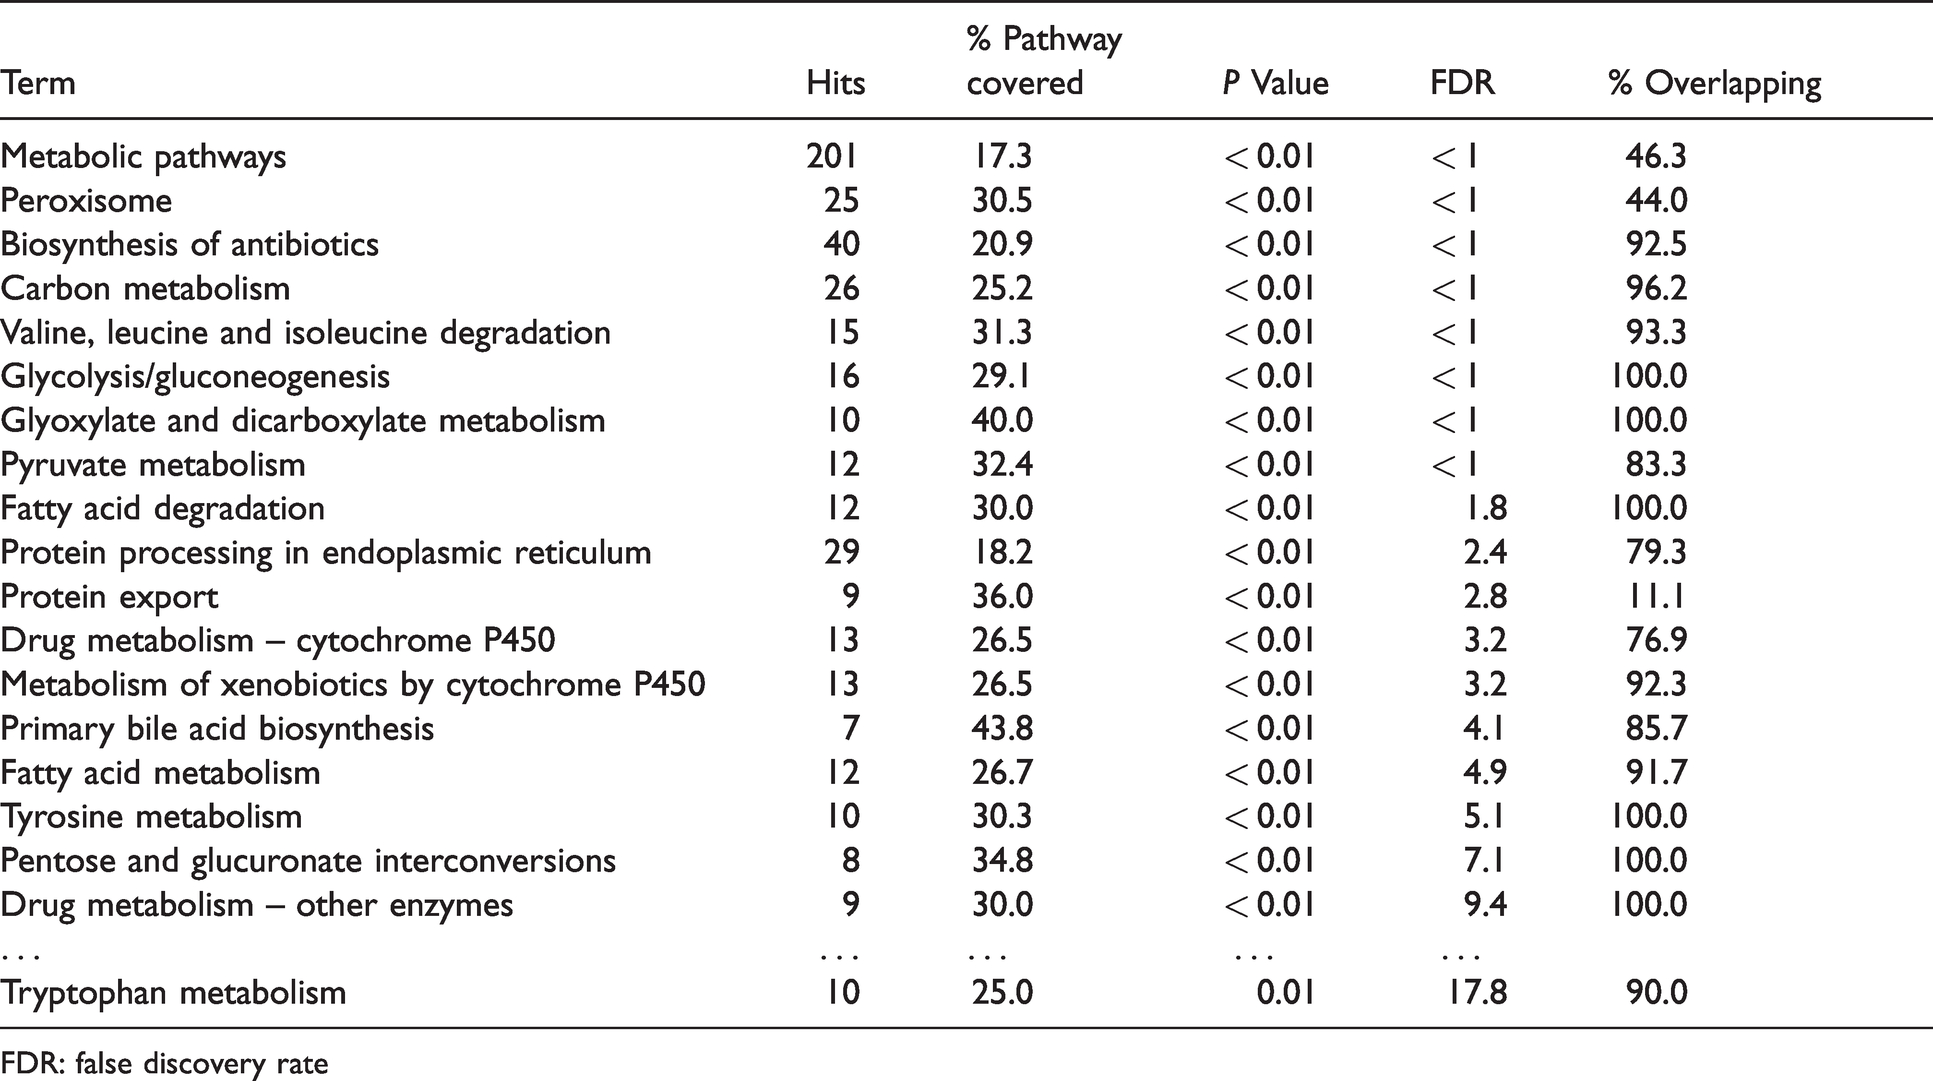
Significantly enriched KEGG pathways for differentially expressed liver genes from S. scrofa with increased mRNA abundance after venous LPS exposure. Displayed are KEGG pathways with a significant enrichment (P < 0.05, FDR < 10%) of differentially expressed genes according to DAVID and their overlaps among each other.
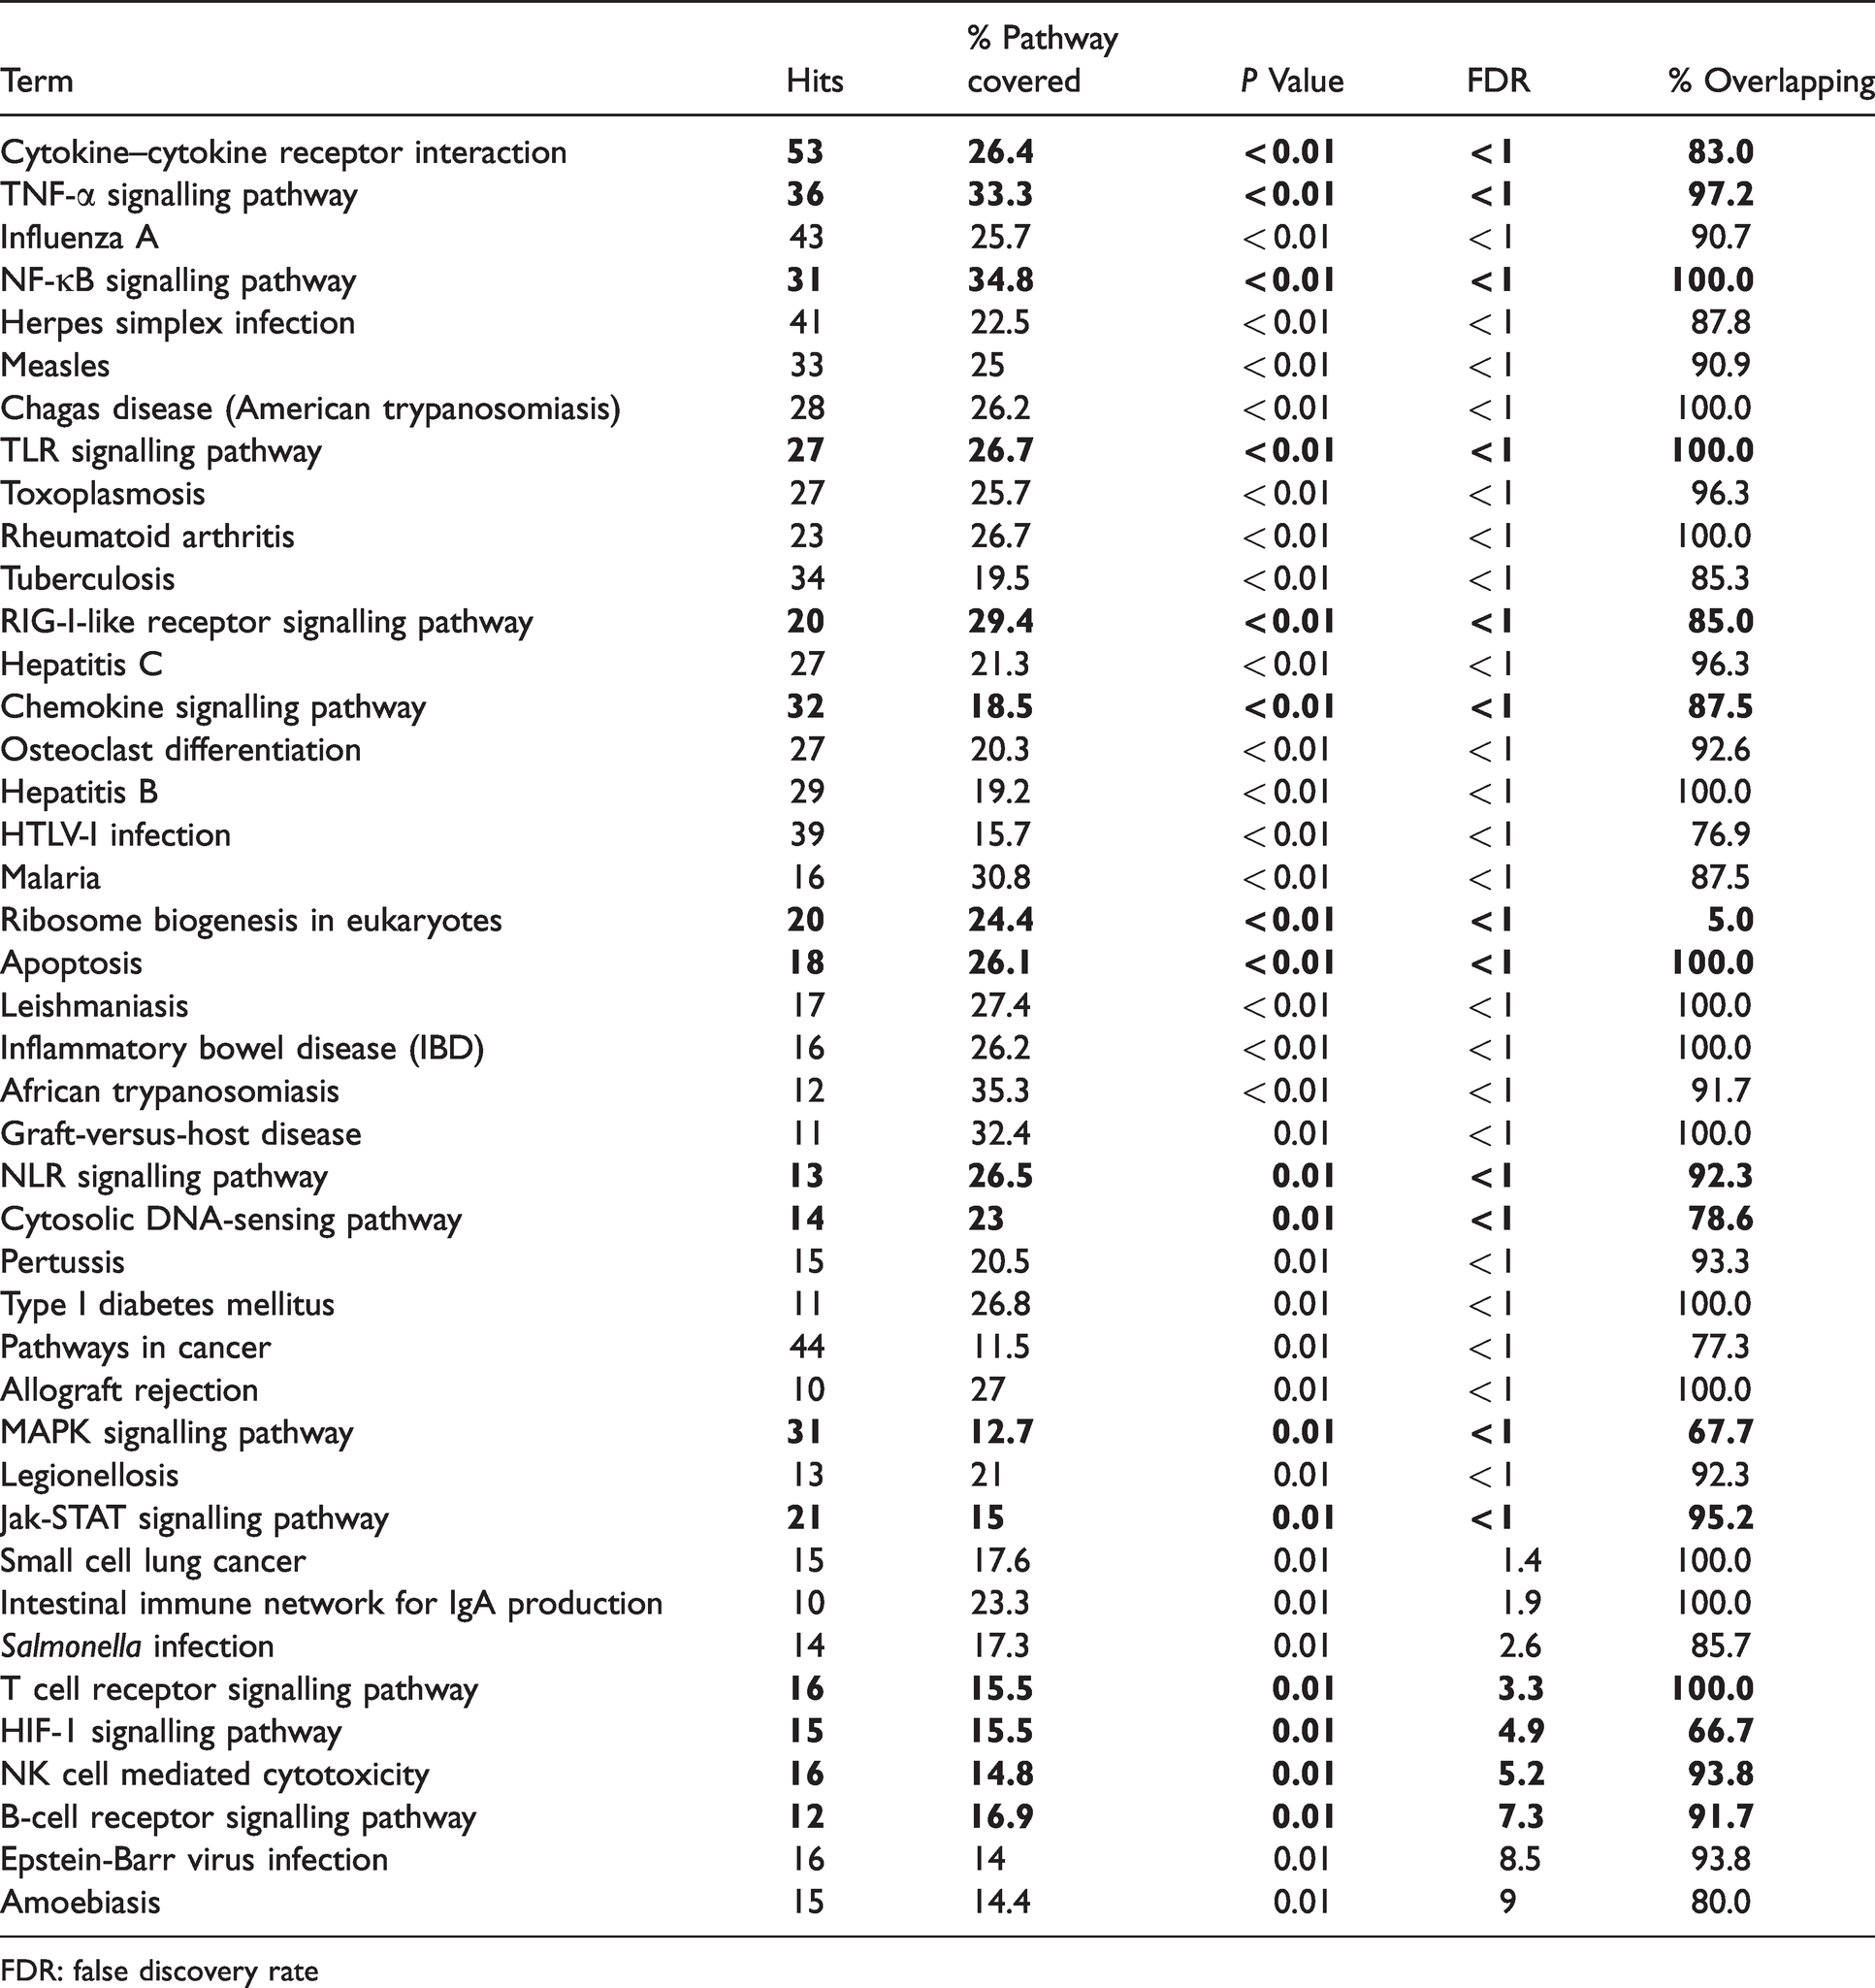
FDR: false discovery rate
Most significantly enriched KEGG pathways were related to immune responses and could be related to the APR. Furthermore, various enriched pathways were related to specific infections (e.g. influenza A, toxoplasmosis), other non-infectious inflammatory conditions (rheumatoid arthritis), pathologies (e.g. small cell lung cancer), and metabolic events (e.g. osteoclast differentiation). These pathways appeared to be unrelated to the experimental questions and as many genes of these pathways were included in 16 pathways closer related to the hypotheses (bold indicated in Table 1) only the latter were considered for further evaluation and discussion. In total 168 DEGs were assigned to these KEGG pathways with relations to the experimental hypotheses, and associations with multiple of these interlinked pathways were observed (Figure 3). Having a closer look at the enriched pathways, cytokine–cytokine receptor interaction represented the most enriched signalling pathway. Among the DEGs in this pathway, most displayed increased mRNA abundance was independent of the diet and LPS infusion site, as observed for TNF-α and IL-1β and 6. In contrast to these, an association with LPS infusion site and DON contaminations was observed for the FAS ligand (FASLG, Figure 3). In agreement with the differential TNF mRNA abundance, the TNF-α signalling pathway showed an enrichment of genes with increased mRNA abundance irrespective of LPS infusion location or DON contaminations (Table 1, Figure 3). In accordance with these changes in TNF-α signalling, NF-κB signalling also displayed an enrichment of genes with higher mRNA abundance (Table 1, Figure 3). While again most of these genes showed increased abundance upon LPS stimulus independent of infusion location and DON, Toll-IL-1 receptor (TIR) domain-containing adaptor inducing IFN-β (TRIF) was only induced in group DLC and ataxia-telangiectasia mutated serine-protein kinase (ATM) was only induced in the control groups without DON in the diet. The observation of limited associations of genes with changed mRNA abundances with DON contamination of feed or LPS infusion location was observed for all enriched signalling pathways (Table 1, Figure 3). Remarkably, TGF-β activated kinase 1 (TAB1) and apoptosis related B-cell lymphoma 2 (Bcl-2)-like protein 11 (BIM) only displayed significantly changed mRNA abundance in the group with a post-hepatic LPS infusion and DON contaminations in the diet (Figure 3). In addition to the DEGs associated with APR-related signalling pathways, three genes associated with ribosomal biogenesis (nucleolar protein 56 (NOP56), RNA 3′-terminal phosphate cyclase-like protein (RCL1), nucleolar GTP-binding protein 2 (NUG2)) were only displaying significantly increased mRNA abundance upon LPS stimulus in groups fed the control diet.
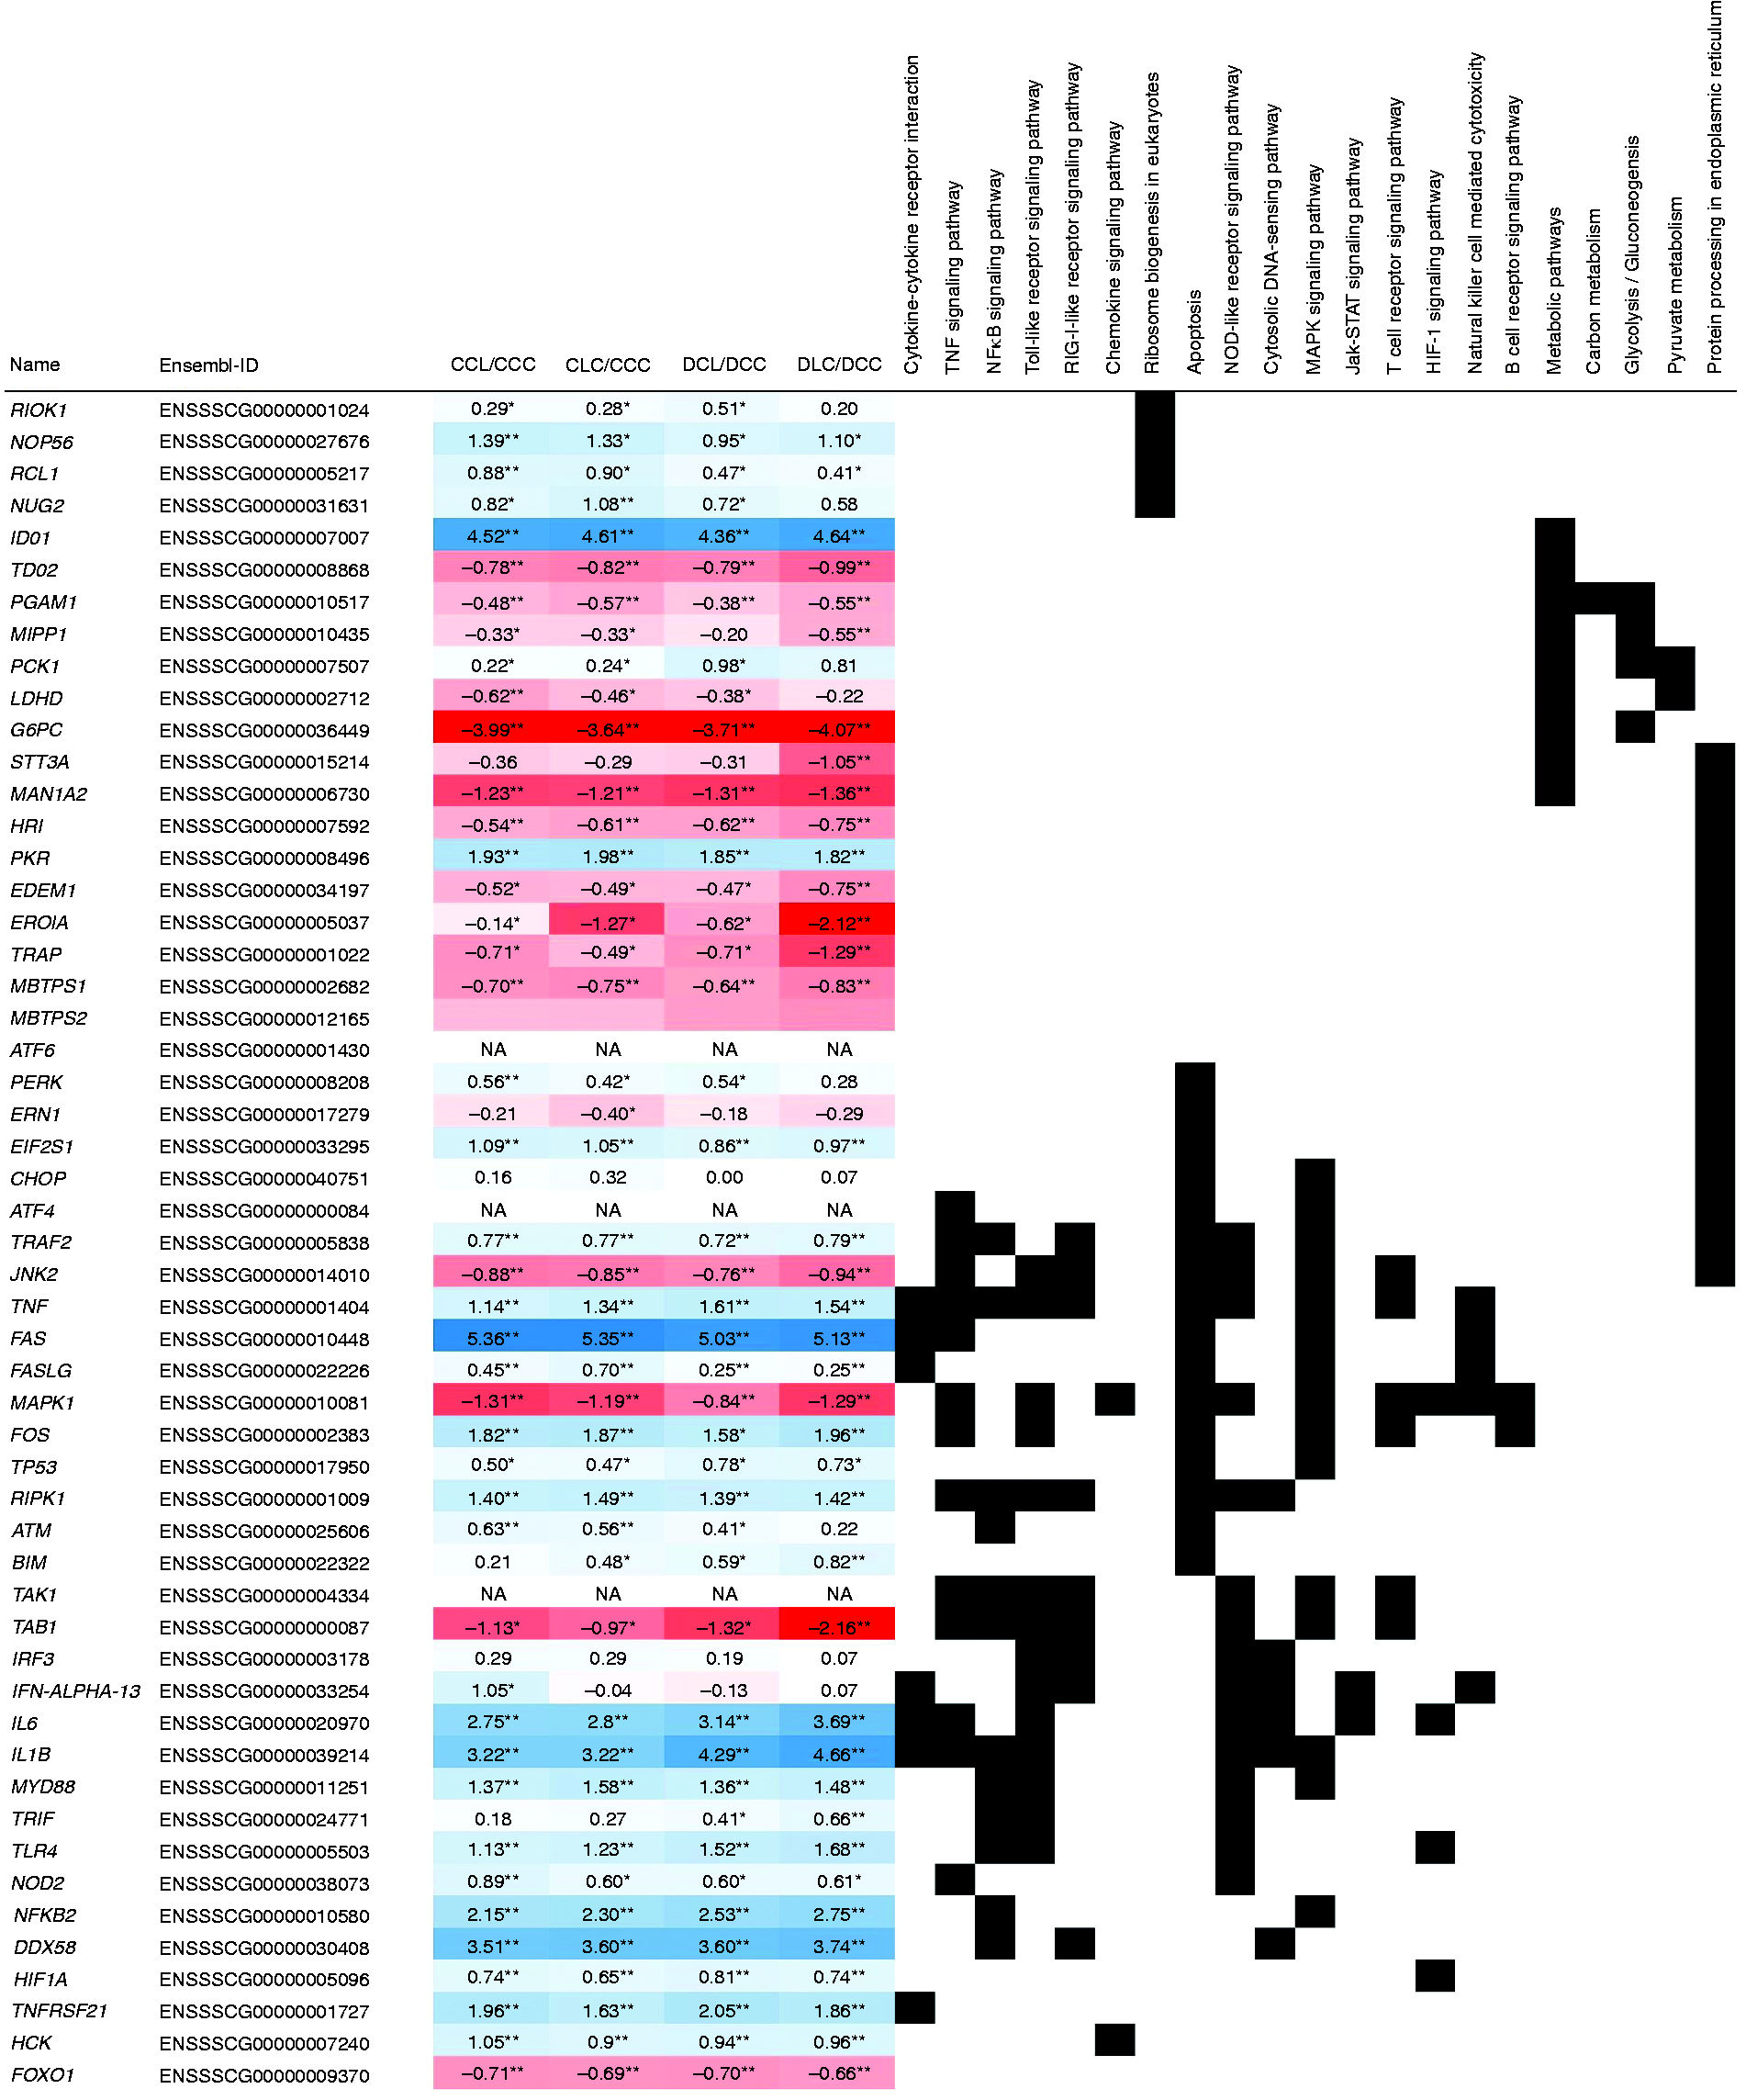
Changes in mRNA abundance and association with KEGG pathways of manually chosen genes with special interest for the experimental context. Depicted are gene names, ENSMBL-IDs and log2 fold changes of manually selected genes with relation to the experimental context of DON contaminations in the diet and pre- and post-hepatic LPS application together with their corresponding KEGG pathways. Groups fed a control diet have C as first letter in their group designation, while groups fed a deoxynivalenol contaminated diet (4.59 mg/kg) have D as first letter in their group designation. Infusion of 7.5 µg LPS/kg BM (L) or physiological saline (C) are indicated by the second letter when the infusion was given via jugular vein post-hepatic or third letter when the infusion was applied via portal vein pre-hepatic. The red and blue coloration gradients indicate the magnitude of difference in mRNA abundance between groups. Asterisks indicate the significance of these differences (**P < 0.05 and q < 0.001, *P < 0.05). A list of gene names can be found in the supplemental material Table S1.
In contrast, serine/threonine-protein kinase RIO1 (RIOK1) mRNA was only significantly increased on LPS stimulus in group DCL. The corresponding changes of mRNA abundances for these four genes in other groups were observable but not within significance threshold criteria (Figure 3). Of 1771 DEGs with lower mRNA abundance on LPS application, 1710 were assigned to the S. scrofa background in DAVID. Of these DEGs, 697 were mapped to 52 different KEGG pathways, while 18 of these pathways including 266 DEGs were considered significantly enriched (P < 0.05 and FDR < 10%). These pathways included multiple metabolic pathways and pathways related to peroxisome metabolism, as well as protein export and processing pathways (Table 2). Consequently, an accumulation of 201 repressed genes belonging to metabolic pathways in general was observed in DAVID. As already mentioned for the functional characterization of LPS-induced genes, overlaps in pathway associations of LPS-repressed genes were common (Table 2, Figure 3). Within carbon- and energy-metabolic pathways, significant enrichment of repressed genes related to glycolysis, gluconeogenesis, pyruvate metabolism, glyoxylate/dicarboxylate metabolism and to pentose and glucuronate interconversions was observed on LPS stimulus. Association of decreased mRNA abundance with DON contaminations in the diet or LPS infusion location was limited, as observed for genes with increased mRNA abundance upon LPS stimulus. Among these genes with reduced mRNA abundance on LPS stimulus were genes for enzymes like Glc-6-phosphatase (G6PC). Further significantly repressed pathways were related to fatty acid degradation and metabolism. Additionally, genes related to protein export and protein processing in the endoplasmic reticulum displayed decreased mRNA abundances. Interestingly, regulators linking apoptosis and protein processing like eukaryotic translation initiation factor 2 (EIF2S1) or TNF receptor-associated factor 2 (TRAF2) displayed increased mRNA abundance upon LPS stimulus in all conditions, while PKR-like ER kinase (PERK, EIF2AK3) only displayed increased mRNA abundance in the control group with a pre-hepatic LPS infusion. In agreement with changes in protein transport and modification, amino acid metabolism was altered upon LPS application. Here valine, leucine and isoleucine degradation and tyrosine metabolism were among the pathways that displayed a significant enrichment of mRNAs with decreased abundances.
Significantly enriched KEGG pathways for differentially expressed liver genes from S. scrofa with decreased mRNA abundance after venous LPS exposure. Displayed are KEGG pathways with a significant enrichment (P < 0.05, FDR < 10%) of differentially expressed genes according to DAVID and their overlaps among each other.
FDR: false discovery rate
Remarkably, also tryptophan metabolism showed an enrichment of repressed genes. It was considered despite an FDR >10%, as this pathway includes indoleamine 2,3-dioxygenase 1 (IDO1) which displayed the strongest observed change in mRNA abundance upon LPS stimulus (Figure 3). However, while tryptophan metabolism was considered repressed in general and tryptophan 2,3-dioxygenase 2 (TDO2) showed decreased mRNA abundance, IDO1 displayed increased mRNA abundance. Finally, metabolism of bile acids, metabolism of xenobiotics via cytochrome P450 and drug metabolism via other enzymes were also showing significant enrichment of genes with lower mRNA abundance upon LPS exposure.
Confirmation of microarray mRNA expression of selected genes by qRT-PCR
Quantitative RT-PCR was conducted to confirm the validity of the microarray data, and especially genes of central function that either were considered key players in pathways or were taking part in multiple pathways were chosen for confirmation. While the genes for CD40 and CD14 molecules (CD40, CD14), TNF-α, TLR4, IDO1 and TDO2 displayed a strong correlation between microarray data and qRT-PCR results, mRNAs for NOP56, TNF-α-induced protein 3 (TNFAIP3) and uridine-cytidine kinase 1 (UCK1) displayed relatively weak but significant correlations between both methods (Table 3, Figure 4).
Validation of gene expression patterns. Displayed are Spearman correlation coefficients between normalized expression data from qRT-PCR and gene expression intensities derived from the microarrays. A list of gene names can be found in the supplemental material Table S1.
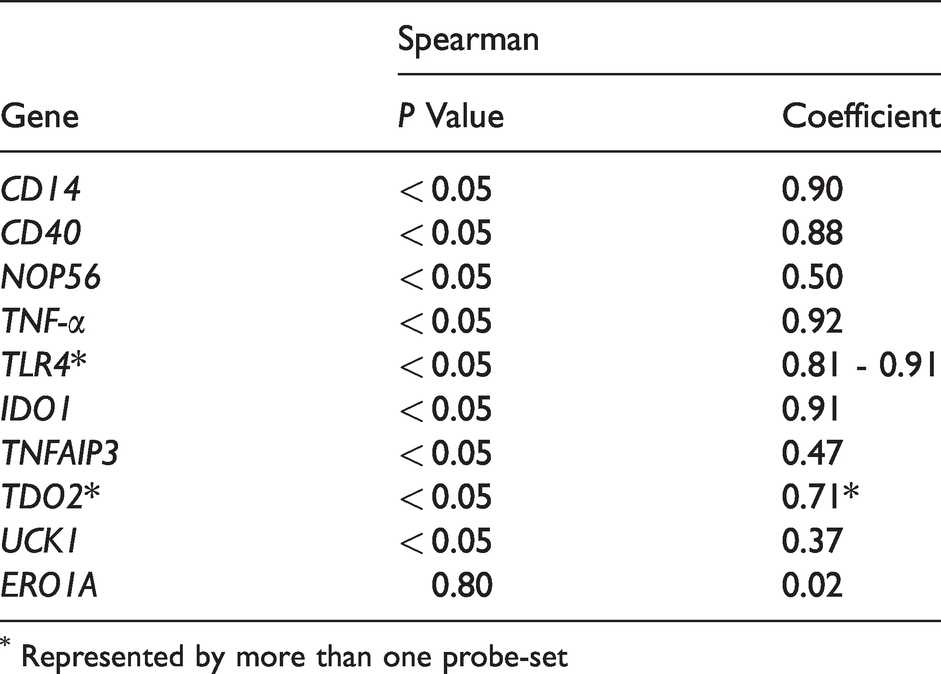
* Represented by more than one probe-set
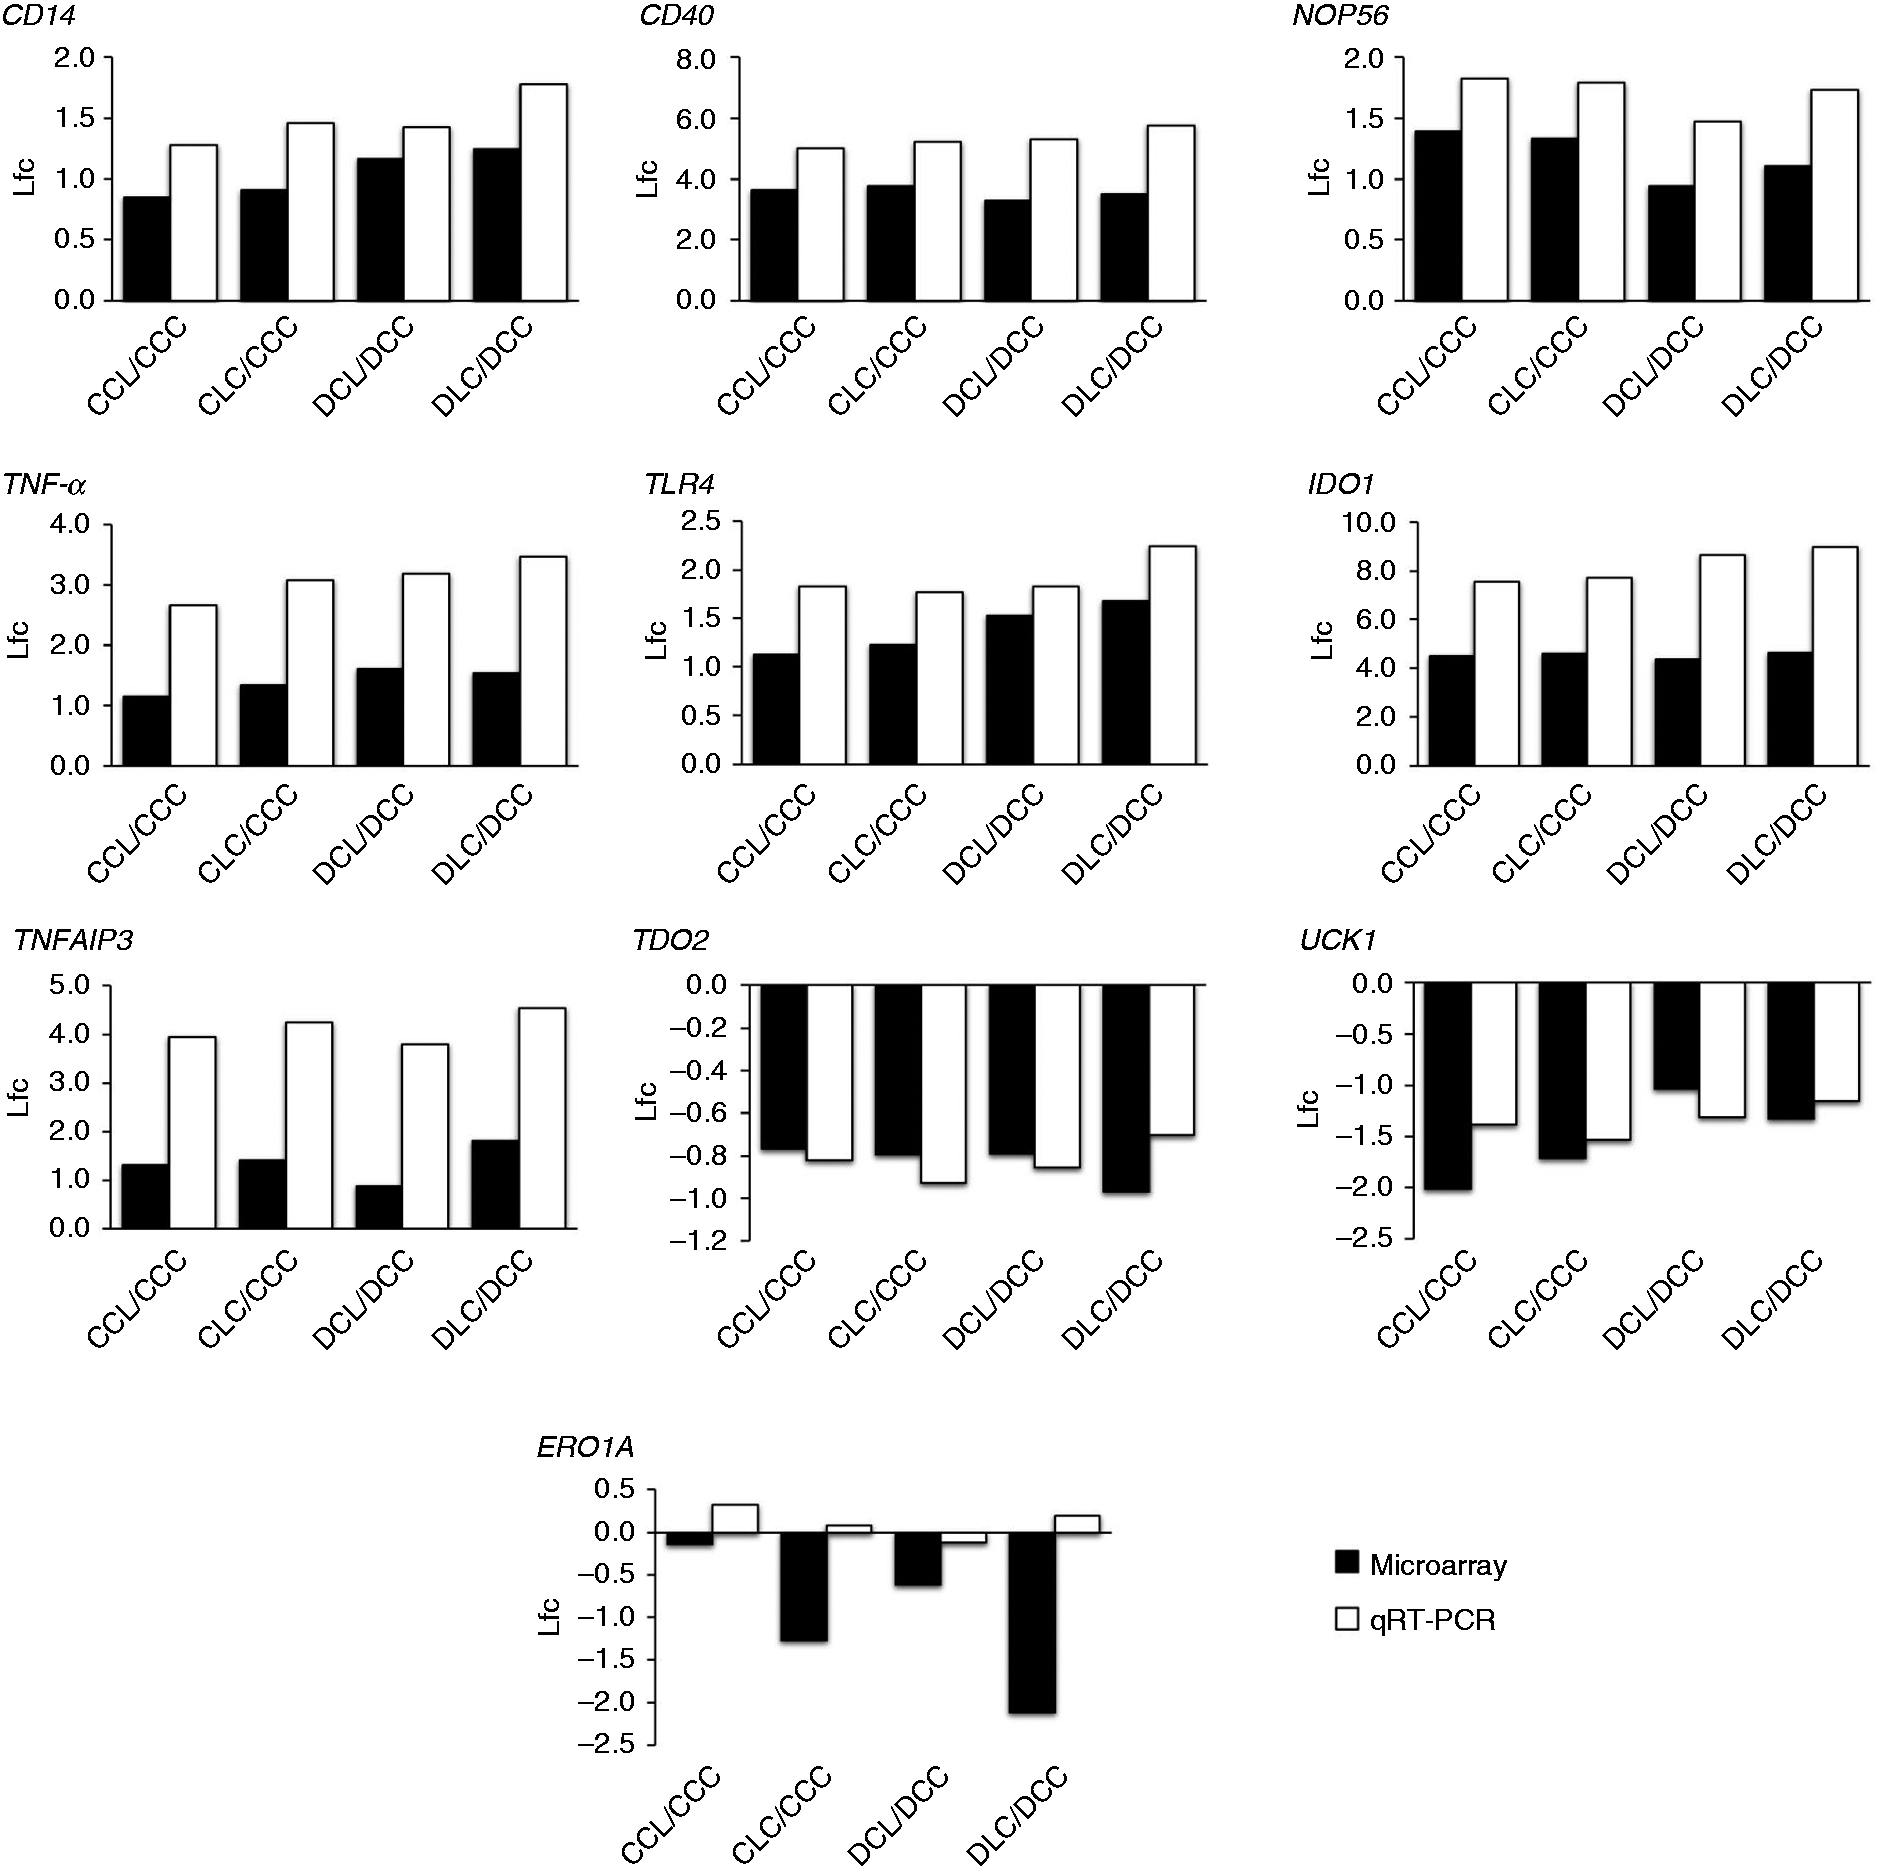
Comparison of log2 fold changes (lfc) of selected genes in livers of pigs in the groups upon LPS injection compared to respective control group measured in the microarray approach and qRT-PCR. Shown are log2 fold changes of selected relevant genes measured in microarray approach (dark) and qRT-PCR (light). Groups fed a control diet have C as first letter in their group designation, while groups fed a deoxynivalenol contaminated diet (4.59 mg/kg) have D as first letter in their group designation. Infusion of 7.5 µg LPS/kg BM (L) or physiological saline (C) are indicated by the second letter when the infusion was given via jugular vein post-hepatic or third letter when the infusion was applied via portal vein pre-hepatic. A list of gene names can be found in the supplemental material Table S1.
Only for the mRNA encoding Endoplasmic oxidoreductin-1 Alpha (ERO1A) no significant correlation between methods was observed and the decrease in mRNA abundance upon LPS stimulus could not be reproduced in qRT-PCR despite strong log2-fold-changes in the microarray (Table 3, Figure 4).
Associations of hepatic TNF-α mRNA expression with protein TNF-α levels, and between IDO/TDO mRNA expression and kynurenine–tryptophan ratio in post-hepatic blood
To further validate the relevance of the observed gene expression in the microarray, gene expression was compared with relevant experimental data gained in the animal trial. 11 As LPS-mediated TLR4 signalling likely induced mRNA expression of TNF-α, and in the view that the corresponding protein plays a pivotal role in mounting the APR, the association between TNF-α mRNA expression and its protein is of special interest. A clear association was identified between hepatic TNF-α mRNA level and post-hepatic TNF-α protein level in blood, suggesting higher levels of the protein with higher mRNA expression (Figure 5). Very low levels of TNF-α mRNA were associated with low levels of protein expression, while LPS stimulation increased the level of expression, both at the mRNA and protein level. In addition, high variation in associated values was noticed, suggesting that a given level of mRNA expression was associated with varying levels of the protein. This variation appeared to be stronger than that induced by feeding group and LPS infusion site. As an example, for the association between mRNA expression and function of protein, the kynurenine to tryptophan ratio (Kyn:Trp ratio) was used as an indicator for the activity of both IDO and TDO (Figure 6). When IDO1 mRNA remained undetectable, low levels of both TDO2 mRNA and Kyn:Trp ratios were noticed. Upon LPS stimulation both IDO1 mRNA expression and Kyn:Trp ratio increased markedly while TDO2 mRNA stayed at a low level.
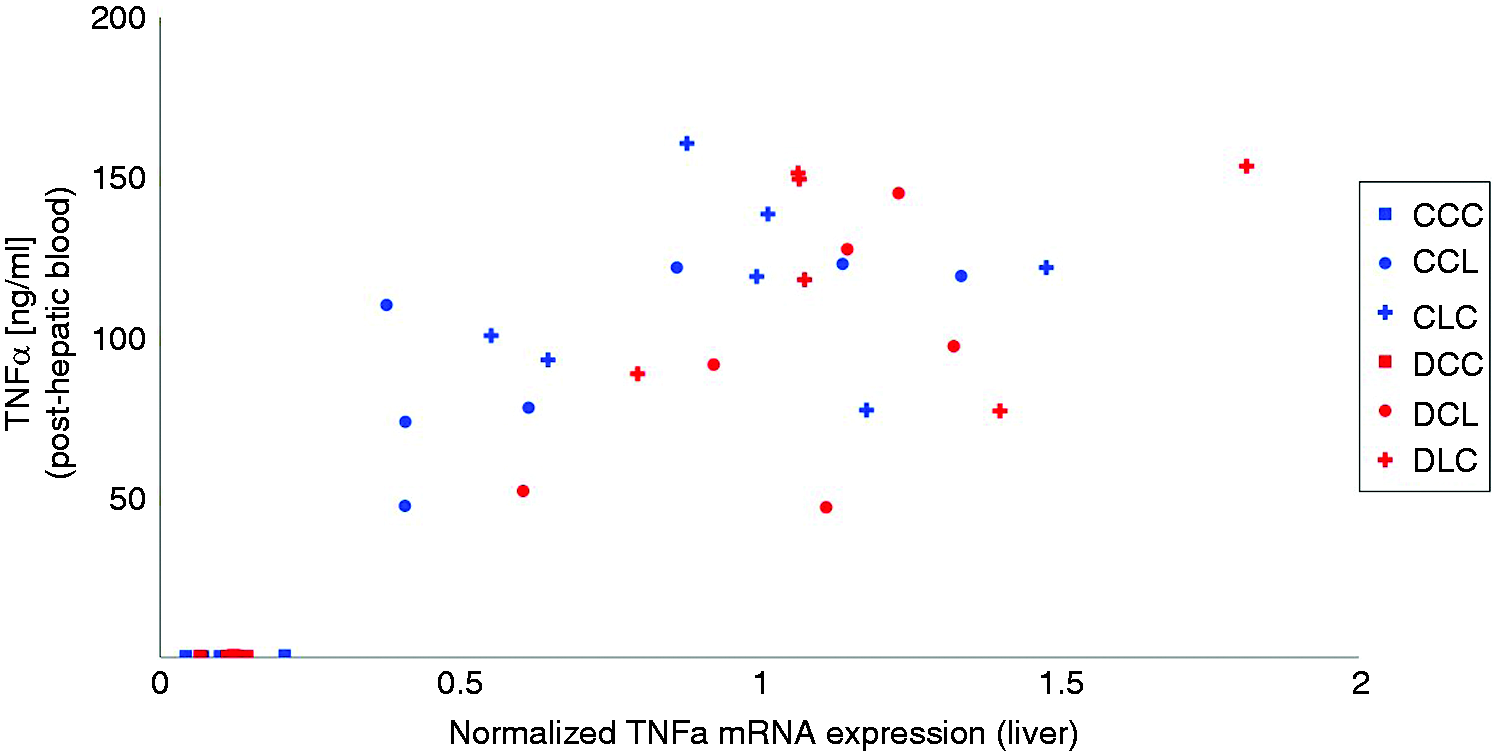
Relationship between hepatic TNF-α mRNA (data from present qRT-PCR analyses) and TNF-α protein (data from Tesch et al. 11 ) in post-hepatic blood. Liver samples were obtained 195 min after the beginning of the LPS infusion while blood samples were collected at 180 min. Groups fed a control diet (blue) have C as first letter in their group designation, while groups fed a deoxynivalenol contaminated diet (4.59 mg/kg, red) have D as first letter in their group designation. Infusion of 7.5 µg LPS/kg BM (L) or physiological saline (C) are indicated by the second letter when the infusion was given via jugular vein post-hepatic or third letter when the infusion was applied via portal vein pre-hepatic.
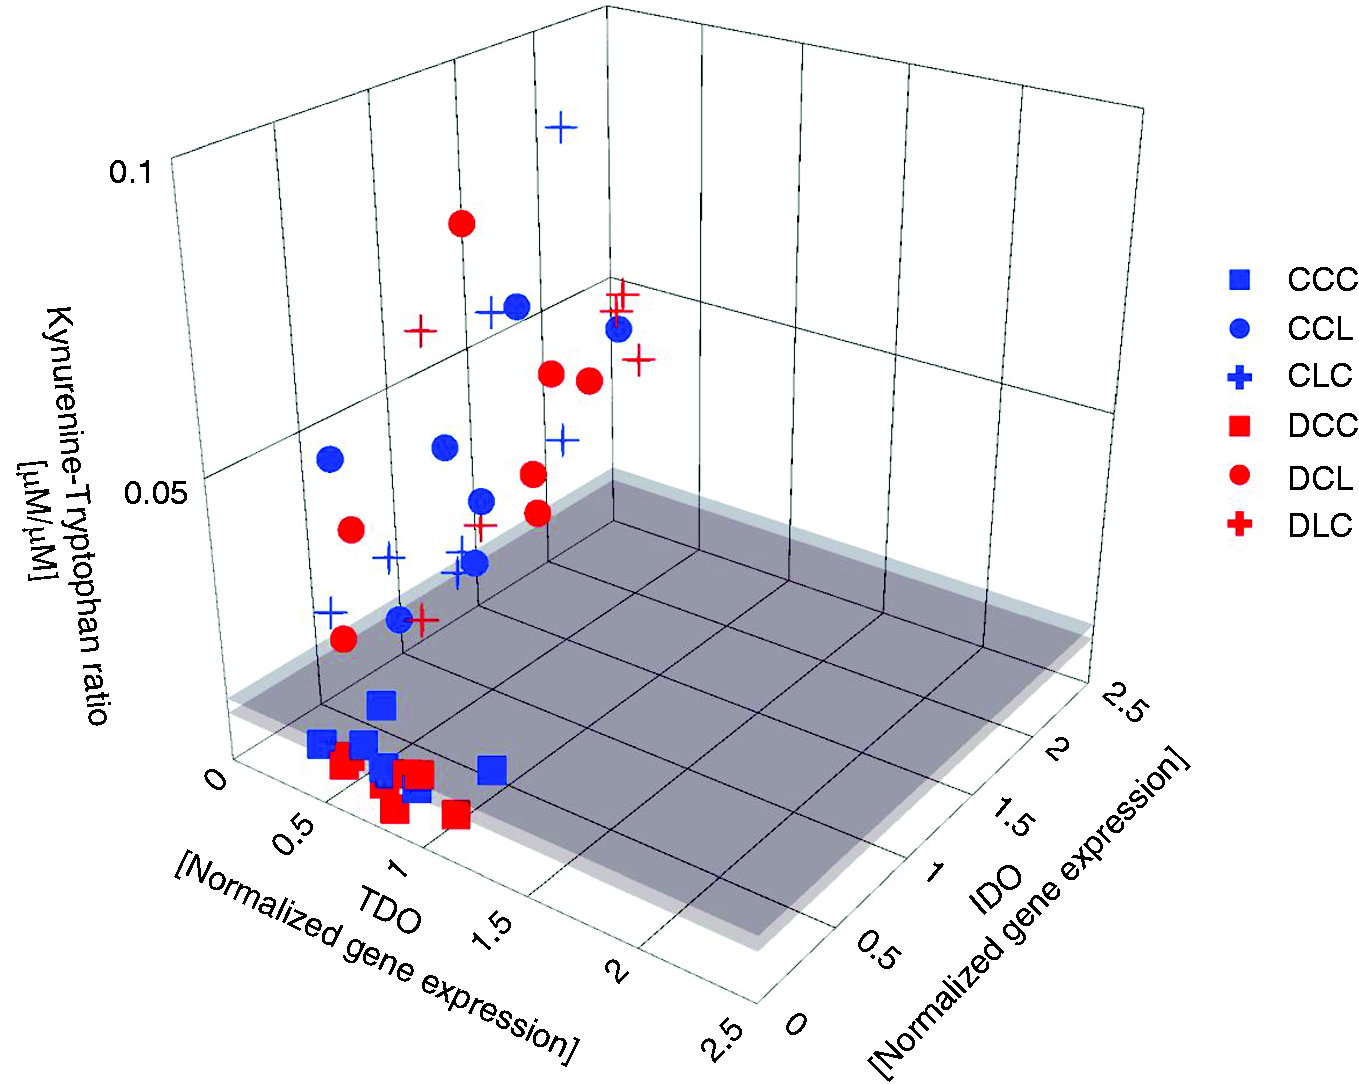
Relationship between hepatic mRNA expression of IDO, TDO (Data from present qRT-PCR analyses in liver) and Kyn:Trp ratio in pre-hepatic and post-hepatic blood as indicator for IDO/TDO activity (data from Tesch et al. 11 ). Liver samples were obtained 195 min and blood samples were collected 180 min after the beginning of the LPS infusion. Displayed are the mRNA expression levels of IDO1 (IDO) and TDO2 (TDO) in comparison to the Kyn:Trp ratio in post-hepatic blood. Groups fed a control diet (blue) have C as first letter in their group designation, while groups fed a deoxynivalenol contaminated diet (4.59 mg/kg, red) have D as first letter in their group designation. Infusion of 7.5 µg LPS/kg BM (L) or physiological saline (C) are indicated by the second letter when the infusion was given via jugular vein post-hepatic or third letter when the infusion was applied via portal vein pre-hepatic.
Discussion
The systemic LPS application used in the present experiment (either pre- or post-hepatic) generally induced marked systemic and hepatic inflammation at the transcriptomic, clinical, clinical-chemical and histopathological level, and clearly resembles earlier findings employing either intramuscular or intraperitoneal LPS administration in pigs. 35 , 36 Besides examining the effects of chronic DON exposure alone on hepatic transcriptome for testing hypothesis 1, the animal LPS-challenge model enabled us to investigate the interactions between inflammation-induced hepatic injury and DON exposure for verifying hypothesis 2.
Hypothesis 1: Chronic dietary DON exposure modulates mRNA expression of hepatic genes involved in mediating toxicity of DON
For addressing hypothesis 1, it seems to be helpful to briefly describe the mechanisms of DON toxicity. These have been discussed as molecular events associated with binding to ribosomes resulting in inhibition of translation and inducing of MAPKs, which are critical in signal transduction for immune responses.37–39 The DON related up-regulation of genes encoding for pro-inflammatory cytokines in macrophage and monocyte cultures is discussed as a result of the activation of the MAPK members extracellular signal regulated protein kinase 1 and 2 (ERK1 and 2), p54 and p46 c-Jun N-terminal kinase 1 and 2 (JNK 1/2) and p38. Double-stranded RNA-activated protein kinase (PKR, eukaryotic translation initiation factor 2-alpha [EIF2A] kinase 2, EIF2AK2) and haematopoietic cell kinase (HCK) have been identified as signal transducers for MAPK activation. Besides up-regulation of pro-inflammatory genes, DON also enhances their mRNA stability, contributing to the increases in the corresponding cytokines. In addition, the MAPK-associated induction of pro-inflammatory cytokines, the endoplasmic reticulum (ER) stress response was discussed as a mechanism contributing to the up-regulation of pro-inflammatory genes. Here, the level of Glc-regulated protein 78 (GRP78), also known as binding immunoglobulin protein (BiP), is compromised by DON, probably by an increased degradation rather than a decrease in mRNA expression. BiP, as a chaperone, plays a crucial role in protein folding and in targeting of misfolded proteins to ER-associated protein degradation (ERAD) which includes ubiquitination of proteins and their degradation in the proteasome, or in initiation of an unfolded protein response (UPR). Thus, the DON-induced ER stress response results in an up-regulated transcription of mRNA coding for pro-inflammatory genes via the activation of the transcription factor cAMP response element binding protein (CREB).
All these DON-associated toxicity mechanisms at the molecular level, as comprehensively discussed by Pestka, 39 were not observed in the present experiment when the DON-fed group without LPS challenge was assessed. In discussing these literature findings together with the present results several aspects need to be considered. Most importantly, we solely evaluated complex mRNA expression patterns, while many of the discussed signalling cascades require activation of several key factors through phosphorylation, which was beyond the focus of the present investigations. Accordingly, protein expression and particularly activation via phosphorylation of kinases and factors were not considered. Moreover, for elucidating of mechanisms of DON toxicity through dose–response experiments, primarily macrophage cell lines and murine splenocytes were used for in vitro and ex vivo investigations, respectively. In the present experiment, we used samples collected from non-perfused livers and consequently analysed the mRNA expression of all cell types present, which included not only non-parenchymal and parenchymal cells but also blood cells (see also Figure 7). In addition, the DON doses used for toxicity assessment reported in the literature and those used in the present experiment differed largely. The minimum DON concentrations in culture media of in vitro experiments were 100 ng/ml and 250 ng/ml, while in vivo experiments employed minimum exposure levels of 0.1, 1, 2, 5 and 25 mg/kg BM. 37 ,40–47
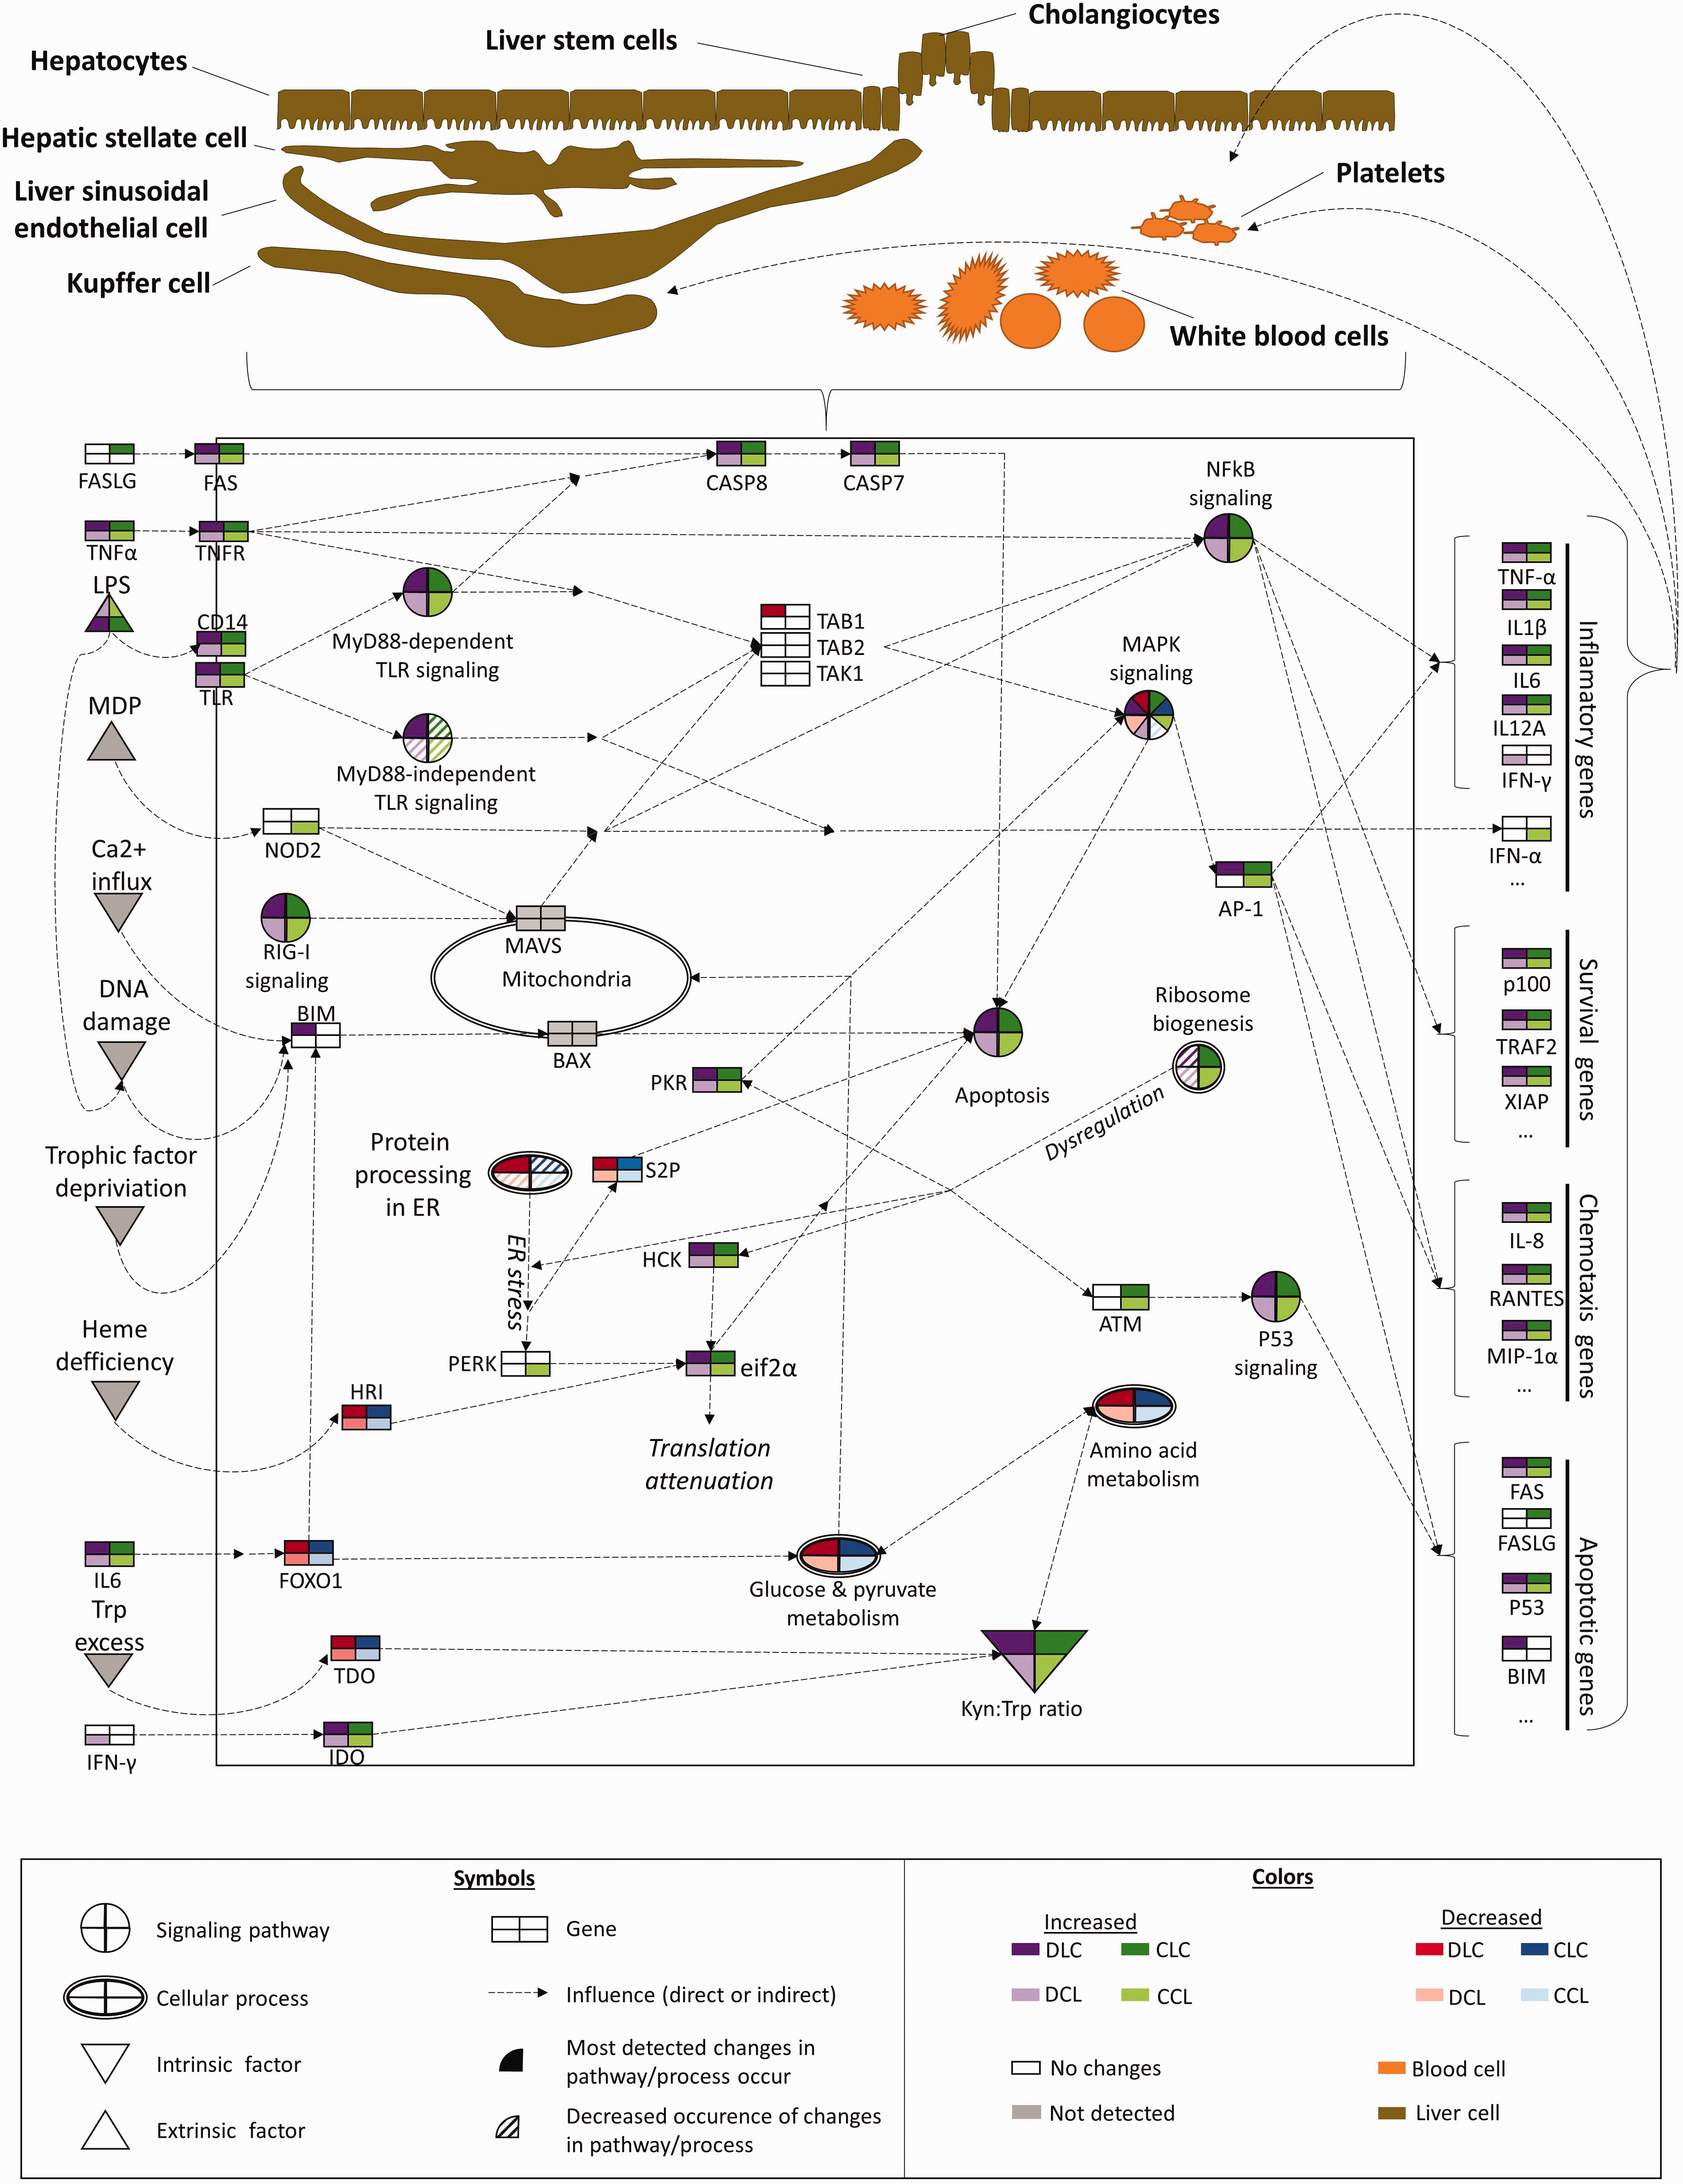
A simplified graphic representation of genes, signalling pathways, cellular processes and factors related to the LPS response in context of DON exposure and LPS infusion site. Note that the primary focus was laid on genes differently regulated by DON exposure under the conditions of an acute-phase response (APR) initiated through pre- or post-hepatic LPS challenge. The fact that non-perfused liver samples were analysed implies a complex contribution of hepatic and non-hepatic cells to the overall network. Furthermore, the depicted associations characterize the situation at 195 min after the beginning of the LPS infusion. Groups fed a control diet (blue) have C as first letter in their group designation, while groups fed a deoxynivalenol contaminated diet (4.59 mg/kg, red) have D as first letter in their group designation. Infusion of 7.5 µg LPS/kg BM (L) or physiological saline (C) are indicated by the second letter when the infusion was given via jugular vein post-hepatic or third letter when the infusion was applied via portal vein pre-hepatic A list of gene names can be found in the supplemental material Table S1. MDP -
In the present in vivo experiment, maximum DON concentrations of 24 ng/ml were detected in the systemic circulation of pigs exposed to the DON-contaminated diet (4.59 mg/kg feed), corresponding to a mean daily exposure of 158 µg DON/kg BM. 18 The DON concentration of the contaminated diet was approximately five times higher than the guidance value of 0.9 mg DON/kg diet (88% dry matter) which is regarded as a feed safety value; exceeding this might cause adverse health effects. Indeed, pigs respond quite sensitively to higher DON levels in the diet, primarily with a decrease in voluntary feed intake. 48 Because of this anorectic DON effect, we restricted the feed intake of the CON group to the level voluntarily consumed by the DON-fed group to avoid energy and nutrient effects on readouts, including hepatic gene expression. Furthermore, dietary DON concentrations of several mg of DON are detected rather in a worst case, but not routinely. 48 Thus, both the smaller DON dose employed in the present experiment to the species pig and the mixture of cell types analysed in the liver samples might explain why we failed to detect DON effects on mRNA expression.
Hypothesis 2: Chronic dietary DON exposure predisposes the liver for a subsequent LPS challenge differently depending on pre- or post-hepatic entry of LPS and leads to tolerance or exacerbates the LPS-induced SI at the mRNA level
Concerning hypothesis 2, it has been proposed that sensitivity to xenobiotics might be modulated by inflammation. 49 For investigation of such interactive mechanisms, a systemic LPS application is often used to induce a standardized SI which is then characterized in the absence and presence of xenobiotics like DON. Such experiments have been reported for mice, demonstrating principally a potentiation of DON effects during SI.50–53
In pigs, the concomitant treatment with LPS and DON reduced the LPS-induced TNF-α peak, decreased the increase in the activities of aspartate amino transferase (ASAT) and glutamate dehydrogenase (GLDH), but disproportionally enhanced the concentration of total bilirubin in systemic circulation. 54 Moreover, the clearance of total DON was reduced and the persistence of glucuronidated DON was enhanced in endotoxemic pigs. 55 , 56 These results suggest a DON role in the modification of the SI with consequences for its own kinetics. In this interplay, the role of the liver is particularly highlighted as it plays a decisive role in mounting the APR through triggering the TNF-α release, and contributes significantly to phase II metabolism of DON and to bilirubin metabolism and elimination. Moreover, the less pronounced increases in ASAT and GLDH activities in DON-treated endotoxemic pigs hint at less pronounced hepatocellular lesions under these conditions.
In the present experiment we infused LPS either pre-hepatic via the hepatic portal vein or post-hepatic via the jugular vein to initiate the APR in the first pass mainly through resident Kupffer cells or peripheral monocytes, respectively. Murine monocyte-derived hepatic macrophages (MDMs) were shown to respond to an LPS stimulus with a more pronounced TNF-α response compared with Kupffer cells. 57 This might be due to differences in ontogenesis and phenotype of both cell types. Whereas MDMs are replenished from haematopoietic stem cells of bone marrow via circulating monocytes, the resident hepatic Kupffer cells are refilled through local proliferation. 57 Under steady-state conditions, the latter are permanently exposed to low levels of intestine-derived LPS which does not drive an inflammatory response but rather acts immunosuppressively, whereby a constant detrimental immune activation is avoided. 58 , 59 It has been suggested that Kupffer cells respond more sensitively to LPS in the presence of additional hepatic lesions, which decreases the threshold to express pro-inflammatory signals. 59 Assuming DON to be a toxin causing such hepatic lesions, a kinetics of the inflammatory response induced via hepatic portal LPS stimulation different from jugular LPS administration could have been expected. We could show that both routes of LPS administration resulted in an up-regulation of genes mediating SI, particularly when TLR and TNF signalling pathways as well as interconnected pathways were considered as typical hallmarks. Among the up-regulated pro-inflammatory genes TNF-α is of special interest, as this cytokine is an early one in mounting the APR cascade and triggers the induction of further mediators (Figure 7). We found not only the mRNA of TNF-α to be increased (Figure 3) but also the protein in a typical time-dependent manner reaching a peak 1 h after initiation of the LPS infusion. 11 These increases occurred independently of feeding regimen and infusion site (Figure 3). 11
To test hypothesis 2, differences in mRNA expression caused by feeding regimen (CON vs. DON) and/or route of LPS administration (jugular vs. portal) were of special interest. Here, the MyD88-dependent branch and the MyD88-independent branch of the TLR4 signalling pathway, also known as TRIF or TIR-containing adapter molecule-1 (TICAM-1)-dependent TLR4 signalling pathway, appeared to be differently regulated in dependence on treatments (Figure 7). Whereas in DON-fed pigs the portal LPS infusion (DCL) stimulation of mRNA expression of AP-1 transcription factor subunit Fos (FOS) was weaker despite up-regulated MyD88-dependent TLR4 signalling, solely in DON-fed pigs treated with LPS via the jugular vein (DLC) the MyD88-independent and TRIF-dependent pathway was up-regulated (Figure 7). These treatment-related differences in TLR4 signalling could hint at different stages of acute inflammation. Whereas MyD88 signalling occurs at early stages of acute inflammation, the MyD88-independent TRIF-mediated signalling is rather seen in later stages of acute inflammation. 60 Therefore, stages of SI were possibly different for treatment groups 195 min after start of LPS infusions, which was also reflected by differences in the kinetics of clinical signs between groups infused either via the hepatic portal or jugular vein. 12
The fact that the TRIF-dependent pathway also converges to the MyD88-dependent TLR4 signalling via the receptor-interacting serine/threonine-protein kinase 1 (RIPK1) and the mitogen-activated protein kinase kinase 7 (TAK1) suggests that the observed mRNA up-regulation of AP-1-subunit FOS was dominated by the MyD88-dependent TLR4 signalling (Figure 7). Up-regulated TRIF signalling in group DLC was associated with a weak induction of IFN-α (IFN-ALPHA-13) expression in the control group infused with LPS via the hepatic portal vein (CCL), supporting the view that portal LPS stimulation favoured TRIF-dependent TLR4 signalling irrespective of DON presence in feed.
Interestingly, the mRNA of the cytosolic PRR NOD2 was up-regulated in group CCL. NOD2 signalling not only converges to NF-κB and AP-1 pathways but also to the transcription factor IFN regulatory factor 3 (IRF3). Whereas NF-κB and AP-1 signalling triggered mRNA expression of, among others, TNF-α, IL-1β and IL-6, IRF3 signalling led to stimulated IFN-α mRNA expression only in group CCL despite no significant differences in IRF3 mRNA abundance being observed between groups. Therefore, the observed up-regulated IFN-α expression in this group may be mediated by NOD2 signalling rather than by TRIF signalling (Figure 7). It is worth noting that the expression of IFN-α as an antiviral IFN is not only triggered by NOD2 sensing of PAMPs and (endogenous) danger-associated molecular patterns, but also by retinoic acid-inducible gene 1 (RIG-I, DDX58) as another cytosolic PRR. 61 Although 29% of the genes of the RIG-I pathway were up-regulated due to LPS infusion none of them was differently regulated due to feeding regimen and LPS infusion site. This might also favour the idea that the expression of IFN-α in group CCL was rather associated with NOD2-IRF3 signalling. The protein translation of up-regulated mRNA for the discussed transcription factors, PRRs, cytokines and other proteins requires a properly up-regulated and fine-tuned co-assembly of rRNA and ribosomal proteins. This process is collectively termed as ribosome biogenesis.62–64 The up-regulated mRNA of 24% of genes involved in ribosome biogenesis appeared to be a mechanism to translate the up-regulated mRNA into proteins necessary to mount the APR as a central element of the innate immune response to LPS. Of all the factors involved in ribosome biogenesis, the mRNAs of NOP56, RCL1 and NUG2 were only significantly up-regulated in CON-fed groups (CCL and CLC) which also means that these genes were induced weaker in the DON-fed groups (Figure 7). NOP56 is a core protein in small nucleolar ribonucleoproteins, which are involved in rRNA processing.65,66 RCL1 is part of a trimeric complex necessary for the recruitment to the small nucleolar RNA U3 within 90S particles 67 and Nug2 expresses GTPase activity and belongs to the assembly factors of the pre-60S subunit. 62 , 66 , 67 On the other hand, RIO kinase 1 (RIOK1) mRNA was only significantly up-regulated in DON-fed pigs exposed to LPS via the hepatic portal vein (group DCL). RIOK1, as an atypical serine protein kinase, plays a critical role in the 40S ribosomal subunit biogenesis, is associated with shuttling between nucleus and cytoplasm and pre-40S particles and in processing of 20S pre-RNA. 67 , 68 As these treatment-related differences concerned only a few genes the net outcome for the whole process of ribosome biogenesis remains elusive and might just reflect variations in the sequence of APR driven by different proportions of involved cells. On the other hand, it remains a question whether an up-regulation of a few genes of the whole process of ribosome biogenesis could also just indicate a dys-regulation. Dys-regulated pre-rRNA processing and ribosomal protein deficiency are known to activate the tumour protein p53 via signalling through ATM. 64 As a transcription factor p53 induces genes involved in DNA repair, cell cycle arrest and apoptosis. Interestingly, despite inducing conditions, p53 mRNA expression remained unaffected by any of the treatments, ATM was up-regulated in CON-fed pigs only; those groups, where also NOP56, RCL1 and NUG2 mRNAs were up-regulated (Figure 7). Therefore, the up-regulation of ATM mRNA could indicate a beginning stress response due to dys-regulated ribosome biogenesis in these CON-fed pigs. The role of the up-regulated RIOK1 mRNA in group DCL remains to be clarified.
Besides the treatment-associated effects on ribosome biogenesis, it needs also to be considered that the primary molecular target of DON toxicity are the ribosomes as discussed above. A potentiation of these molecular events has been reported for DON-exposed mice stimulated with LPS. 44 ,50–53 However, as DON exposure alone failed to signal a ribotoxic stress response in the pigs of the present experiment at the mRNA level, additional LPS-promoting effects were rather less expectable. Instead, the vast majority of up- and down-regulated genes reflected the picture of an acutely inflamed liver characterized by a mixture of hepatic parenchymal and non-parenchymal cells as well as infiltrated blood cells (Figure 7). Histopathological lesions included primarily haemorrhage and inflammation. 14 Thus, hepatic gene expression profiles and the subsequent assignment to signalling pathways were probably influenced by erythrocytes, thrombocytes and leukocytes, which were abundantly present in the inflamed liver. The fact that the interactive effects between DON and LPS on signalling pathways were described for macrophage cell lines and murine splenocytes could explain why we failed to detect such results in complete liver tissue. Moreover, as discussed above, as far as signalling includes kinases such as MAPKs, the mRNA expression level represents only one regulatory level, while activation is mediated by phosphorylation which was not measured in the present experiment. Although the mRNA abundances of MAPK members JNK and ERK were significantly down-regulated, those of AP-1 and downstream pro-inflammatory, chemotactic and pro-apoptotic genes were up-regulated throughout all groups. Therefore, as an up-regulated AP-1 expression requires activated MAPKs, it might be concluded that constitutively expressed kinases were phosphorylated to confer the downstream signal transduction, which might serve as a compensatory mechanism. In vitro studies with murine macrophages have shown that LPS treatment resulted in phosphorylation both of ERK1/2 and of JNK1/2 with a peak at 30 min after exposure and lasting for 4 h, supporting the idea that activation of these MAPKs is triggered by LPS. The combination of LPS and DON prolonged the activation period to 8 h for JNK1/2, while phosphorylation of ERK1/2 was determined by LPS alone. 44
Moreover, mRNA of PKR and HCK (HCK is a Src family member mainly expressed in haematopoietic cells) as mediators between ribotoxic insults and activation of MAPKs 41 were significantly up-regulated in the present experiment due to LPS treatment independently of infusion site and feeding regimen (Figure 7). Here, the ribosome is suggested to serve as a scaffold for PKR which facilitates the mobilization of MAPKs together with other signalling mediators to induce inflammatory cytokines. 69 The ribotoxic stress response not only activates the stress responsive MAPKs but also induces an ER stress answer, 69 as discussed for hypothesis 1). While DON alone failed to affect protein processing in ER, LPS administration down-regulated mRNA expression of 18% of genes involved in this pathway. Out of these 29 hits four genes were solely down-regulated in the DON-fed group infused with LPS via the jugular vein (group DLC), namely the genes for oligosaccharyltransferase (OST) catalytic subunit A (STT3A), ER degradation enhancing α-mannosidase-like protein 1 (EDEM1), ERO1A and translocon-associated protein (TRAP). OST codes for a protein complex located at the membrane of the ER. It transfers pre-assembled oligosaccharides to sites of glycosylation of secretory proteins.70–72 OST protein acts co-translational as nascent proteins enter the ER. 73 Glycosylation of newly formed proteins is required for correct folding and sorting of proteins. Therefore, dietary DON exposure together with post-hepatic LPS-induced initiation and perpetuation of APR seemed to particularly contribute to ER stress and UPR (Figure 7). Misfolded proteins are assigned to ERAD for clearing and recovery of ER homeostasis. Targeting of misfolded proteins to ERAD requires an extensive Man trimming of glycoproteins by ER mannosidase I (ERManI) and EDEM proteins. 74 The observed down-regulation of ERManI member MAN1A2 (independent of feeding group and LPS infusion site) and EDEM1 mRNA in group DLC might indicate a reduced capacity for ERAD under these conditions. This conclusion is further supported by the down-regulated ERO1 and TRAP mRNAs solely in group DLC. ERO1 and TRAP participate in oxidative ER protein folding and targeting to the ubiquitin ligase complex. 75 , 76 As an overload of the ERAD capacity to clear misfolded proteins results in ER stress and subsequently in UPR it seems reasonable to assume that a reduced ERAD capacity by down-regulated pathway genes might also lead to ER stress-associated UPR. ER stress is recognized by the stress sensors transmembrane proteins inositol-requiring enzyme-1 (IRE1; ERN1), PERK and activating transcription factor-6 (ATF6).77–79 Signalling of these sensors is aimed at restoring ER homeostasis and eventually inducing apoptosis if ER stress cannot be resolved. Although ERN1 mRNA was neither up- nor down-regulated, that of TNF receptor-associated factor 2 (TRAF2) was up-regulated due to LPS infusion independently of infusion site and feeding group. TRAF2 signals both to NFкB and MAPKs pathways whereby inflammatory and apoptotic genes are induced. 78 Site 1 and 2 proteases (S1P and S2P, respectively) cleave domains from ATF6 moved previously to the Golgi apparatus in response to ER stress whereby it becomes a transcription factor and induces ER chaperone and apoptotic genes. 77 While ATF6 mRNA expression was not covered in the microarray, S1P mRNA (MBTPS1) and S2P mRNA (MBTPS2) were significantly down-regulated due to LPS infusion irrespective of infusion location (Figure 7). Moreover, S2P mRNA was more strongly down-regulated in DON-fed groups (DCL, DLC), suggesting that ATF6 UPR signalling pathway was less induced, particularly in DON-fed groups. Another mechanism to cope with an accumulation of misfolded proteins is a general attenuation of protein synthesis. PERK, similarly to PKR and heme-regulated eukaryotic translation initiation factor 2 subunit 1 (eIF2α) kinase (HRI, EIF2AK1), phosphorylates eIF2α whereby a translational arrest is initiated. 80 Besides translation inhibition of frequently transcribed genes, others are up-regulated, which aimed at adaptation to stress. 80 Activating transcription factor-4 (ATF4) and C/EBP homologous protein-10 (CHOP) are such proteins inducing genes for stress adaptation. In the present experiment PERK mRNA was significantly up-regulated in CON-fed pigs challenged with LPS via the hepatic portal vein (CCL) with a similar trend in group DCL, but HRI was down-regulated and eIF2α up-regulated irrespective of feeding regimen and LPS infusion site at the same time, while both ATF4 and CHOP mRNA expression remained unaffected (Figure 7). PERK is induced by ER stress while HRI is up-regulated through heme deficiency. 80 As HRI mRNA was down-regulated a heme deficiency is probably not responsible for this effect. Whether the marked haemorrhage observed in the livers of all LPS exposed pigs 14 could have been associated with the HRI mRNA down-regulation needs to be clarified. Taking into consideration that ER stress sensors and downstream pathways were differently regulated at the mRNA level, it would be reasonable to assume that apoptosis was also influenced in a similar way. Out of the 69 genes involved in apoptosis 18 were up-regulated. Out of these genes, the BIM mRNA was clearly up-regulated solely in group DLC (Figure 7). BIM can bind all Bcl-2 pro-survival proteins, which characterizes this protein as a potent apoptosis inducer. Unlike ER stress-induced PERK and downstream apoptosis transducers ATF4 and CHOP, BIM is induced by trophic factors deprivation, DNA damage and Ca2+ influx, but also through MAPKs-mediated AP-1 signalling. 81 , 82 Although only BIM was differently regulated due to treatments at the mRNA level, it needs to be considered that activity of pro- and anti-apoptotic factors is also determined by their phosphorylation. 82
Besides hepatocytes, hepatic sessile and infiltrated leukocytes act closely together in mounting the LPS-induced APR. Hepatocytes play additionally a crucial role for gross nutrient and energy metabolism. Co-localization of both immunological and metabolic functions places the liver at risk for hepatotoxicity and metabolic decompensation. 83 Hyperammonemia, metabolic acidosis and hypoglycaemia seen in conjunction with inflammation can often be traced to impaired hepatic intermediary metabolism and metabolic decompensation. 83 Several transcription factors such as CREB and fork head box protein O1 (FOXO1) are involved in controlling the expression of rate-limiting enzymes of hepatic metabolic pathways whereby liver energy metabolism is controlled (Figure 7). 84 For example, CREB and FOXO1 stimulate the expression of phosphoenolpyruvate carboxykinase 1 (PCK1) and G6PC as rate-limiting enzymes of gluconeogenesis. 84 While CREB1 mRNA was significantly up-regulated in all LPS-infused groups, FOXO1 mRNA was significantly down-regulated (Figure 3). From the mRNAs regulated by these transcription factors, the G6PC mRNA displayed reduced abundance (Figure 3) while PCK1 remained unaffected, suggesting a compromised gluconeogenesis under the conditions of the LPS-induced APR. Besides regulating gluconeogenesis, CREB is involved in many other processes and induces genes containing a cAMP-responsive element such as TNF-α and IL-6. On the other hand, CREB exerts anti-inflammatory effects through inhibition of NF-кB activation. 85
Besides down-regulation of G6Pase mRNA, further genes of glycolysis and gluconeogenesis were repressed at the mRNA level. While 2,3-bisphosphoglycerate-dependent phosphoglycerate mutase (PGAM1) mRNA was repressed independently of feeding group and LPS infusion site, the 2,3-bisphosphoglycerate 3-phosphatase (MIPP1) mRNA was solely repressed in group DLC. 2-Phospho-
Another key enzyme involved in pyruvate metabolism is lactate dehydrogenase (LDH) which converts pyruvate to lactate in the absence of oxygen but also metabolizes lactate coming from anaerobic muscular glycolysis to pyruvate in the liver (Cori cycle). 87 Additionally, neutrophilic granulocytes, M1 macrophages and dendritic cells switch from primary oxidative phosphorylation to aerobic glycolysis (Warburg effect) upon stimulation, which ultimately increases lactate generation through LDH activity instead of substrate feeding to the citric acid cycle. 88 Hypoxia-inducible factor 1-alpha (HIF-1α) promotes the expression of LDH 87 , 88 and is itself induced by hypoxia, TLR4-mediated signalling and by inflammatory mediators such as TNF-α and IFN-γ. 89 , 90 In the present study, HIF-1α mRNA (HIF1A) was uniformly up-regulated in all LPS-infused groups, which was paralleled by an up-regulated TLR-4 signalling as discussed above. Moreover, IFN-γ mRNA, which was solely up-regulated in group DCL, might have contributed to the overall LPS-mediated up-regulation of HIF-1α mRNA. As IFN-γ is predominantly produced by NK cells and innate lymphoid type 1 cells as innate equivalents of T cells 91 , 92 it might be concluded that these immune cells were particularly involved in the innate immune response to LPS in group DCL. Furthermore, IFN-γ promotes the pro-inflammatory M1 macrophages for NO production and release of reactive oxygen species 92 which, in turn, are generated by NADPH-oxidase activity. The required NADPH is abundantly delivered because of running aerobic glycolysis in activated neutrophilic granulocytes, M1 macrophages and dendritic cells.
Based on the histopathological observation of massive hepatic infiltration by neutrophilic granulocytes in all LPS-infused pigs 14 it seems reasonable to assume that overall hepatic mRNA expression of lactate dehydrogenase D (LDHD) originated probably from different cell types. As LDHD mRNA expression was solely repressed in group CCL it might be concluded that LDH was more triggered in pigs infused with LPS via the jugular vein and fed the DON-contaminated diet. This is consistent with the observation that the SI-associated lactic acidosis was generally more obvious following jugular LPS infusion in groups CLC and DLC. 19
Tryptophan metabolism is another prominent example for linking hepatic nutrient metabolism with innate immune responses. Considering the mRNA expression of enzymes involved in tryptophan catabolism, opposite effects were noticed for liver-specific TDO and the ubiquitous occurring IDO. Both enzymes degrade tryptophan to kynurenine and the Kyn:Trp ratio is frequently interpreted as an indicator for IDO/TDO activity.
While TDO mRNA was significantly down-regulated, the IDO mRNA expression was strongly induced by LPS infusion. As TDO is involved in tryptophan homeostasis and is only induced in case of tryptophan excess, 93 its down-regulation might indicate a mechanism to safe hepatic tryptophan necessary for synthesis of acute-phase proteins. 33 In contrast, IDO is induced by inflammatory cytokines, most notably by IFN-γ, 94 , 95 and its role in innate immune responses is discussed to remove tryptophan from the free amino acid protein synthesis precursor pool in order to decrease its availability for protein synthesis of invading micro-organisms but also for host T cells. 96 On the other hand, metabolites arising from kynurenine metabolism are ascribed an important role in immune responses.97–99 Although TDO is liver-specific, a hepatic IDO contribution to tryptophan degradation can be assumed and the IDO mRNA expression detected in the liver might result from both hepatic sources, resident and inflammation-associated infiltrated immune cells. This conclusion is supported by the relationships between IDO mRNA, TDO mRNA and Kyn:Trp ratio (Figure 6). In unstimulated CON groups low Kyn:Trp ratios were associated with low TDO mRNA levels while IDO mRNA expression remained undetectable, suggesting a nearly exclusive TDO activity to be responsible for the measured Kyn:Trp ratios. Furthermore, the increase in Kyn:Trp ratios following LPS infusion was correlated with an increase in IDO mRNA expression and thus obviously reflects IDO activity under the conditions of APR.
Moreover, although IFN-γ mRNA was up-regulated in group DCL only, up-regulation of IDO was neither differently influenced by LPS infusion site nor by feeding group (Figure 7). Thus, the effect of IFN-γ on overall IDO up-regulation seemed to be limited. This conclusion is supported by comparable Kyn:Trp ratios observed in all LPS-infused groups. 11 Interestingly, this effect occurred at a significantly higher level for jugular LPS infusion localization. 11 As this difference between jugular and portal blood Kyn:Trp ratios was also observed in LPS-unexposed positive and negative control groups (CCC and DCC, respectively), it might be concluded that the lower ratios in portal blood resulted from a Trp influx from the intestine rather than from a decreased IDO activity of blood cells.
Summing up the discussion for hypothesis 2, if the idea is accepted that LPS-induced APR is initiated and mediated by TLR4 signalling and that downstream MyD88 and TRIF signalling characterize early and late stages of acute inflammation, 60 then the up-regulation of TRIF mRNA, which was only detected for DON-fed pigs infused with LPS via the jugular vein (group DLC), could indicate a time shift of all other affected pathways. Indeed, mRNA for BIM as a key factor in apoptosis and IFN-γ released by T cells were accordingly up-regulated in group DLC only. On the other hand, mRNAs for NOD2, IFN-α and PERK as ribosomal stress sensor were exclusively up-regulated in portal with LPS-infused control pigs (group CCL). As a correlate we observed differences in the kinetics of clinical signs in dependence on LPS infusion site and DON exposure such as body temperature and overall clinical score. 12
Conclusions
Regarding the applied experimental and bioinformatics settings, DON exposure alone failed to modulate the mRNA expression of the porcine hepatic transcriptome significantly. However, LPS-infused groups showed numerous enriched pathways which pointed to an up-regulation of inflammation and a down-regulation of metabolic routes. In this situation, feeding group and LPS infusion site modulated some individual genes within the LPS-triggered pathways. However, this does not necessarily mean that the outcome of the respective pathways was significantly modulated when it is assumed that overall gene network regulation does not require the up-regulation of all genes and filtering conditions are additionally considered. Moreover, we analysed the entire transcriptome of the liver at 195 min after initiating the LPS-triggered APR, which means that gene expression profiles were probably influenced by thrombocytes and leukocytes which were abundantly present in the inflamed liver. Nevertheless, individual pathway genes were exclusively regulated in DON or CON-fed pigs infused with LPS via the jugular and hepatic portal vein, respectively. This diverse kinetics probably reflected different stages of acute inflammation and were accompanied by modified deflections in the time course of clinical signs.
Supplemental Material
sj-pdf-1-ini-10.1177_17534259211030563 - Supplemental material for Does chronic dietary exposure to the mycotoxin deoxynivalenol affect the porcine hepatic transcriptome when an acute-phase response is initiated through first or second-pass LPS challenge of the liver?
Supplemental material, sj-pdf-1-ini-10.1177_17534259211030563 for Does chronic dietary exposure to the mycotoxin deoxynivalenol affect the porcine hepatic transcriptome when an acute-phase response is initiated through first or second-pass LPS challenge of the liver? by Sven Dänicke, Ann-Katrin Heymann, Michael Oster, Klaus Wimmers, Tanja Tesch, Erik Bannert, Susanne Bühler, Susanne Kersten, Jana Frahm, Jeannette Kluess, Stefan Kahlert, Hermann-Josef Rothkötter and Fabian Billenkamp in Innate Immunity
Footnotes
Acknowledgements
The authors gratefully acknowledge the technical support by Nicola Mickenautsch, Elenia Scholz, and Lara Lindner of the Institute of Animal Nutrition, Friedrich-Loeffler-Institute Braunschweig, Germany, in sample preparation and analysis.
Declaration of conflicting interests
The authors declared no potential conflicts of interest with respect to the research, authorship, and/or publication of this article.
Funding
The authors disclosed receipt of the following financial support for the research, authorship, and/or publication of this article: The authors thank the ‘Deutsche Forschungsgemeinschaft’ (DFG) for financial support (DA 558/1-4).
Research ethics
Experiment and procedures were conducted according to the European Community regulations concerning the protection of experimental animals and the guidelines of the German Animal Welfare Act and were approved by the Ethical Committee of the Lower Saxony State Office for Consumer Protection and Food Safety (file number 33.4-42502-04-13/1274).
Supplemental material
Supplemental material for this article is available online.
References
Supplementary Material
Please find the following supplemental material available below.
For Open Access articles published under a Creative Commons License, all supplemental material carries the same license as the article it is associated with.
For non-Open Access articles published, all supplemental material carries a non-exclusive license, and permission requests for re-use of supplemental material or any part of supplemental material shall be sent directly to the copyright owner as specified in the copyright notice associated with the article.