
Abstract
Polymorphisms in genes that control immune function and regulation may influence susceptibility to pulmonary tuberculosis (TB). In this study, 14 polymorphisms in 12 key genes involved in the immune response (VDR, MR1, TLR1, TLR2, TLR10, SLC11A1, IL1B, IL10, IFNG, TNF, IRAK1, and FOXP3) were tested for their association with pulmonary TB in 271 patients with TB and 251 community-matched controls from the Republic of Moldova. In addition, gene–gene interactions involved in TB susceptibility were analyzed for a total of 43 genetic loci. Single nucleotide polymorphism (SNP) analysis revealed a nominal association between TNF rs1800629 and pulmonary TB (Fisher exact test P = 0.01843). In the pairwise interaction analysis, the combination of the genotypes TLR6 rs5743810 GA and TLR10 rs11096957 GT was significantly associated with an increased genetic risk of pulmonary TB (OR = 2.48, 95% CI = 1.62–3.85; Fisher exact test P value = 1.5 × 10⁻⁵, significant after Bonferroni correction). In conclusion, the TLR6 rs5743810 and TLR10 rs11096957 two-locus interaction confers a significantly higher risk for pulmonary TB; due to its high frequency in the population, this SNP combination may serve as a novel biomarker for predicting TB susceptibility.
Introduction
Tuberculosis (TB), caused by Mycobacterium tuberculosis, is a major cause of morbidity and mortality in many developing countries and is a significant threat to health in the developed world. One-third of the world’s population is infected with M. tuberculosis, but only a minor fraction (5–10%) develop an active form of the disease. 1 Although several environmental and clinical conditions, such as diabetes mellitus, malnutrition, alcohol abuse, smoking, age, AIDS, and immunosuppressive therapies, are known to promote the development of the disease, many TB patients have no obvious risk factors. Evidence from animal and human studies indicates the importance of host genetic factors in the development of TB. 2
To date, a considerable number of genetic candidates for TB susceptibility have been detected and characterized across populations by means of candidate gene approaches and genome-wide association studies (GWAS). 3 , 4 Particular interest has focused on genetic factors of the immuno-inflammatory response that modulate infectivity and the progression of infection, including TLRs (TLR1–TLR10), natural resistance-associated macrophage protein (NRAMP1; also called solute carrier 11a1, SLC11A1), vitamin D receptor (VDR), cytokines TNF-α (TNF), IL-1 (IL1B), IFN-γ (IFNG), and IL-10 (IL10). Polymorphisms in these and other genes involved in the immune response have been reported to be associated with TB in different populations, although the results are inconsistent.3–5
We previously evaluated the effect of common genetic variations in the TLR pathway on the risk of pulmonary TB in a Moldavian population and identified variants in TLR2, TLR8, and TLR9 as being associated with TB. 6 In the present work, we extended the analysis to 14 additional polymorphisms from 12 TB immune response candidate genes and investigated all pairwise genetic interactions for these and the previous genetic variants (43 polymorphisms altogether). The selected polymorphisms in this study have previously been shown to change the level or function of corresponding gene products and influence susceptibility/resistance to infections (Table 1).
Candidate genes and polymorphisms that are of interest in the present study.
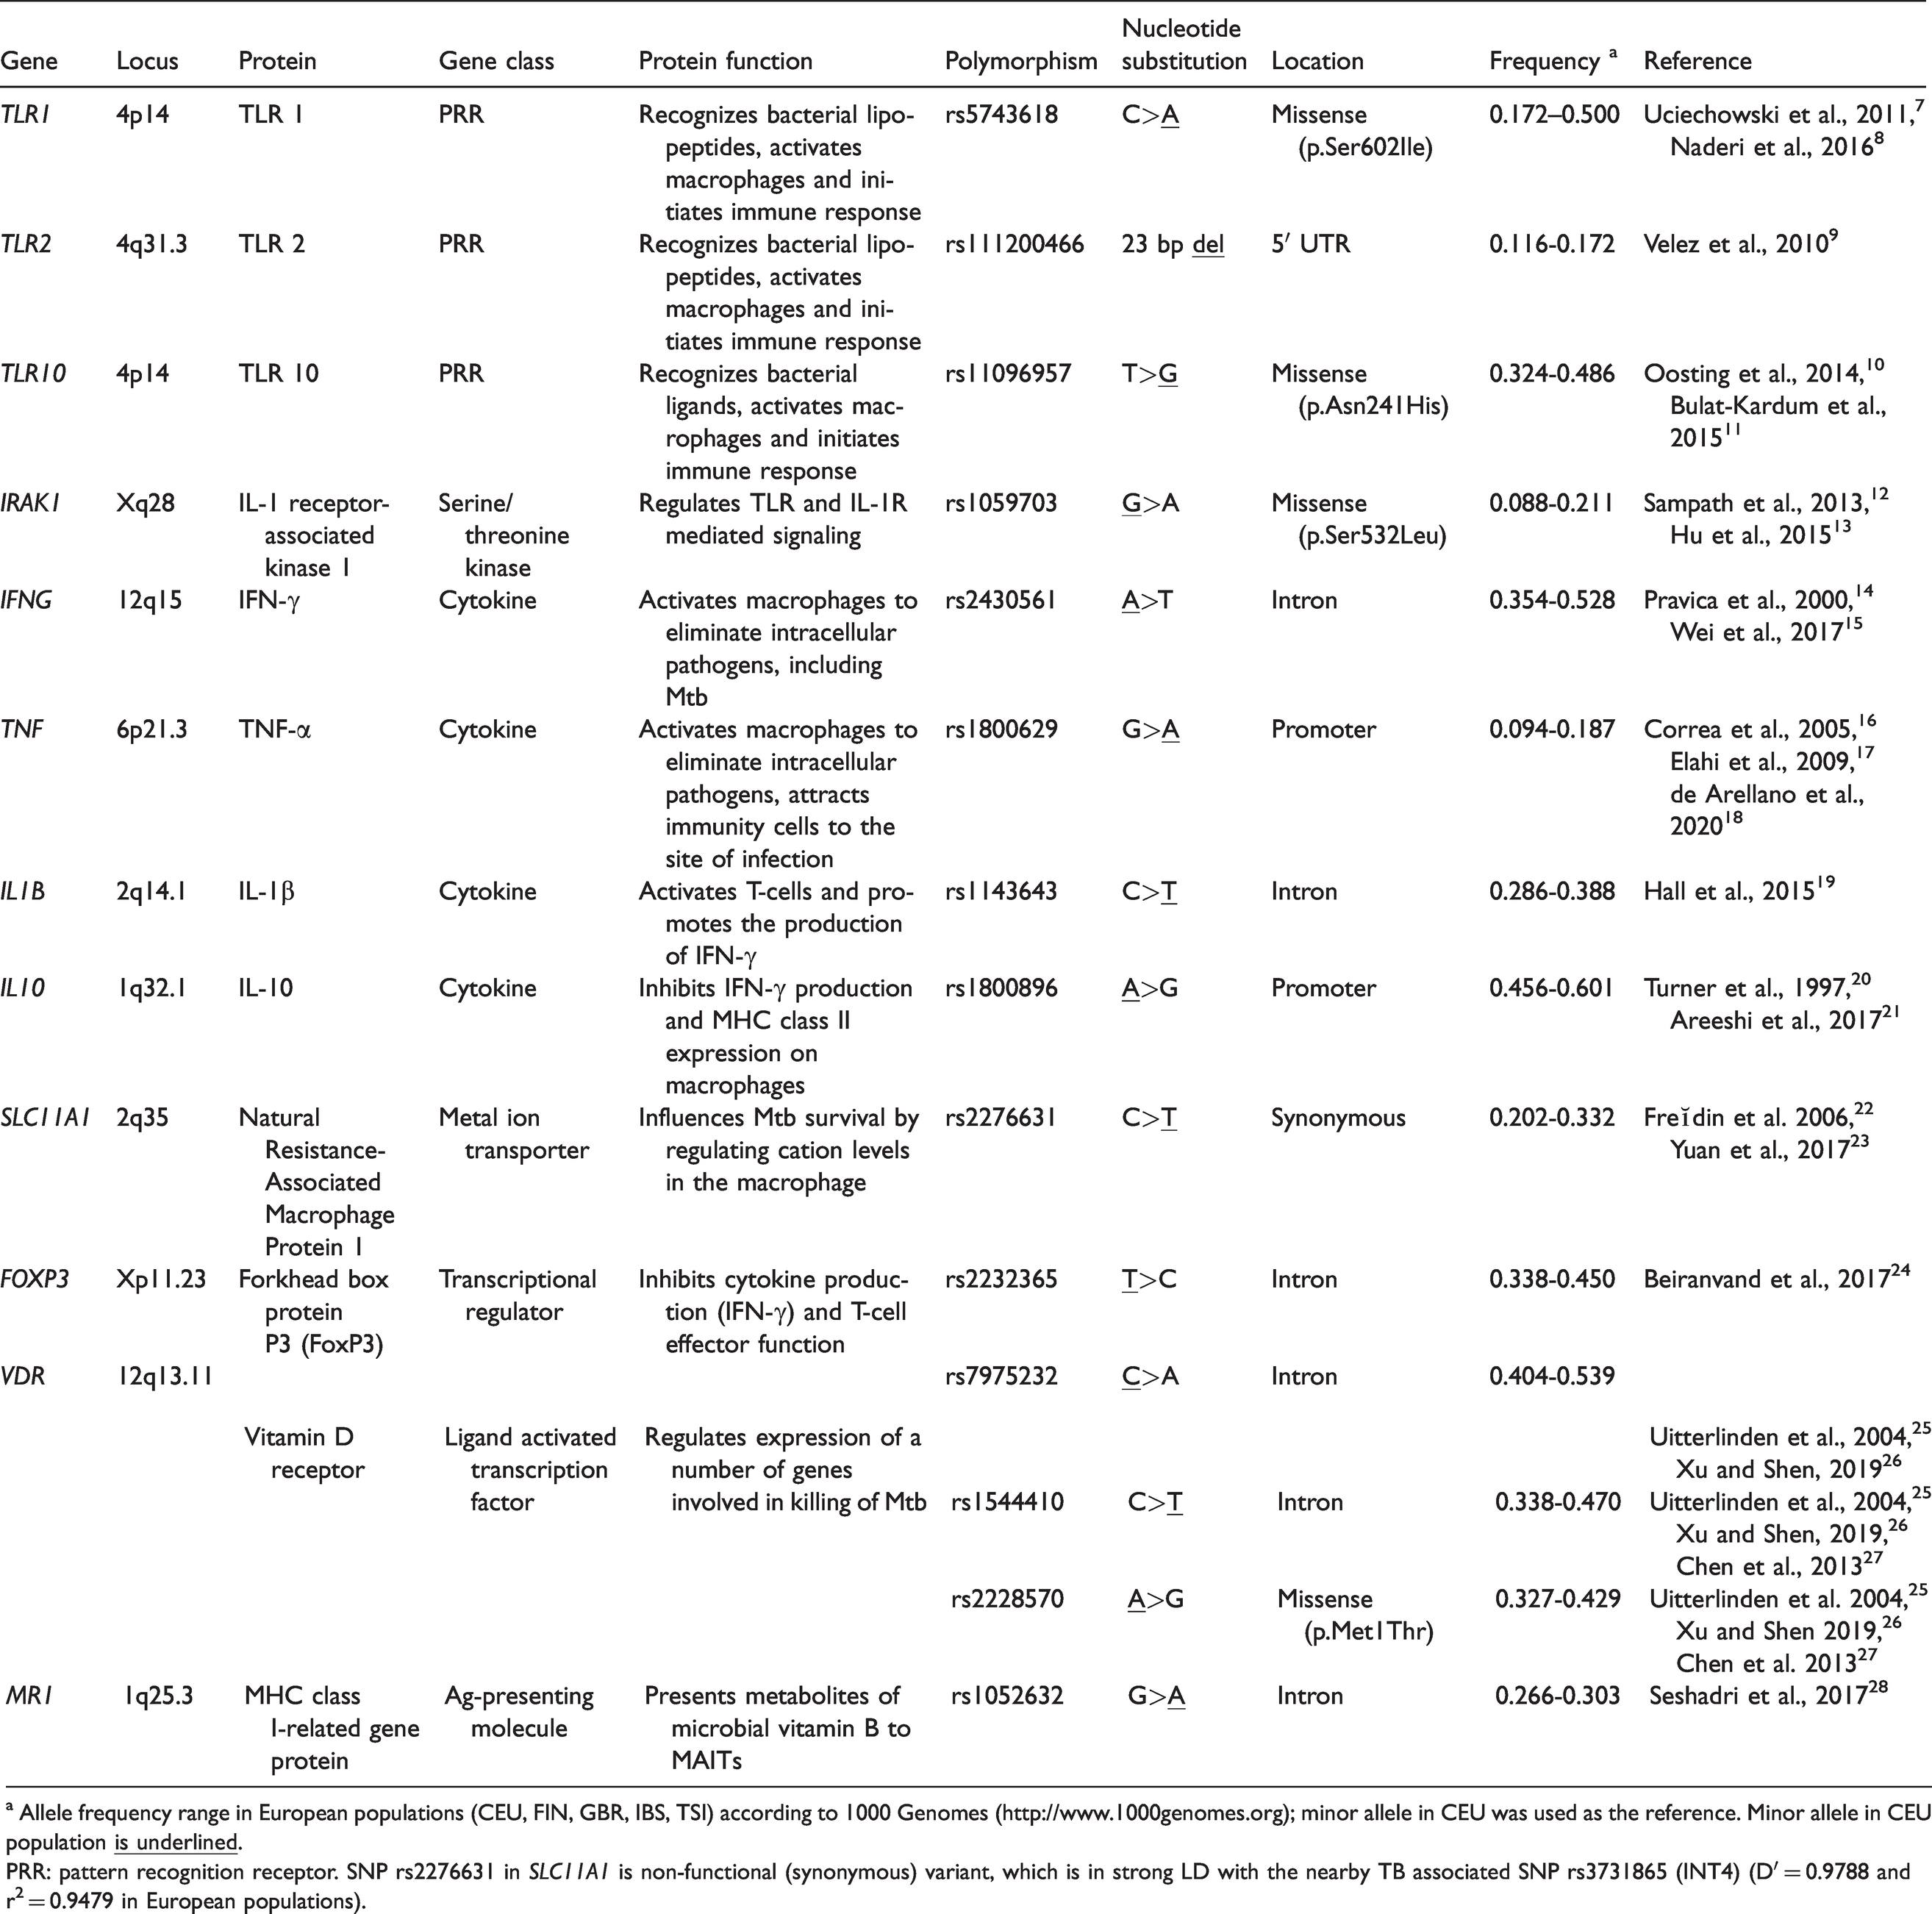
a Allele frequency range in European populations (CEU, FIN, GBR, IBS, TSI) according to 1000 Genomes (http://www.1000genomes.org); minor allele in CEU was used as the reference. Minor allele in CEU population
PRR: pattern recognition receptor. SNP rs2276631 in SLC11A1 is non-functional (synonymous) variant, which is in strong LD with the nearby TB associated SNP rs3731865 (INT4) (D′ = 0.9788 and r2 = 0.9479 in European populations).
The Republic of Moldova is a country with an unfavorable epidemiological situation regarding TB, ranking first for TB incidence (86/100,000 in 2018) in the European region. 29 The identification of host genetic factors may provide a biological and theoretical basis for better understanding the high prevalence of TB within the Moldavian population and ultimately for the development of effective TB prevention and control strategies.
Materials and methods
Samples
The investigated case-control cohort included 272 unrelated patients (120 women and 152 men; mean age at recruitment = 40.7 ± 12.7 yr; mean age at diagnosis = 39.1 ± 12.2 yr) with infiltrative pulmonary TB. The diagnosis was based on clinical symptoms and chest radiographic findings and was confirmed by bacteriological assessment. None of the patients had a clinical history of diabetes mellitus, HIV infection, or receipt of immunosuppressive therapy. All patients were Caucasian and predominantly Moldavians (91.5%). The control group included 251 unrelated and ethnically matched (Moldavians, 87%) healthy individuals (150 women and 101 men; mean age at recruitment = 47.6 ± 14.1 yr) without history of TB and with normal radiographic examination findings. Control group subjects were recruited from the same high-burden TB-affected community as patients. Venous blood samples (EDTA anticoagulant added) were collected from TB patients and controls, and genomic DNA was extracted from peripheral blood leukocytes using a standard salting-out method. 30 All cases and controls were vaccinated with the BCG vaccine, which was confirmed by the presence of a scar in the left shoulder. This study was approved by the Ethics Committee of the Institute of Phthisiopneumology (Republic of Moldova), and the Declaration of Helsinki protocols were followed. Each participant was thoroughly informed and provided written informed consent prior to enrollment in the study.
Polymorphism selection and genotyping
The following polymorphisms, VDR rs7975232, VDR rs1544410, VDR rs2228570, MR1 rs1052632, TLR1 rs5743618, TLR2 rs111200466, TLR10 rs11096957, SLC11A1 rs2276631, IL1B rs1143643, IL10 rs1800896, IFNG rs2430561, TNF rs1800629, IRAK1 rs1059703, and FOXP3 rs2232365 were investigated. Polymorphisms were selected based on previously published associations with TB, thus increasing the chance of selecting polymorphisms with phenotypic effects (Table 1). All polymorphisms except the insertion/deletion variant rs111200466 in TLR2 (–196 to –174 ins/del) were single nucleotide polymorphisms (SNPs).
The genotypes of the 12 SNPs (VDR rs7975232, VDR rs1544410, VDR rs2228570, MR1 rs1052632, TLR10 rs11096957, SLC11A1 rs2276631, IL1B rs1143643, IL10 rs1800896, IFNG rs2430561, TNF rs1800629, IRAK1 rs1059703, and FOXP3 rs2232365) were determined using Agena iPlex assays using a MALDI-TOF mass array spectrometer (Agena, San Diego, CA) following the manufacturer’s recommendations. Primers were designed using the Assay Design Suite v2.0 (https://agenacx.com). Two of the SNPs were not in Hardy–Weinberg equilibrium (HWE) in the control group: rs11096957 in TLR10 (P = 0.0071) and rs2430561 in IFNG (P = 0.013). Genotyping errors were excluded by random re-genotyping of the respective SNPs. Confirmatory genotyping of TLR10 rs11096957 was performed in 52 control samples (21%) using PCR–RFLP. PCR products were digested with the restriction endonuclease NlaIII (New England Biolabs; Arundel, Australia) and subjected to 2% agarose gel electrophoresis.
Confirmatory genotyping of IFNG rs2430561 was carried out by PCR with sequence-specific primers in 105 control samples (42%), and amplified SNP products were electrophoresed on 2% agarose gel. Additionally, SNPs TNF rs1800629 and TLR6 rs5743810 (the latter from our previous study) 6 , which exhibited a relationship with TB, were Sanger-sequenced (primers are in Supplemental Table S1) in 50 (∼10%) randomly selected samples, to confirm the quality of MALDI-TOF genotyping. All sequenced SNPs were 100% consistent with those obtained by MALDI-TOF.
Two polymorphisms, TLR1 rs5743618 and TLR2 rs111200466, could not be included in the Agena iPlex assay, and therefore, were genotyped using PCR and PCR–RFLP. Genotyping of rs5743618 was performed using PCR–RFLP. PCR products were digested with the restriction endonuclease AluI (New England Biolabs; Arundel, Australia) and subjected to 2% agarose gel electrophoresis. Genotyping of the rs111200466 polymorphism was conducted by standard PCR and agarose gel electrophoresis (2%).
The primer sequences, PCR conditions, and restriction enzymes for genotyping/sequencing of TLR2 rs111200466, IFNG rs2430561, TLR1 rs5743618, TLR10 rs11096957, TNF rs1800629, and TLR6 rs5743810 are outlined in Supplemental Table S1. The methodology used for the genotyping of TLR2 rs111200466, IFNG rs2430561, and TLR1 rs5743618 polymorphisms has been previously described. 14 , 31 , 32
Statistical analysis
HWE tests were performed in controls and cases using Fisher’s exact test. Fisher’s exact test was also used to compare differences in allele frequencies between the groups. Odds ratios (ORs) and 95% confidence intervals (CIs) were calculated to measure the associations between SNPs and the risk of pulmonary TB. Minor alleles were assumed to be effect-associated alleles in all the tests. In addition, logistic regression was used to assess the association of each SNP with the risk of pulmonary TB using a log-additive genetic model. To account for possible bias due to statistically significant differences in age and sex distributions between the case and control groups (P < 0.0001 and P = 0.0004, respectively), the variables age and sex were included as covariates in the logistic regression analysis. All genetic tests described above were based on single SNP tests and were performed using the PLINK software package (version 1.9, http://pngu.mgh.harvard.edu/purcell/plink/). 33 For IRAK1 rs1059703 and FOXP3 rs2232365 SNPs located on the X chromosome, HWE P values were calculated in females only and association tests were performed separately in men and women; therefore, 16 tests were conducted in total. To correct the significance level for multiple testing, Bonferroni correction was applied, and the significance level for all statistical tests was set at P < 0.003125 (0.05/16).
Haplotype analysis was performed for five polymorphisms in the TLR1-TLR6-TLR10 gene cluster, two polymorphisms in the TLR2 gene and three VDR gene polymorphisms using Haploview version 4.2 software. 34 SNPs TLR1 rs4833095, TLR2 rs3804099, TLR6 rs5743810, and TLR10 rs11466657 were taken from the previous study conducted on the same cohort of TB patients and healthy controls. The solid spine of the linkage disequilibrium (LD) algorithm was applied to define the haplotype blocks. Differences in haplotype frequencies were tested using the χ2 test. Haplotypes with frequencies below 1% were excluded from the analyses. Multiple comparisons of haplotype frequencies were corrected by generating empirical P values via 10,000 permutations.
Pairwise epistatic interactions associated with susceptibility to TB were investigated via an exhaustive search of all pairwise combinations. There were 1065 combinations (741 common and 2 × 162 sex-specific) and an exhaustive search was the easiest way to find the best combination. Nonparametric methods such as multifactor dimensionality reduction (MDR) or k-nearest neighbors (KNN) check only a small part of the entire search space to be computationally effective and are applied mostly when a large number of markers are to be tested (e.g. in GWAS experiments). 35 , 36 Another drawback of such methods is the interpretation of results, for example, when a strong marginal effect of one SNP makes the effects of several other polymorphisms in the interaction negligible. 35 , 37 To address the latter, we restricted the search to the interactions of only two SNPs and evaluated the added value of the pairwise effects over individual effects.
Overall, pairwise epistatic analysis was performed as follows. First, we found SNP combinations associated with TB using logistic regression adjusted for sex and age under log-additive genetic model (implemented in software package SNPstats) 38 for all pairs of the 43 genetic markers from this and our previous study.6 We used the log-additive model because it is a generalized model that is the best choice when the true inheritance pattern is unknown. Second, we found the exact genotype combination(s) that most contributed to the associations revealed in the previous step. Two methods were applied to all significant pairs (P < 0.05): logistic regression adjusted for sex and age, and Fisher’s exact test. 39 , 40 Here, no genetic model was required for regression, since in both methods, one specific combination was tested against all other genotypes. The advantage of the Fisher test is its clear biological interpretation, but it is not trivial to adjust it to sex and age differences in the datasets. Therefore, logistic regression was used, which could easily incorporate such adjustment parameters.
To account for multiple testing, we used the Bonferroni correction and counted all tests of the first and second steps as independent, yielding a multiplication factor of 1/(1065 + 543) = 0.000622.
Power calculations were done using CaTS 41 with a log-additive genetic model, assuming significance of 0.05 and the reported TB disease prevalence of 0.0020. 29 The study had sufficient power (> 80%) to detect effect sizes (ORs) of 1.7 and 1.5 for high-risk allele frequencies of > 0.10 and > 0.20, respectively.
Results
Single polymorphism analysis
The overall genotyping performance in the study population was 83.2–100.0% depending on the SNP (Supplemental Table S2). Distributions of alleles of the investigated SNPs were in accordance with HWE in both groups except for TLR10 rs11096957 (Supplemental Table S2), which showed some deviation from HWE in controls (P = 0.0078). The minor allele frequencies of all polymorphisms in our controls were similar those in the populations of European descent from the 1000 Genomes Project database (Table 1). Association analysis between individual SNPs and TB revealed a moderate association between rs1800629 in TNF and pulmonary TB risk (Fisher exact test: OR = 0.63, P value = 0.01843; logistic regression: OR = 0.64, P = 0.03643) (Table 2), which did not remain significant after Bonferroni correction for multiple testing (P > 0.003125). None of the other loci showed an association with pulmonary TB risk (Table 2).
Association analysis of individual polymorphisms with pulmonary TB risk. For genotype data, see Supplementary Table 2.
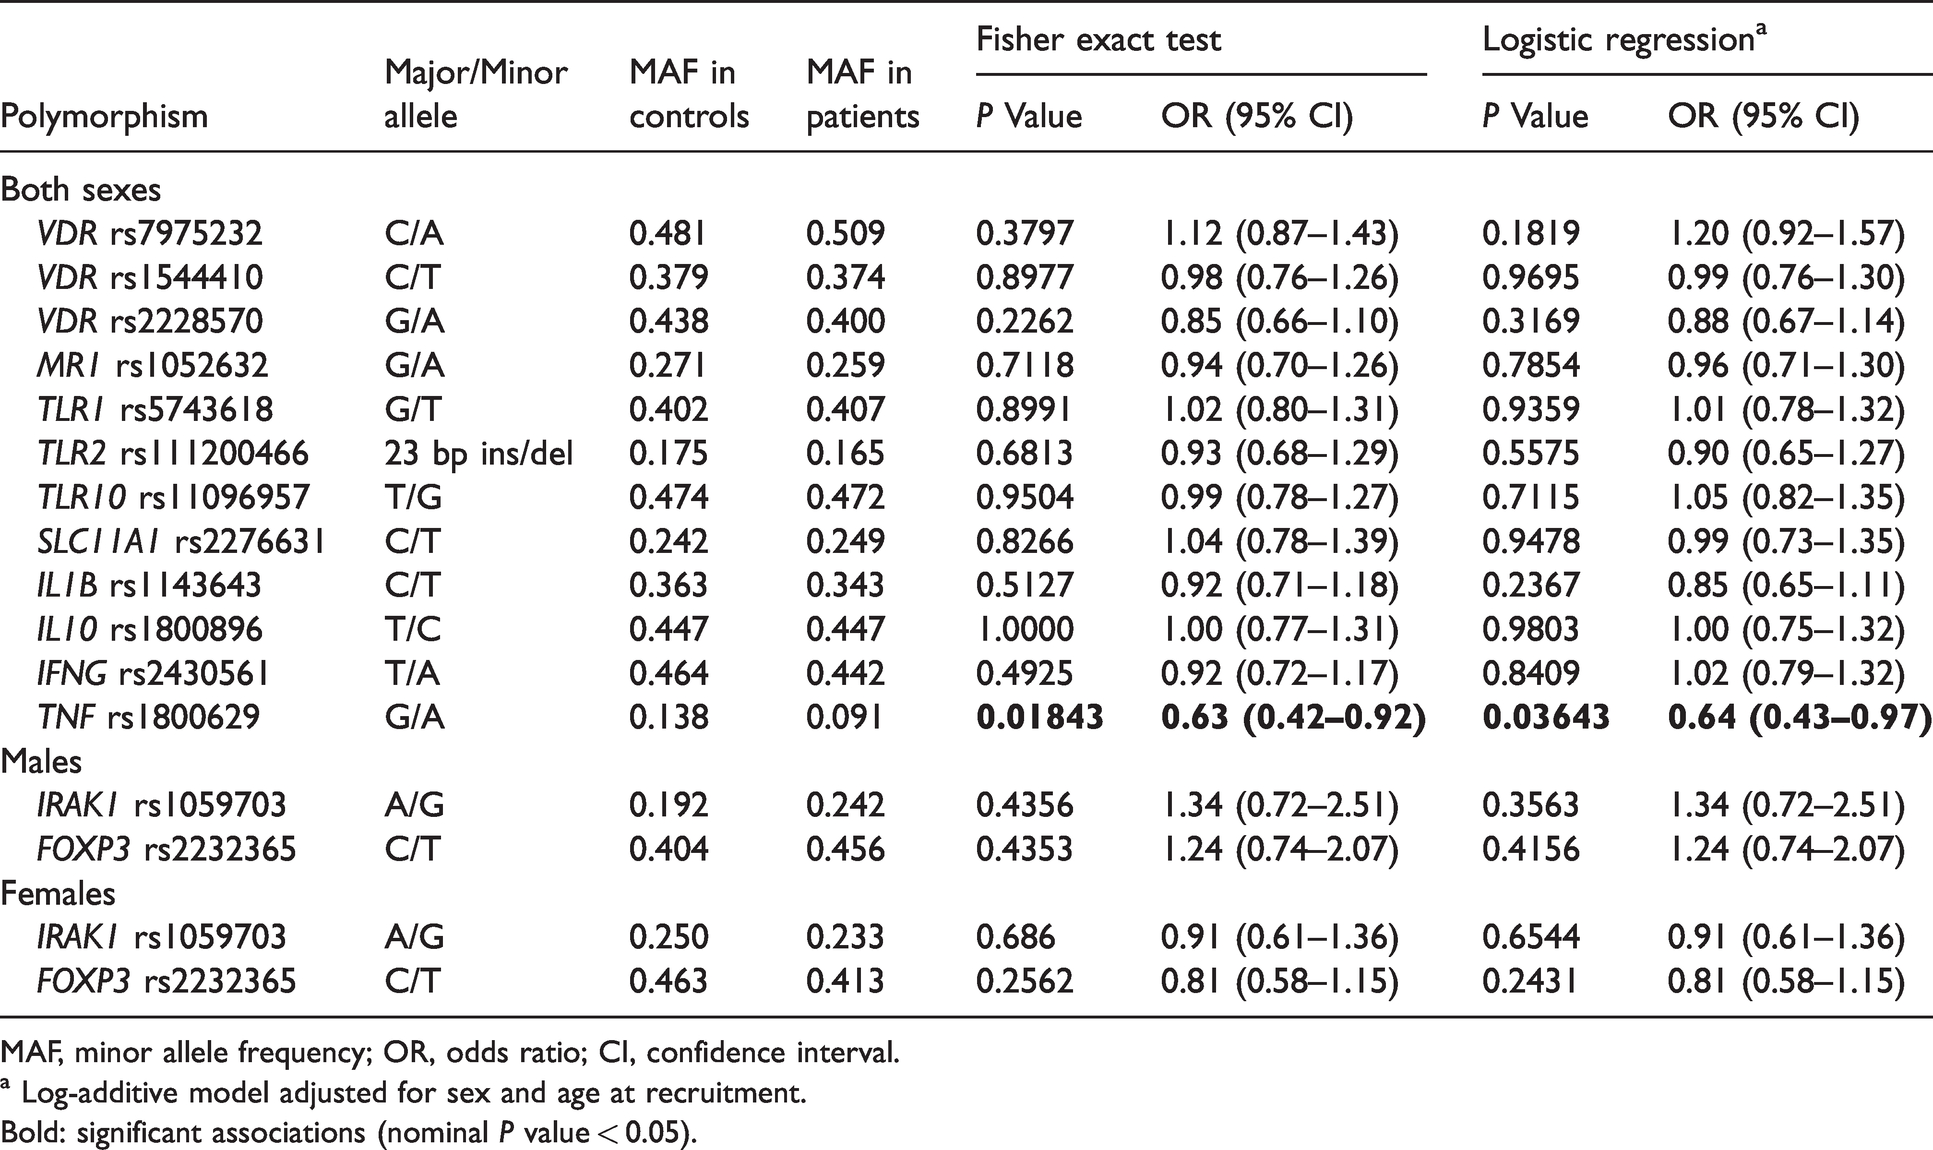
MAF, minor allele frequency; OR, odds ratio; CI, confidence interval.
a Log-additive model adjusted for sex and age at recruitment.
Bold: significant associations (nominal P value < 0.05).
Haplotype analysis
Nine common haplotypes in the gene cluster TLR1-TLR6-TLR10, four in TLR2, and three in VDR were identified at a frequency ≥1% by LD analysis (Figure 1). The rs11466657-rs11096957-rs5743618-rs4833095-rs5743810 haplotype A-T-G-T-A of the gene cluster TLR1-TLR6-TLR10 was significantly higher in the TB group compared with the controls (P = 0.0485; Table 3). However, after 10,000-fold permutation testing, this haplotype was not significant (P = 0.4463). In addition, marginal differences were observed between cases and controls for the haplotype A-T-G-T-G (rs11466657-rs11096957-rs5743618-rs4833095-rs5743810) in the gene cluster TLR1-TLR6-TLR10 (P = 0.0688) and haplotypes ins-T and ins-C (rs111200466-rs3804099) in TLR2 (P = 0.0732 and P = 0.0987, respectively). None of the remaining haplotypes were associated with the risk of pulmonary TB in this study (Table 3).
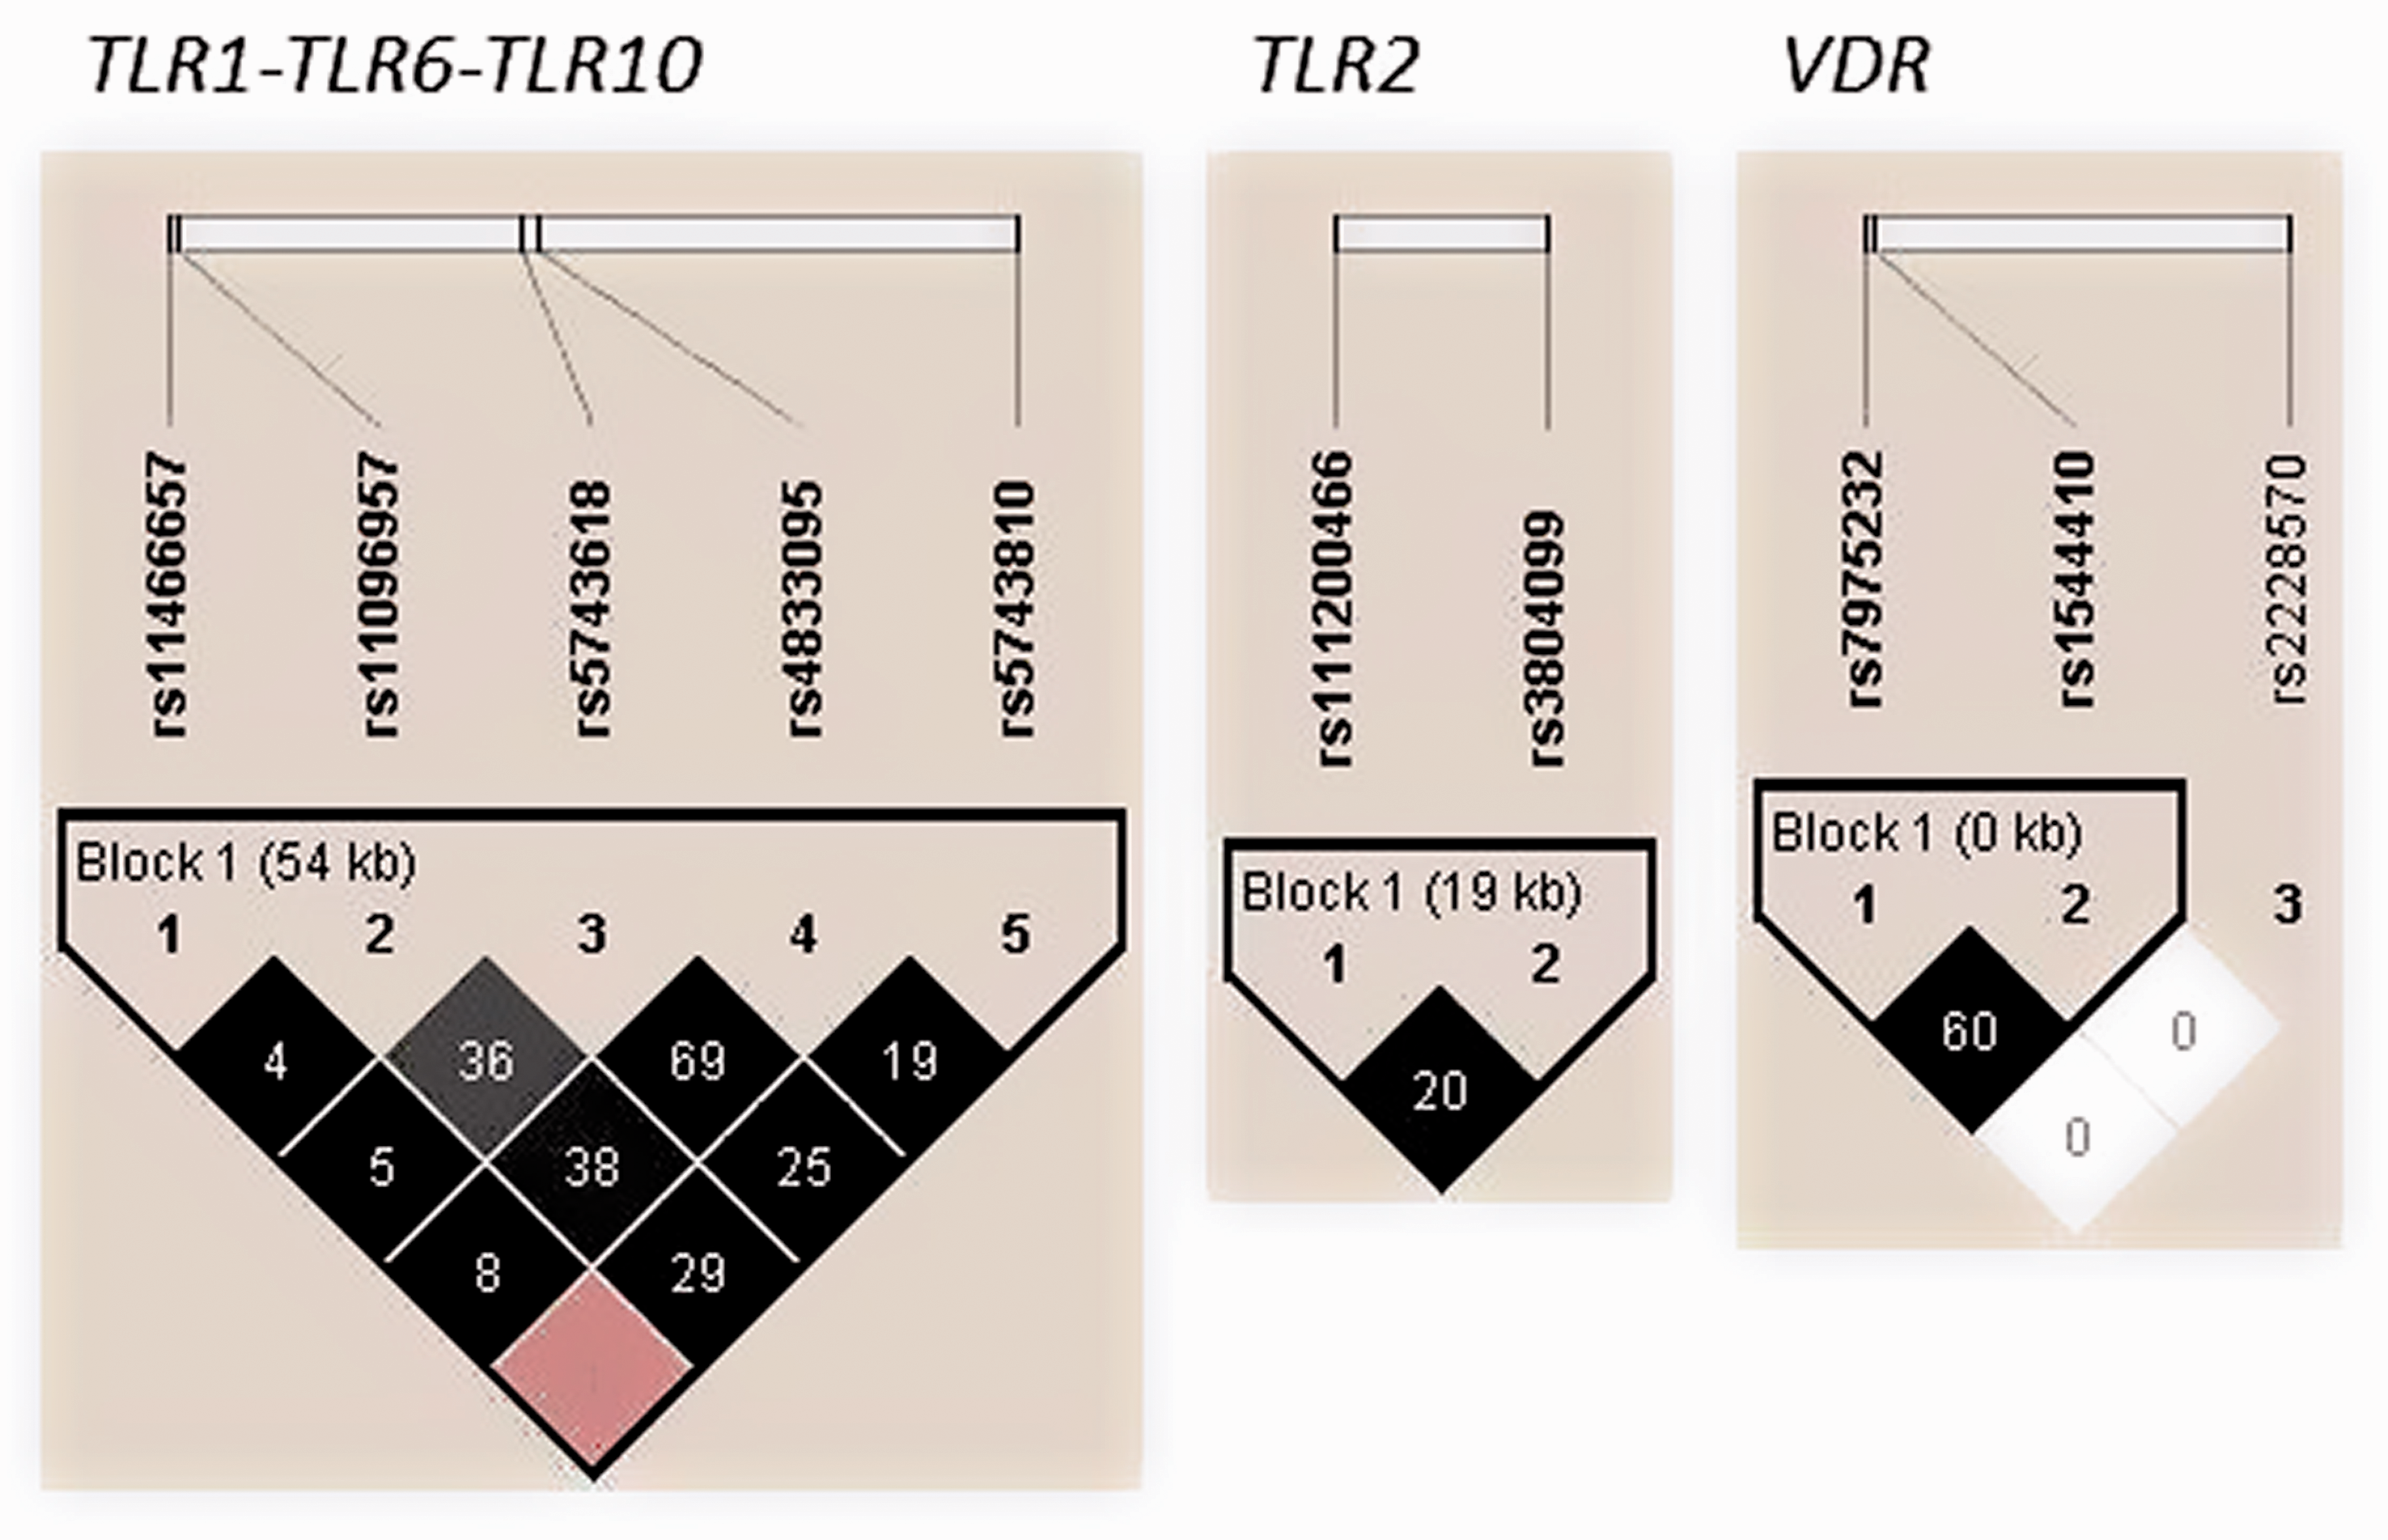
Linkage disequilibrium (LD) plots of TLR2, VDR and TLR1-TLR6-TLR10 polymorphisms in cases and controls. The colours of the squares represent D’ values, with black being D’=1, and white D’=0. r2 values (%) are indicated on the squares.
Haplotype frequencies and associations with pulmonary TB.
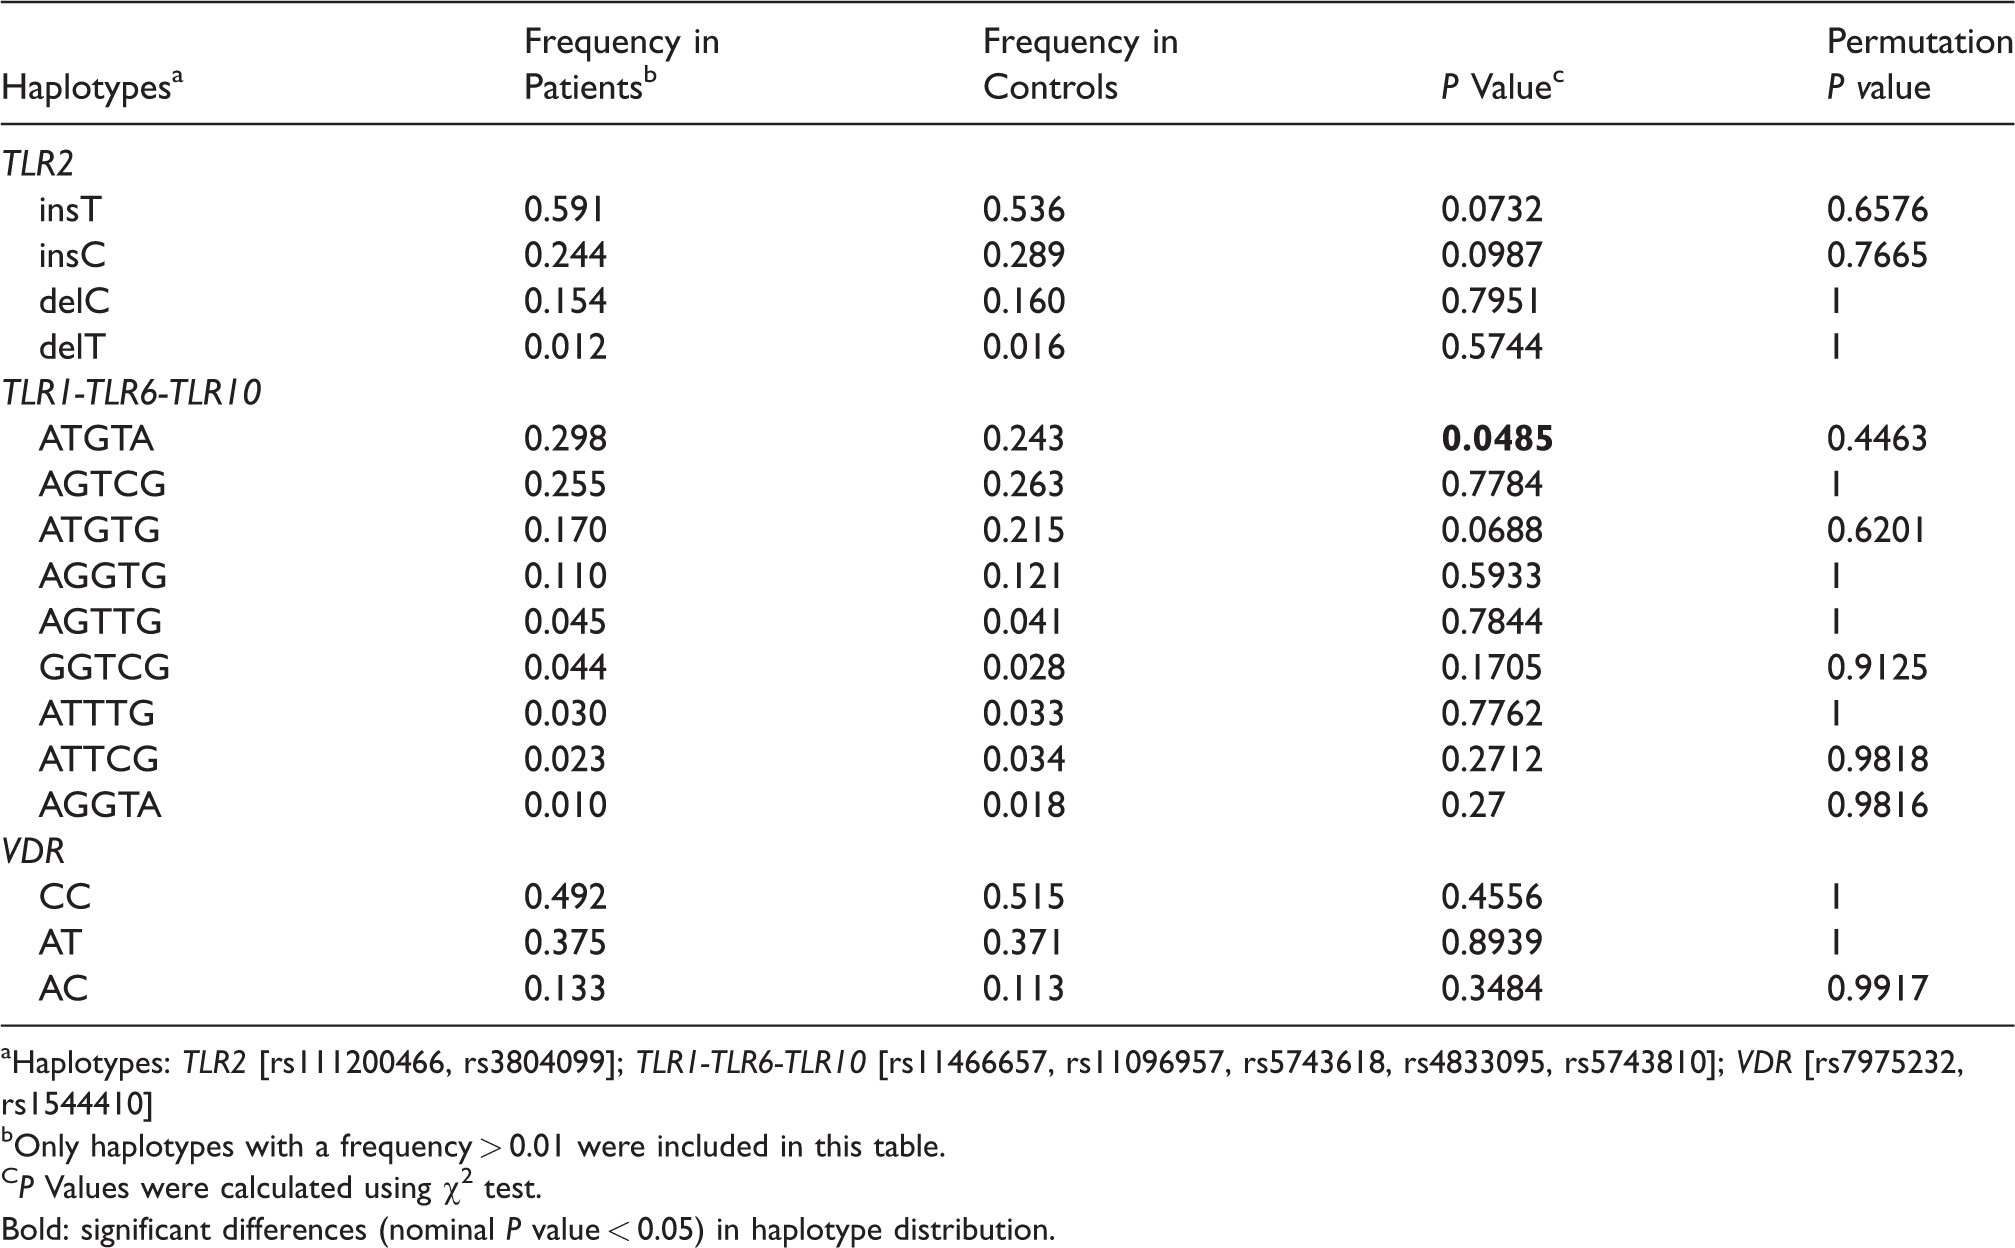
aHaplotypes: TLR2 [rs111200466, rs3804099]; TLR1-TLR6-TLR10 [rs11466657, rs11096957, rs5743618, rs4833095, rs5743810]; VDR [rs7975232, rs1544410]
bOnly haplotypes with a frequency > 0.01 were included in this table.
CP Values were calculated using χ2 test.
Bold: significant differences (nominal P value < 0.05) in haplotype distribution.
Gene–gene interaction analysis
Analysis of SNP–SNP combinations using a logistic regression model revealed 59 significant (P value < 0.05) genetic interactions (Supplemental Table S3), with the smallest P values observed for the marker pairs TOLLIP rs3793964–IRAK2 rs3844283 (P = 0.0025), TLR2 rs111200466–TOLLIP rs5743899 (P = 0.0044), and TLR10 rs11096957–TLR6 rs5743810 (P = 0.0052). Although none of these associations exceeded the conservative Bonferroni-corrected threshold of P value = 4.7 × 10⁻⁵ (0.05/1065), they suggest a potential role in conferring TB risk and therefore were pipelined into the in-depth genotype combination analysis using Fisher’s exact test and logistic regression adjusted for sex and age differences in the datasets. Genotype combinations reported by both methods were considered significant.
This resulted in 62 nominally significant associations (P value < 0.05 for either logistic regression or Fisher’s exact test) out of 543 possible genotype combinations (Supplemental Table S4). The strongest association was observed between TB and the combination of TLR6 rs5743810 GA and TLR10 rs11096957 GT genotypes (Fisher exact test P value = 1.5 × 10⁻⁵; logistic regression P value = 1.9 × 10⁻⁵; Table 4). This association remained significant after Bonferroni correction (P value = 0.05/(1065 + 543) = 3.5 × 10⁻⁵). Remarkably, the effect of this genotype combination on TB risk (OR = 2.48) was much greater than that of the individual genotypes (heterozygous model, OR = 1.72, P = 0.0042 and OR = 1.33, P = 0.13 for rs5743810 and rs11096957, respectively), implying a strong synergistic interaction between the two polymorphisms. None of the other genotype combinations were significant after the Bonferroni correction.
Association of combined genotypes TLR6 rs5743810 and TLR10 rs11096957 with pulmonary TB.
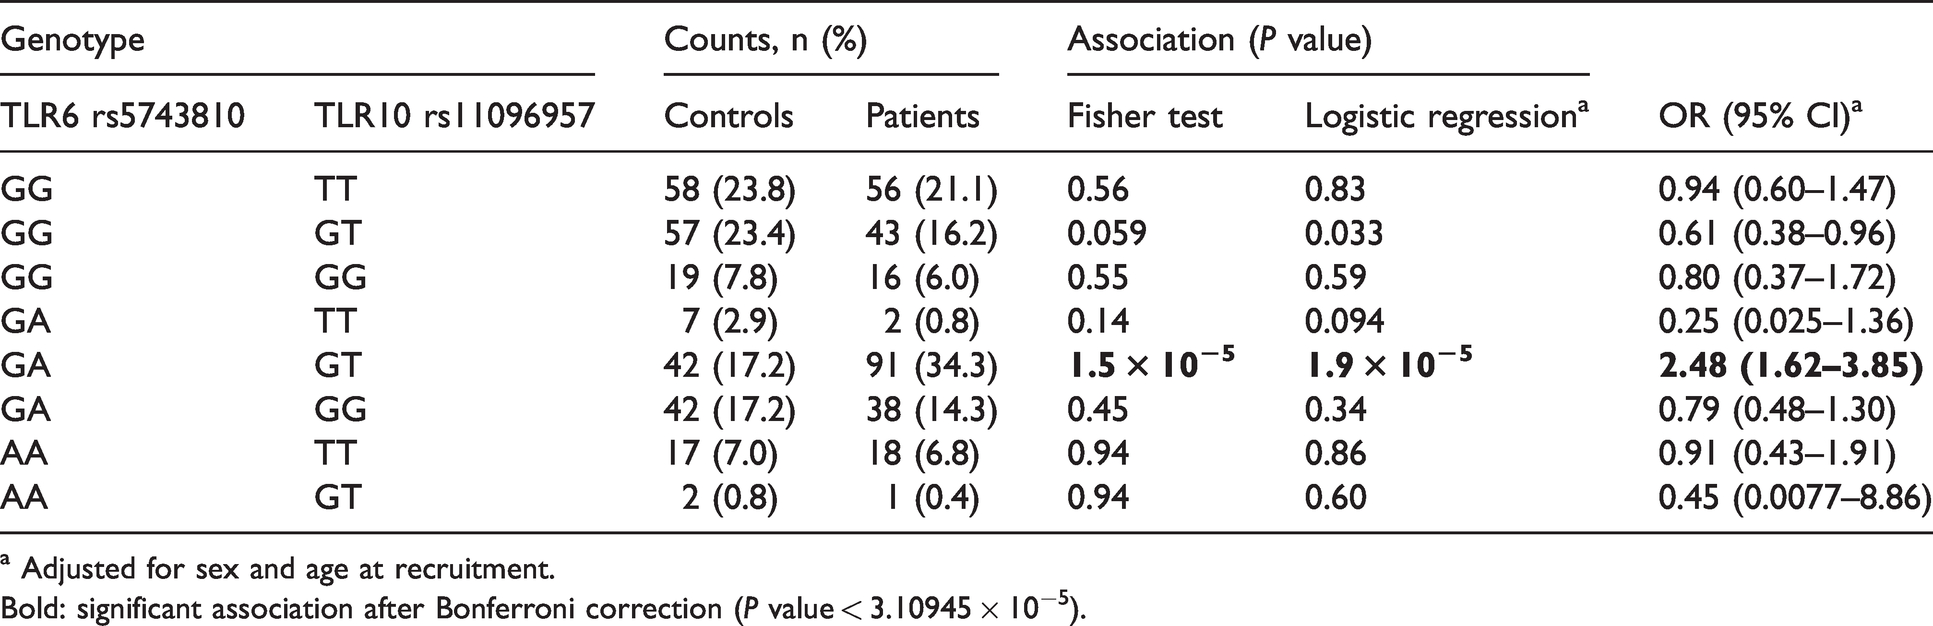
a Adjusted for sex and age at recruitment.
Bold: significant association after Bonferroni correction (P value < 3.10945 × 10⁻⁵).
Discussion
In the present study, we applied a candidate gene approach and tested the association of 14 polymorphisms in genes VDR, MR1, TLR1, TLR2, TLR10, SLC11A1, IL1B, IL10, IFNG, TNF, IRAK1, and FOXP3 with the risk of pulmonary TB in Moldavian population. Although these genes are critical components of human immunity and their polymorphisms have been implicated in susceptibility to TB, we could not find convincing statistical evidence for their association with the risk of pulmonary TB. A borderline association was revealed for polymorphism rs1800629 in the TNF gene only, but this was not significant after corrections for multiple testing by the Bonferroni method. Overall, the results presented here do not support a major role of the analyzed common variants in conferring susceptibility or resistance to pulmonary TB in the Moldavian population.
The inability to reach significance level after Bonferroni correction may be explained by a fairly small sample size and inadequate statistical power to produce convincing associations for polymorphisms with low and moderate effects (OR < 1.5). For this reason, we cannot completely rule out the possibility of true functional effects for variants with nominal associations, particularly for the TNF rs1800629 polymorphism. The TNF gene encodes a multifunctional pro-inflammatory cytokine, TNF-α, which is mainly produced by activated monocytes, macrophages, and T-lymphocytes when stimulated by mycobacterial antigens. TNF-α acts synergistically with IFN-γ to induce macrophage killing of M. tuberculosis. 42 In addition, TNF-α is involved in the recruitment of leukocytes to the site of infection and contributes to the formation of TB granuloma, preventing the spread of infection. 42 It is reported that treatment with TNF-α inhibitors leads to reactivation of latent TB infection, indicating TNF-α is a key cytokine toward resistance to M. tuberculosis. 43 SNP rs1800629 (−308G>A) is located within regulatory hotspot region and thus influences transcription critically. 44 , 45 The minor allele A of rs1800629 has been associated with increased expression of TNF and higher plasma levels of TNF-α. 17 In agreement with published functional studies, our results demonstrated a higher frequency of allele A in controls than in cases, suggesting its protective role against TB (OR = 0.63). Similarly, allele A was protectively associated with TB in the Colombian 16 and Mexican 18 populations. However, other genetic epidemiologic studies involving patient cohorts from various population groups, including Malawi, 46 Iran, 47 Indian, 48 Cambodian, 49 Chinese Han, and Tibetan, 50 did not confirm these findings. The disparity in results across studies may be explained by certain factors, such as inadequate sample sizes and differences in environmental, demographic, cultural, host genetic, and bacterial characteristics of M. tuberculosis strains.
Additionally, a nominal yet suggestive association was demonstrated for haplotype A-T-G-T-A of the block rs11466657-rs11096957-rs5743618-rs4833095-rs5743810 in the cluster TLR1-TLR6-TLR10. TLR1, TLR6, and TLR10 are located in a 54-kb genomic region on chromosome 4p14 and encode proteins that share a high degree of homology in their amino acid sequences. All three genes belong to the TLR2 subfamily of TLRs, which plays a critical role in the early recognition of M. tuberculosis and subsequent activation of immune responses. 51 Individual polymorphisms and haplotypes within the TLR10-TLR1-TLR6 locus have been associated with altered susceptibility to infectious diseases, including mycobacterial infections of leprosy and TB. 11 ,52–55 Unfortunately, different sets of SNPs used in this and other studies complicate direct comparisons of the results. Even so, the identified haplotype A-T-G-T-A and, more generally, variations in genes TLR10, TLR1, and TLR6 could be promising replication targets for future studies in larger cohorts.
Genetic interactions are thought to underlie susceptibility or resistance to TB, 5 , 56 so they could explain some of the missing heritability in this study. Therefore, we also analyzed the impact of allele combinations on the risk of TB. The strongest evidence for interaction in our data was between SNPs rs5743810 and rs11096957 located in TLR6 and TLR10, respectively. Interestingly, the two SNPs showed no or only a weak effect on TB susceptibility when evaluated alone, indicating a synergetic mechanism of TLR6 rs5743810 and TLR10 rs11096957 in conferring risk for pulmonary TB. The interactions between these SNPs are biologically plausible. First, TLRs are key players in host defense against infections. Specifically, TLR6 functionally interacts with TLR2 to mediate the cellular response to bacterial lipoproteins and activate the NF-κB pathway and inflammatory events through MyD88-dependent signaling. 10 , 51 , 55 TLR10 also can form heterodimers with TLR2, but its specific ligands have not yet been identified and its downstream signaling is not fully understood. It is thought to act through both MyD88-dependent and -independent signaling pathways with inhibitory effects on inflammation. 10 The genetic interaction between TLR6 and TLR10 observed in this study may reflect their mutual functional contribution to M. tuberculosis recognition and subsequent downstream signaling (Figure 2). Second, the SNPs in TLR6 and TLR10 genes were previously shown to be of functional significance. In fact, the two SNPs are non-synonymous variants located in the extracellular (leucine-rich repeat) domains of the encoded proteins. Both ex vivo and in vitro experiments showed that SNPs rs5743810 (Ser249Pro) and rs11096957 (Asn241His) may influence pro-inflammatory cytokine production in humans. 10 , 57 , 58 In addition, rs5743810 was observed to affect NF-κB signaling activity, thereby modulating inflammatory responses. 59 Furthermore, these two polymorphisms have been associated with several immune-related pathologic conditions and infectious diseases, including TB. 11 , 54 , 55 , 60 These data support the relevance of additive interaction between SNPs rs5743810 and rs11096957 and suggest a molecular mechanism by which genetic variations in TLR6 and TLR10 genes might increase susceptibility to TB (Figure 2).
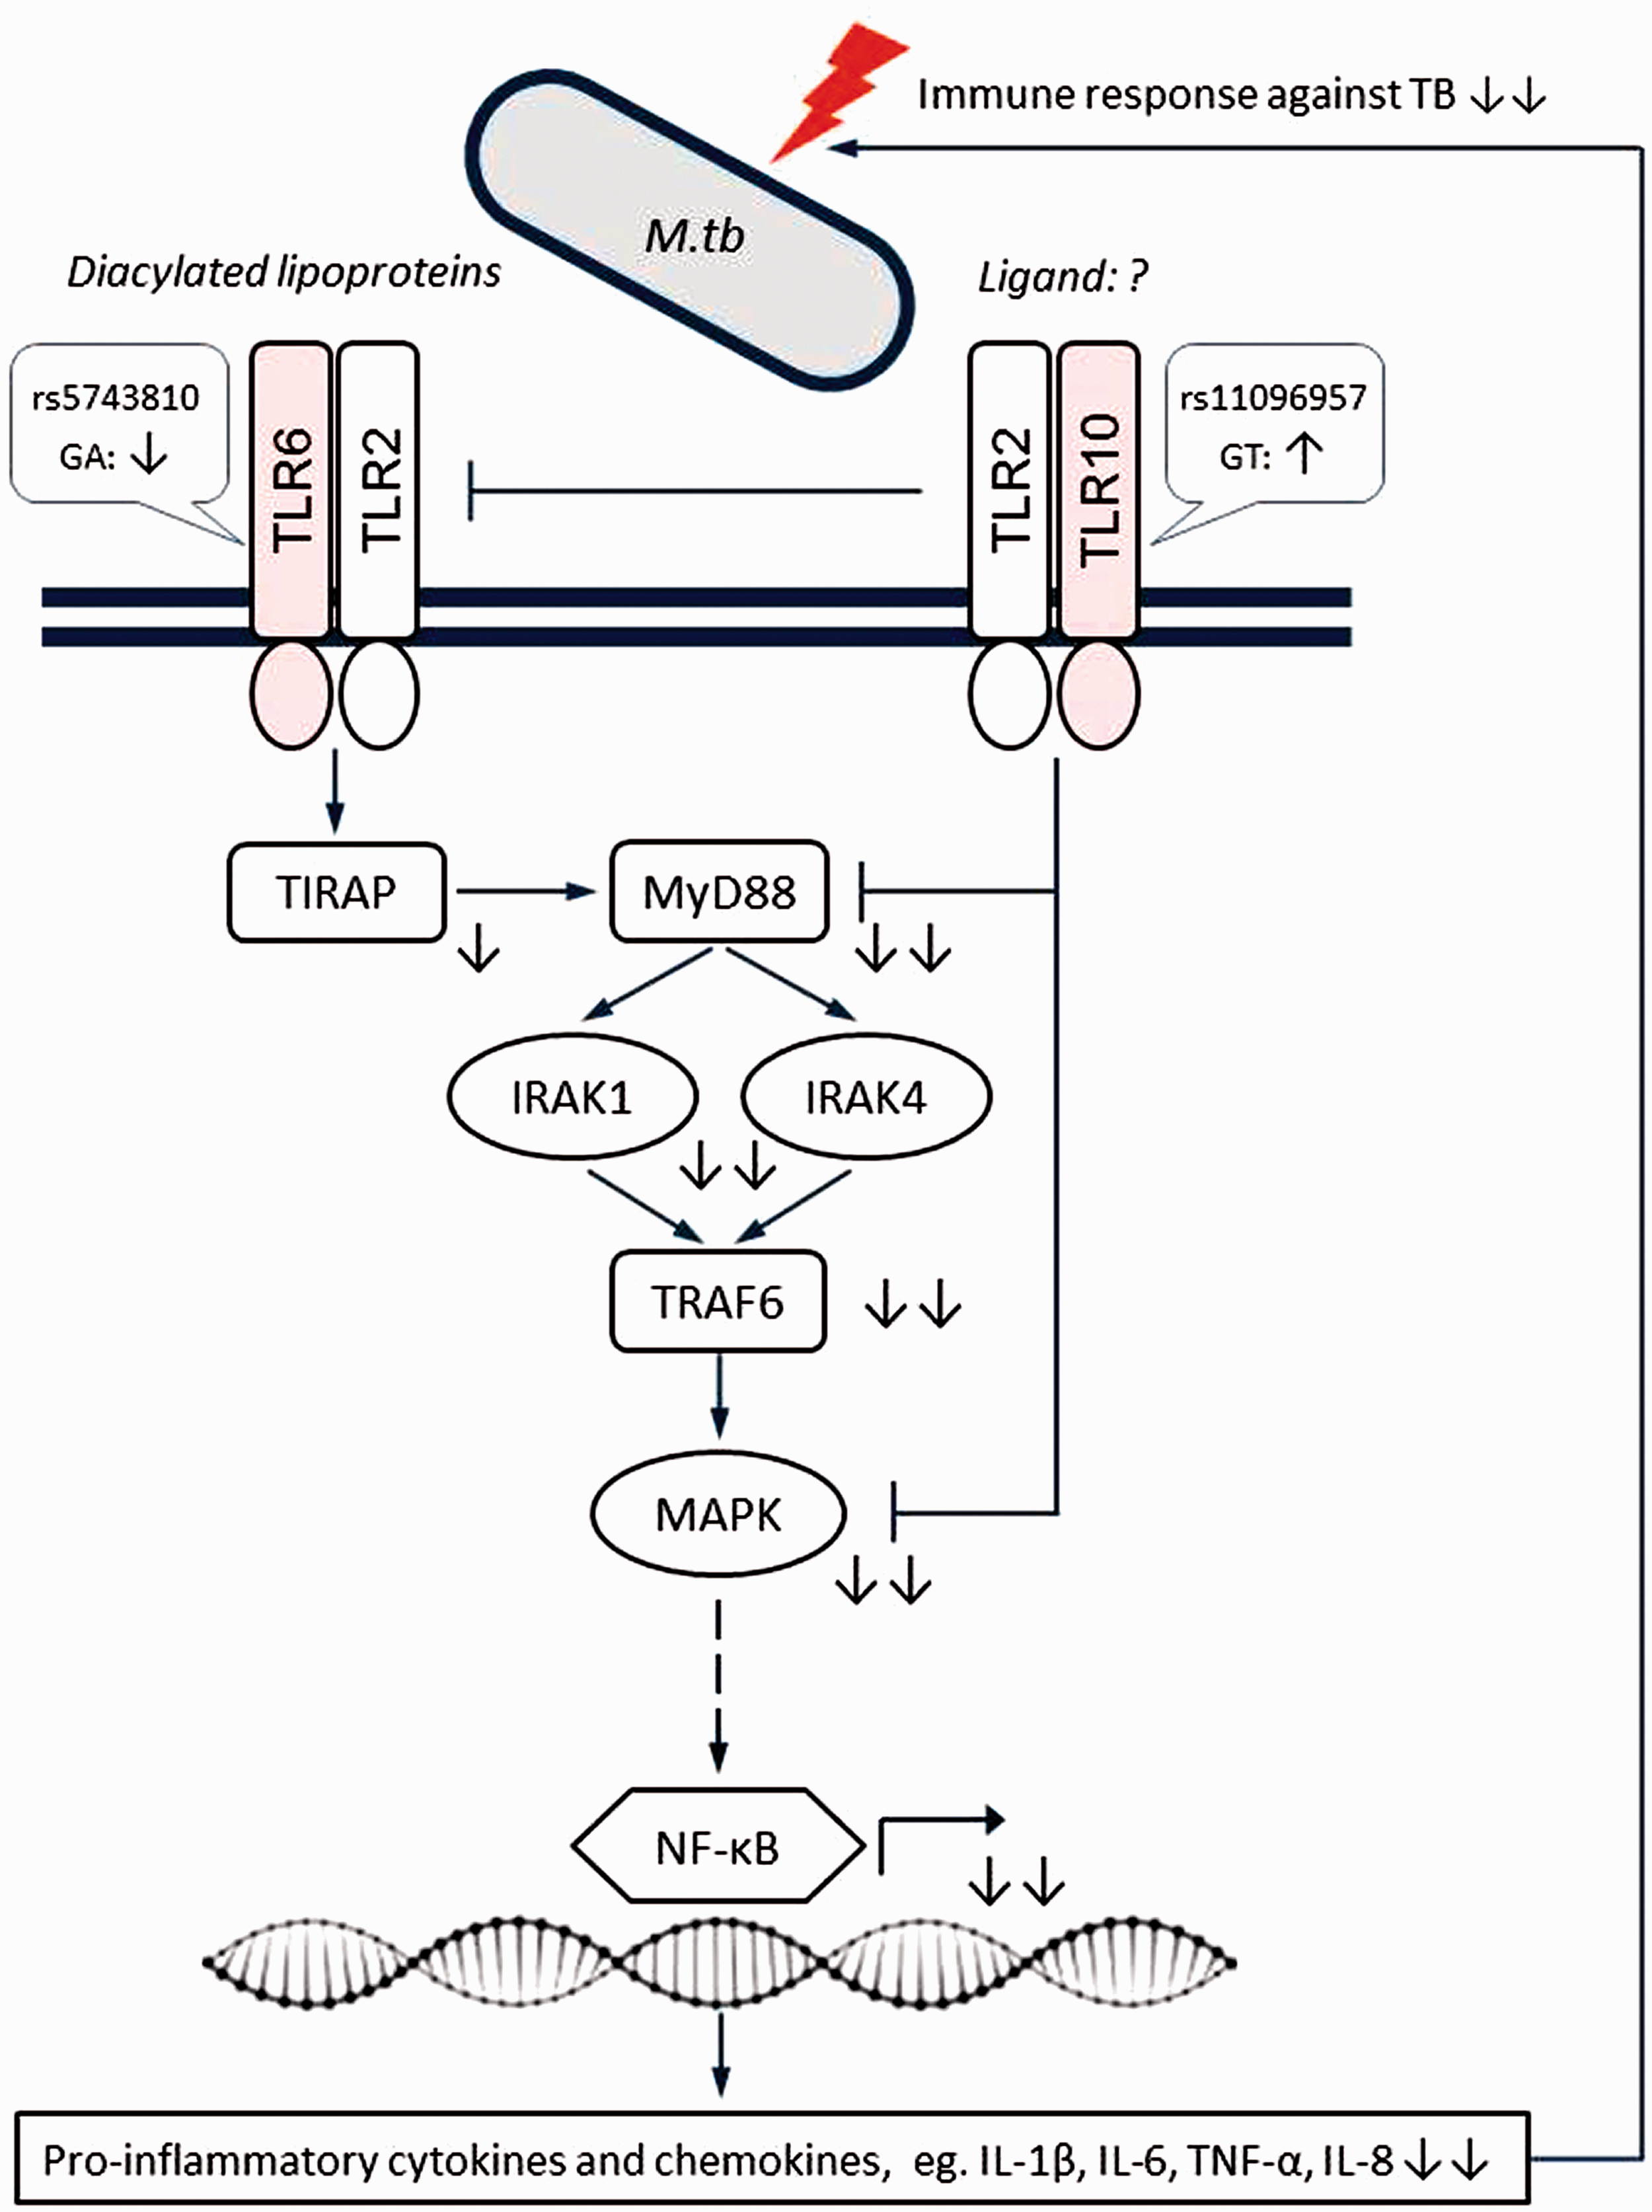
Schematic representation of the proposed epistatic/synergistic interaction between SNPs TLR6 rs5743810 and TLR10 rs11096957 in conferring susceptibility to TB based on the present results.TLR6 and TLR10 have largely opposite effects on the immune response, with TLR10 mainly having a suppressive function. Simultaneous suppression of TLR6 signaling and activation of TLR10 signaling caused by genetic variations may result in decreased pro-inflammatory responses against M. tuberculosis, thus increasing the risk of TB. Symbols indicate the following: sharp arrow – positive interaction; blunt arrow – negative interaction; solid line – direct interaction; dashed line – indirect interaction; question mark – unknown ligand partner; up/down arrows – activation/suppression; double arrows – synergistic effects of two mutations. Figure adapted from Oosting et al. (2014).10
The present study is the first to identify an interaction between TLR6 rs5743810 and TLR10 rs11096957 gene variants in TB risk. Further larger case-control studies followed by functional tests are warranted to validate this initial finding and eventually translate it into clinical practice. Particularly, given the high spread of the combined TLR6 rs5743810 GA–TLR10 rs11096957 GT genotype in the European population (∼15–20%), it might be used as a novel predictive biomarker for identification of individuals at high risk for active TB disease.
Some limitations of our study should be considered. First, it was limited in power to detect weak association signals, so our negative results should be treated with caution. Second, healthy controls were not tested for latent M. tuberculosis infection, and therefore, it was not possible to discriminate between TB-infected and TB-uninfected individuals. However, as mentioned in the “Materials and methods,” the controls were recruited from TB communities where they were permanently exposed to TB and were therefore expected to be infected. Third, the number of polymorphisms in the immune system genes analyzed was limited. Given their key role in TB pathogenesis, additional TB risk variants, haplotypes, and allele combinations may exist.
A potential limitation of this study is the significant deviation from the HWE of the interacting SNP TLR10 rs11096957 (Asn241His) in the controls. Such deviations can result from genotyping errors, recruiting biases, natural selection, or simply chance. We excluded genotyping errors by random re-genotyping of TLR10 rs11096957 in 21% of the samples. In addition, our study design prevented the recruitment of relatives. Natural selection could be the reason for the observed deviation, which may be supported by the evidence of similar heterozygosity deficiency in Toscani in Italy, TSI (HWE P value = 0.02; 1000 Genomes Project data), and considerable intra-population variation of SNP TLR10 rs11096957 within Europe (G allele frequency range: 32.4% in British, GBR to 48.6% in Iberian population, IBS; 1000 Genomes Project data). Moreover, the recruitment of healthy controls from TB communities used in this project may have a similar impact on TLR10 to natural selection, contributing to the deficiency of rs11096957 heterozygotes. Taken together, these arguments justify the inclusion of TLR10 rs11096957 in association tests.
Conclusion
In the current study, we again found a significant association between rs1800629 in the TNF gene and pulmonary TB. In addition, haplotypes in the gene cluster TLR1-TLR6-TLR10 showed a weakly yet suggestive association. Furthermore, we provide convincing statistical evidence for a synergistic effect between polymorphic variants in the TLR6 and TLR10 genes on TB risk, which further supports the importance of TLR signaling in the genetic basis of TB and the concept of genetic interactions accounting for missing heritability. Further studies are warranted to validate the interaction between TLR6 and TLR10 and to elucidate its role in TB risk, which would be beneficial for human health.
Supplemental Material
sj-pdf-1-ini-10.1177_17534259211029996 - Supplemental material for Synergistic effect of genetic polymorphisms in TLR6 and TLR10 genes on the risk of pulmonary tuberculosis in a Moldavian population
Supplemental material, sj-pdf-1-ini-10.1177_17534259211029996 for Synergistic effect of genetic polymorphisms in TLR6 and TLR10 genes on the risk of pulmonary tuberculosis in a Moldavian population by Alexander Varzari, Igor V. Deyneko, Elena Tudor, Harald Grallert and Thomas Illig in Innate Immunity
Supplemental Material
sj-pdf-2-ini-10.1177_17534259211029996 - Supplemental material for Synergistic effect of genetic polymorphisms in TLR6 and TLR10 genes on the risk of pulmonary tuberculosis in a Moldavian population
Supplemental material, sj-pdf-2-ini-10.1177_17534259211029996 for Synergistic effect of genetic polymorphisms in TLR6 and TLR10 genes on the risk of pulmonary tuberculosis in a Moldavian population by Alexander Varzari, Igor V. Deyneko, Elena Tudor, Harald Grallert and Thomas Illig in Innate Immunity
Supplemental Material
sj-xlsx-3-ini-10.1177_17534259211029996 - Supplemental material for Synergistic effect of genetic polymorphisms in TLR6 and TLR10 genes on the risk of pulmonary tuberculosis in a Moldavian population
Supplemental material, sj-xlsx-3-ini-10.1177_17534259211029996 for Synergistic effect of genetic polymorphisms in TLR6 and TLR10 genes on the risk of pulmonary tuberculosis in a Moldavian population by Alexander Varzari, Igor V. Deyneko, Elena Tudor, Harald Grallert and Thomas Illig in Innate Immunity
Supplemental Material
sj-xlsx-4-ini-10.1177_17534259211029996 - Supplemental material for Synergistic effect of genetic polymorphisms in TLR6 and TLR10 genes on the risk of pulmonary tuberculosis in a Moldavian population
Supplemental material, sj-xlsx-4-ini-10.1177_17534259211029996 for Synergistic effect of genetic polymorphisms in TLR6 and TLR10 genes on the risk of pulmonary tuberculosis in a Moldavian population by Alexander Varzari, Igor V. Deyneko, Elena Tudor, Harald Grallert and Thomas Illig in Innate Immunity
Footnotes
Acknowledgements
Declaration of conflicting interests
The authors declare no potential conflicts of interest with respect to the research, authorship, and/or publication of this article.
Ethics approval and consent to participate
The study was approved by the Research Ethic Committee of the Institute of Phthisiopneumology (Republic of Moldova) and was conducted in accordance with the Declaration of Helsinki. All participants gave their written informed consent.
Funding
The authors disclosed receipt of the following financial support for the research, authorship, and/or publication of this article: The study was supported by the Academy of Sciences of Moldova and Hannover Unified Biobank. Alexander Varzari was sponsored by the Alexander von Humboldt Foundation.
Supplemental material
Supplemental material for this article is available online.
References
Supplementary Material
Please find the following supplemental material available below.
For Open Access articles published under a Creative Commons License, all supplemental material carries the same license as the article it is associated with.
For non-Open Access articles published, all supplemental material carries a non-exclusive license, and permission requests for re-use of supplemental material or any part of supplemental material shall be sent directly to the copyright owner as specified in the copyright notice associated with the article.