
Abstract
As the molecular mechanisms of Brucella ovis pathogenicity are not completely clear, we have applied a transcriptome approach to identify the differentially expressed genes (DEGs) in RAW264.7 macrophage infected with B. ovis. The DEGs related to immune pathway were identified by Kyoto Encyclopedia of Genes and Genomes (KEGG) and Gene Ontology (GO) functional enrichment analysis. Quantitative real-time PCR (qRT-PCR) was performed to validate the transcriptome sequencing data. In total, we identified 337 up-regulated and 264 down-regulated DEGs in B. ovis-infected group versus mock group. Top 20 pathways were enriched by KEGG analysis and 20 GO by functional enrichment analysis in DEGs involved in the molecular function, cellular component, and biological process and so on, which revealed multiple immunological pathways in RAW264.7 macrophage cells in response to B. ovis infection, including inflammatory response, immune system process, immune response, cytokine activity, chemotaxis, chemokine-mediated signaling pathway, chemokine activity, and CCR chemokine receptor binding. qRT-PCR results showed Ccl2 (ENSMUST00000000193), Ccl2 (ENSMUST00000124479), Ccl3 (ENSMUST00000001008), Hmox1 (ENSMUST00000005548), Hmox1 (ENSMUST00000159631), Cxcl2 (ENSMUST00000075433), Cxcl2 (ENSMUST00000200681), Cxcl2 (ENSMUST00000200919), and Cxcl2 (ENSMUST00000202317). Our findings firstly elucidate the pathways involved in B. ovis-induced host immune response, which may lay the foundation for revealing the bacteria–host interaction and demonstrating the pathogenic mechanism of B. ovis.
Introduction
Brucella is a Gram-negative non-motile and intracellular parasitic bacterium without capsule (smooth type with microcapsule) which can survive in many kinds of domestic animals. Brucellosis is caused by Brucella, and is a chronic infectious disease that affects animal husbandry and public health.1–4 The Brucellosis Expert Committee of the World Health Organization divides Brucella into six species and 19 types, namely, Brucella melitensis (three types), Brucella abortus (eight types), Brucella suis (five types), Brucella ovis (one type), Brucella neotomae (one type), and Brucella canis (one type). Recently, Brucella has been isolated from seals, whales, and otters, and it is suggested that these isolates make up two new varieties, i.e. Brucella cetaceae and Brucella pinnipedia.5–7 The clinical manifestations of brucellosis are very complex, and can be divided into acute stage, chronic active stage, and chronic relatively stable stage. The incubation period is 7–60 d, with an average of 2 wk, and some instances can reach several months to more than 1 yr.8–10
B. ovis needs 5% to 10% CO2 for primary isolation and culture, and has high requirements for nutrition. It grows well in the solid culture of defibrinated amniotic blood and grows poorly in an ordinary medium.11–13 The genome of B. ovis is about 3.29 Mb, including two chromosomes and 3200 open reading frames. The main routes of transmission of B. ovis are digestive tract, skin, mucous membrane, and reproductive tract. B. ovis can not only cause infection through damaged skin and mucous membrane, but also through normal non-damaged skin and mucous membrane. Female sheep are more likely to be infected by B. ovis than male sheep. Young sheep have a certain resistance to the disease. With increase of age of the sheep, the susceptibility also increases. Sexually mature sheep are very susceptible to the disease. Female sheep in their first pregnancy are easily infected; most have only one abortion, and fewer have two abortions. In historical epidemic areas there are fewer miscarriages, but there are more cases of hysteritis, mastitis, arthritis, placenta failure, and long pregnancy infertility. In new epidemic areas, the outbreak is the main disease, miscarriages may occur in every pregnancy, and male sheep are more likely to be infected by B. ovis than female sheep.14–16
After B. ovis has invaded the animal’s body, it quickly reaches lymph nodes near the tissue of invasion, and is found and phagocytized by macrophages. The bacteria phagocytized by macrophages grow and propagate in macrophages to form the primary focus but do not show any clinical characteristics. Brucella has a weak LPS that does not trigger sepsis.17–19 When pregnant animals are infected, bacteria proliferate in the epithelial cells of the chorion causing necrosis and production of a cellulosic purulent secretion, resulting in separation of the placenta, thus a lack of fetal nutrients and finally abortion. 20
In this study, RAW264.7 macrophage cells were infected with B. ovis or physiological saline, and the samples were named B_ovis infected and mock_infected. RNA-seq was used to identify the differentially expressed genes (DEGs) comparing B_ovis infected with mock_infected. A total of 601 DEGs were identified. Top 20 pathways were enriched by Kyoto Encyclopedia of Genes and Genomes (KEGG) analysis. Gene Ontology (GO) functional enrichment analysis showed DEGs of the top 20 GO terms involved in the molecular function, cellular component, and biological process, and revealed eight immunological pathways of RAW264.7 macrophage cells in response to B. ovis infection. We selected 10 DEGs with high expression and up-regulation for qRT-PCR validation; the results showed that nine DEGs were consistent with the transcriptome sequencing data, which demonstrated that the results of transcriptome sequencing were reliable. Our findings may lay a foundation for elucidating the bacteria–host interaction and the molecular mechanism of B. ovis infection.
Materials and methods
Cells, B. ovis culture, and infection
RAW264.7 macrophage cells were stored in our lab, and cultured with DMEM medium (Life Technology, USA) supplemented with 10% heat-inactivated FBS, 100 IU/ml penicillin and 100 µg/ml streptomycin. B. ovis strain 25840 was purchased from ATCC, and coated on the defibrillated blood plate (Hopebio, China) to culture for 48 h in a 37°C, 5% CO2 incubator. The bacteria were washed down with PBS and infected RAW264.7 macrophage using MOI = 100:1 for 24 h, while the saline group was set as the control group (n = 3). After adding Trizol to lyse the cells, the samples were collected to isolate total RNAs.
High-quality total RNA extraction, quality control, and transcriptome sequencing
The qualities and concentrations of total RNAs were analysis by using Bioanalyzer 2100 and RNA 1000 Nano LabChip Kit (Agilent, USA) with RIN number > 7.0. Poly(A) RNA was purified doubly using poly-T oligo-attached magnetic. Purified mRNA was fragmented into small pieces using divalent cations under elevated temperature. Then the cleaved RNA fragments were reverse-transcribed to create the cDNA library (Illumina, San Diego, USA); the average insert size for the paired-endlibraries was 300 bp (± 50 bp). The quality of the transcriptome sequencing was assessed by investigating the regional distribution of reference genome alignment and density distribution of reference sequence. Quality control (QC) was performed as Q20, Q30, GC content distribution map, RNA expression level, saturation curve, splicing junctions, biological repeat correlation verification, and visualization of reads comparison results, and then analysis of the QC data by using bioinformatics. In this study, principal component analysis (PCA) and Pearson correlation were used to evaluate the repeatability between samples. We then performed the paired-end sequencing on an Illumina HiSeq 4000 at the (LC Sciences, USA) following the vendor’s recommended protocol.
Sequencing data processing
In the process of high-throughput sequencing data analysis, we mainly focused on the construction of transcripts and the measurement of their expression level, followed by the analysis of post-transcriptional modification of variable splicing. HISAT 2.0 software 21 was used to compare the sequencing data compared with the reference genome, and the alignment results were used to assemble the transcripts. Using network flow algorithm and optional de novo assembly, complex datasets were assembled into transcripts. Utilizing the assemblers Cufflinks and StringTie achieves more accurate gene reconstruction and better prediction of expression level based on real datasets. Then, edgeR22–24 was used to analyze the difference expression, and R language was used to display the result graphically.
Raw data of the sequencer was preprocessed to format as fastq files. The data file contained some short sequences (about 150 bp) that could not be directly used for mRNA analysis. To ensure accurate and reliable results, it was necessary to preprocess the original data, including removing sequencing joints (introduced in the process of database building) and low-quality sequencing data (due to the error of the sequencer itself). The valid data obtained was paired with the reference genome of mice, and the gene location information in the genome annotation documents (gtf and gff) was counted, respectively. Cutadapt25–27 was used to filter out unqualified sequences and obtain clean data. Then, the next analysis was carried out. The specific processing steps are as follows: Removing the reads with adaptor, the reads containing n (n means that the base information cannot be determined), and the low-quality reads (the base number of alkali with mass value Q ≤ 10 accounts for more than 20% of the whole read). The original sequencing quantity, effective sequencing quantity, Q20, Q30, and GC content were counted and evaluated comprehensively. After comparison of reference genome and statistical analysis of known annotation information of species, the DEGs later were analyzed.
Analysis of transcriptome data
EdgeR was used to analyze the difference of StringTie-assembled and quantified genes (the threshold of significant difference was | log2 fold change | ≥ 1, P < 0.05) and we defined the difference threshold according to the initial operation results, such as: Changing of the fold change threshold and Changing of the threshold (P value). The DEGs satisfying the threshold of significance difference are displayed in the result report.
GO and KEGG enrichment analysis
GO enrichment analysis of differentially expressed transcripts was implemented with the GO seq R package, based on corrected gene length bias. Regarding analysis of GO functional significance enrichment, we mapped all significant DEGs to each term, calculated the gene number of each term, and then applied a hypergeometric test to group the GO items compared with the whole genome background. ggplot2 is used to show the enrichment analysis by using scatter diagram. KEGG is performed for the significance enrichment analysis of the pathway. The hypergeometric test is applied to find out the pathway which is significantly enriched in the genes with significant differential expression compared with the whole genome background.
Validation of DEGs by qRT-PCR
The primers were designed by NCBI primer online software, and GAPDH was used as an internal control. Total RNAs extracted from B. ovis_infected and mock_infected samples were used for reverse transcription by PrimeScriptTM RT reagent kit (TaKaRa, Japan), and qRT-PCR was performed by TB Green® Premix Ex Taq™ II (Tli RNaseH Plus) (TaKaRa, Japan). The relative expression level of each of the differentially expressed transcripts was calculated using the 2−ΔΔCt method. The data analyzed were from three different experiments. Student’s t-test was used for statistical analysis; “*” represents P < 0.05, and “**” represents P < 0.01.
Results
Overview of sequencing experiment workflow and quality control
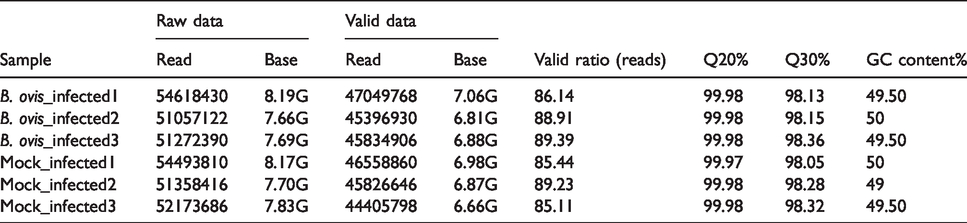
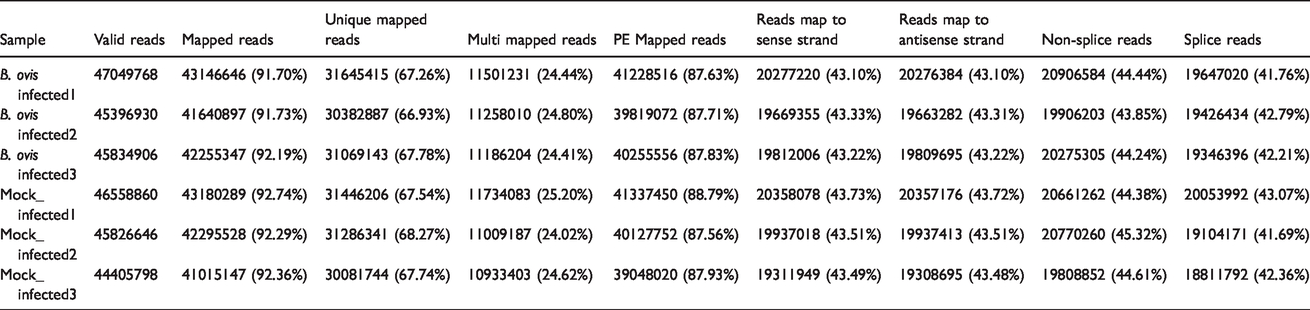
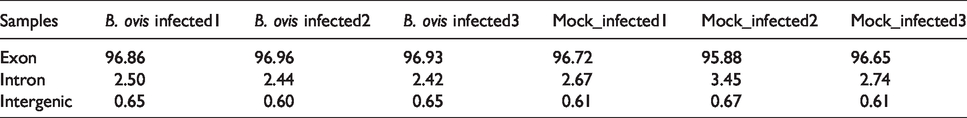
First the total RNAs passed the quality inspection. Then, the mRNAs were enriched by magnetic beads connected with oligo (DT) and randomly broken into short fragments by fragmentation buffer. The first strand of cDNA was synthesized by using six base random primers (random hexamers), and then the second strand was synthesized by adding buffer, dNTPs, RNaseH, and DNA polymer I. AMPure XP beads were used to purify the double-stranded product, and the sticky end of DNA was ligated to a flat end by T4 DNA polymerase and Klenow DNA polymerase. The 3' end was added with spliced A. AMPure XP beads were selected for pooling fragment cDNAs, and the final cDNA library for sequencing was amplified by PCR (Figure 1a). Through PCA we can detect the distribution of the cDNAs, verify the rationality of the experimental design, and reflect the homogeneity of biological duplicate samples. The two-dimensional distribution showed that the biological repetitions were good (Figure 1b). The Pearson correlation demonstrated the rationality and the reproduction of the experimental design (Figure 1c). In B. ovis-infected sample 1, there were 96.86% exon, 2.5% intergenic, and 0.65% intron, 96.96% exon, 2.44% intergenic, and 0.66% intron in B. ovis_infected sample 2, and 96.93% exon, 2.42% intergenic, and 0.65% intron in B. ovis_infected sample 3. In control samples, there were 96.72% exon, 2.67% intergenic, and 0.61% intron in control 1, 95.88% exon, 3.45% intergenic, and 0.67% intron in control 2, and 96.65% exon, 2.74% intergenic, and 0.61% intron in control 3 (Figure 1d).
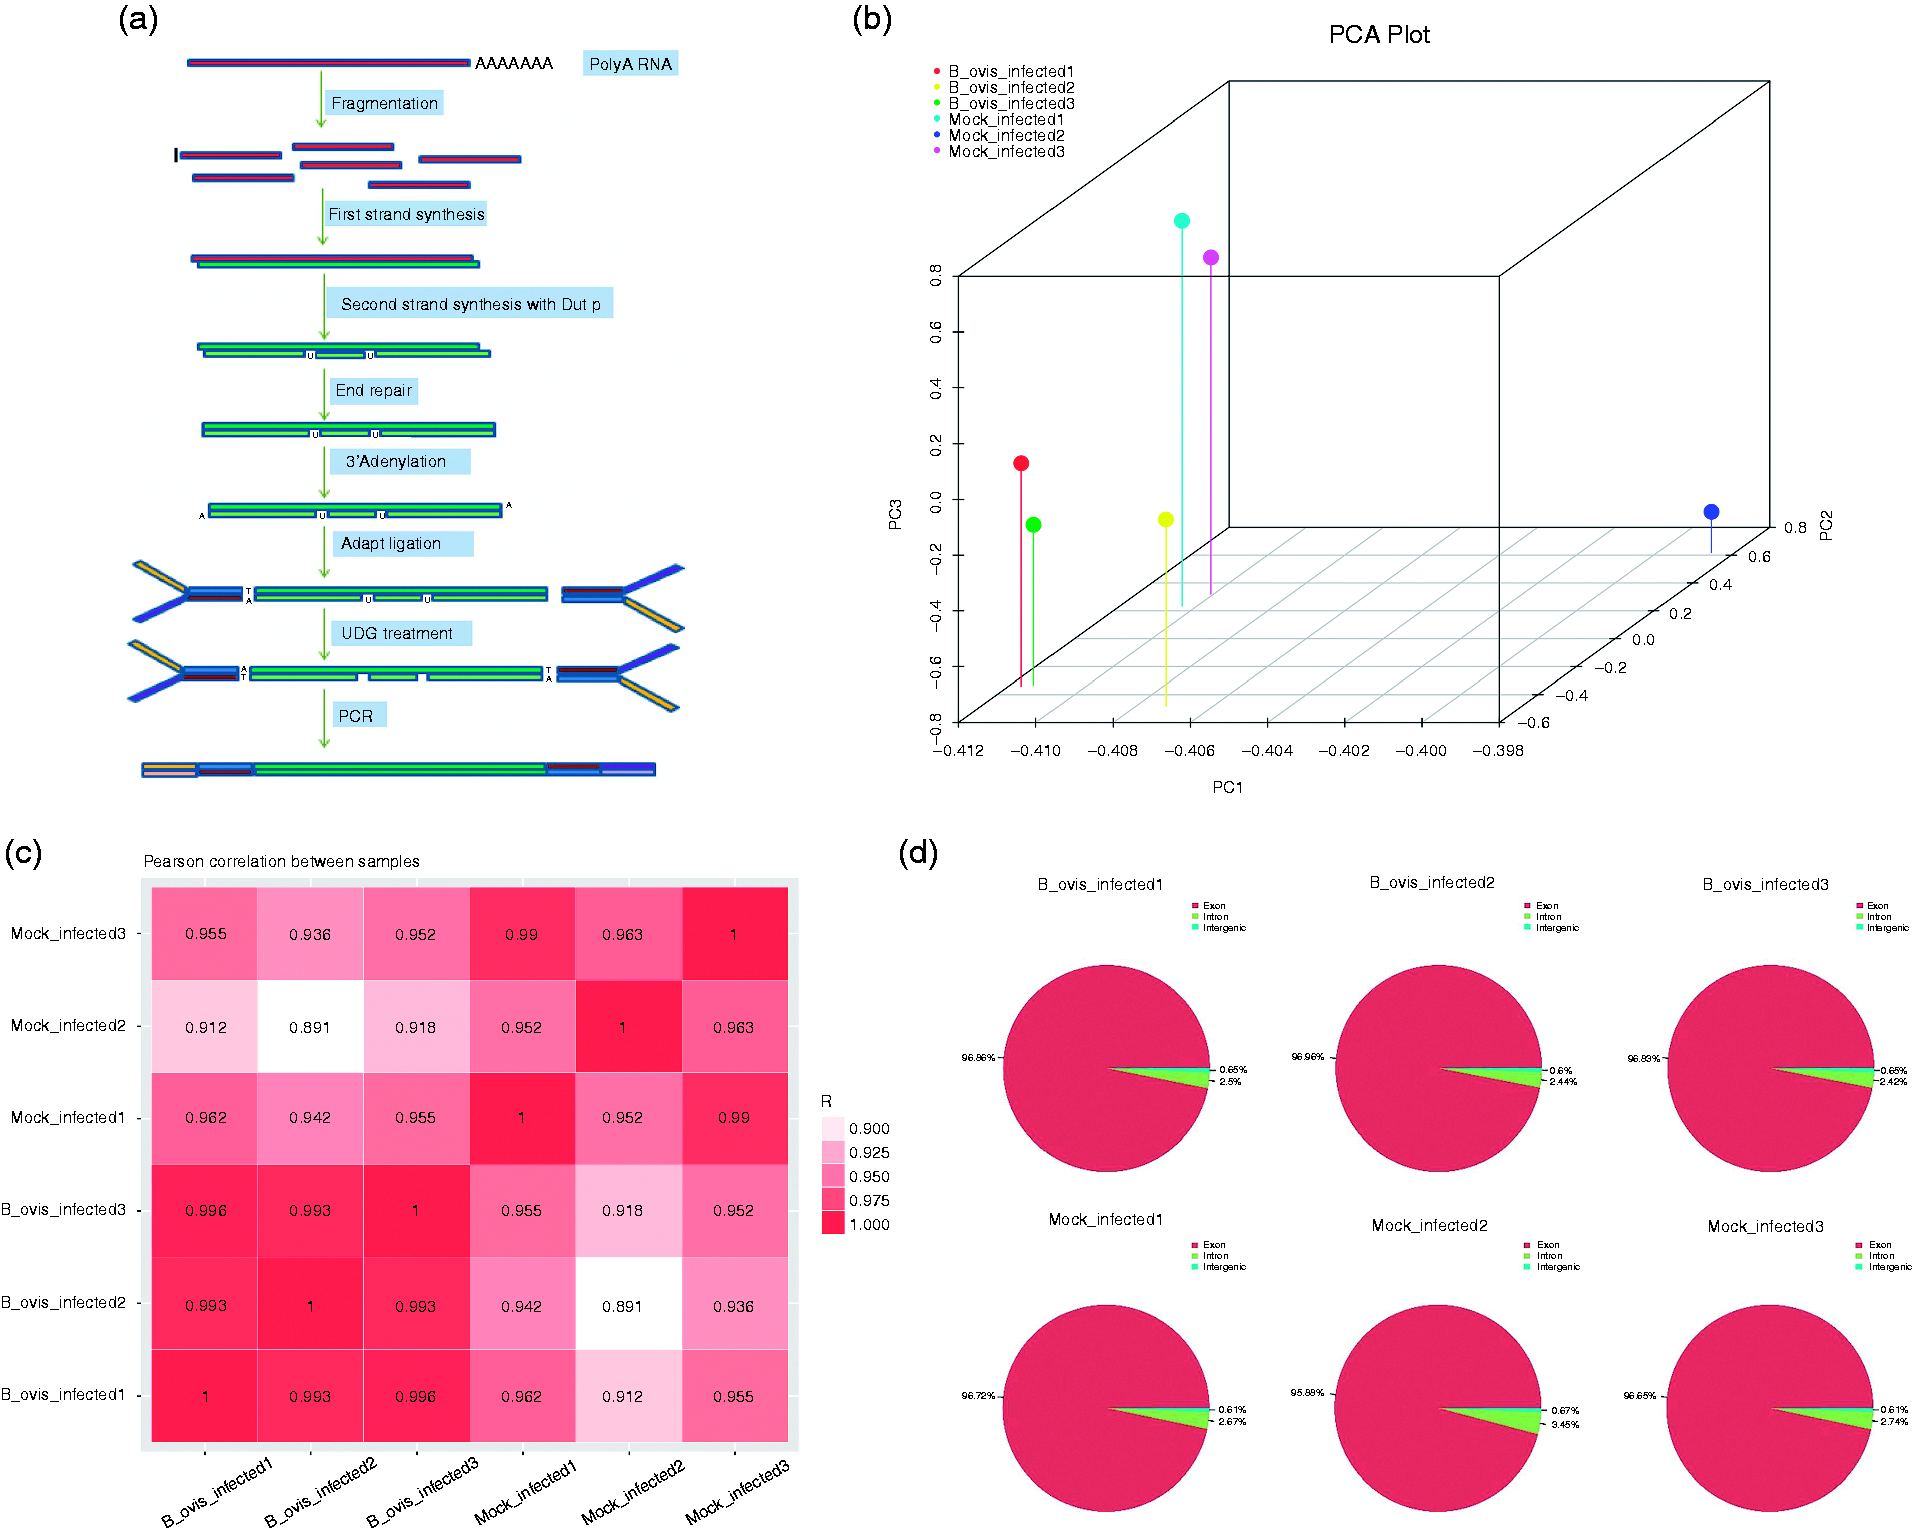
Workflow for RNA sequencing as well as quality control. (a) Flowchart of sequencing experiment. (b) Analysis of PCA plot. (c) Pearson correlation of experimental samples within B. ovis_infected and mock infected (n = 3). (d) Regional distribution of reference genome alignment, according to the region information of the reference genome, it can be defined as alignment to exon, intron, and intergenic of six samples.
Reads and mapping results of transcriptome sequencing
The statistical summary of transcriptome sequencing data is shown in Table 1. We aligned the reads by using UCSC (http://genome.ucsc.edu/). The Mus musculus genome was employed as reference genome using HISAT software. HISAT (http://ccb.jhu.edu/software/hisat/index.shtml) built a database of the reads and mapping results (Table 2). The positions of reads and maps located in the Mus musculus reference genome are shown in Table 3.
Statistical summary of transcriptome sequencing data.
The basic information of reads and mapping.
The distribution of maps and reads in the reference genome.
Analysis of DEGs
FPKM (fragments per kilobase of exon model per million mapped reads) and RPKM (reads per kilobase of exon model per million mapped reads) were used to measure the expression levels of DEGs. The distribution of expression of DEGs was represented by FPKM box graph, and the expression level of genes was calculated from the overall level. The repeatability of the FPKM was determined by box diagram (Figure 2a). The expression density map of log10 (FPKM) was used to compare the expression trend of different samples. FPKM can be displayed by the Z value. 28 Figure 2b shows that the expression density map of each sample had similar distribution as the normal control and the repeatability of FPKM was consistent (Figure 2b). The overall distribution of DEGs was displayed by mapping volcano with log2 (fold change) as abscissa and –log10 (P value) as ordinate. In Figure 2c, red represents the up-regulated DEGs, blue represents the down-regulated DEGs, and gray represents the non-significant DEGs. The up-regulated and down-regulated DEGs in each group were statistically analyzed and displayed in a histogram. In detail, the red column represents the up-regulated DEGs, and the blue column represents the down-regulated DEGs (Figure 2d).
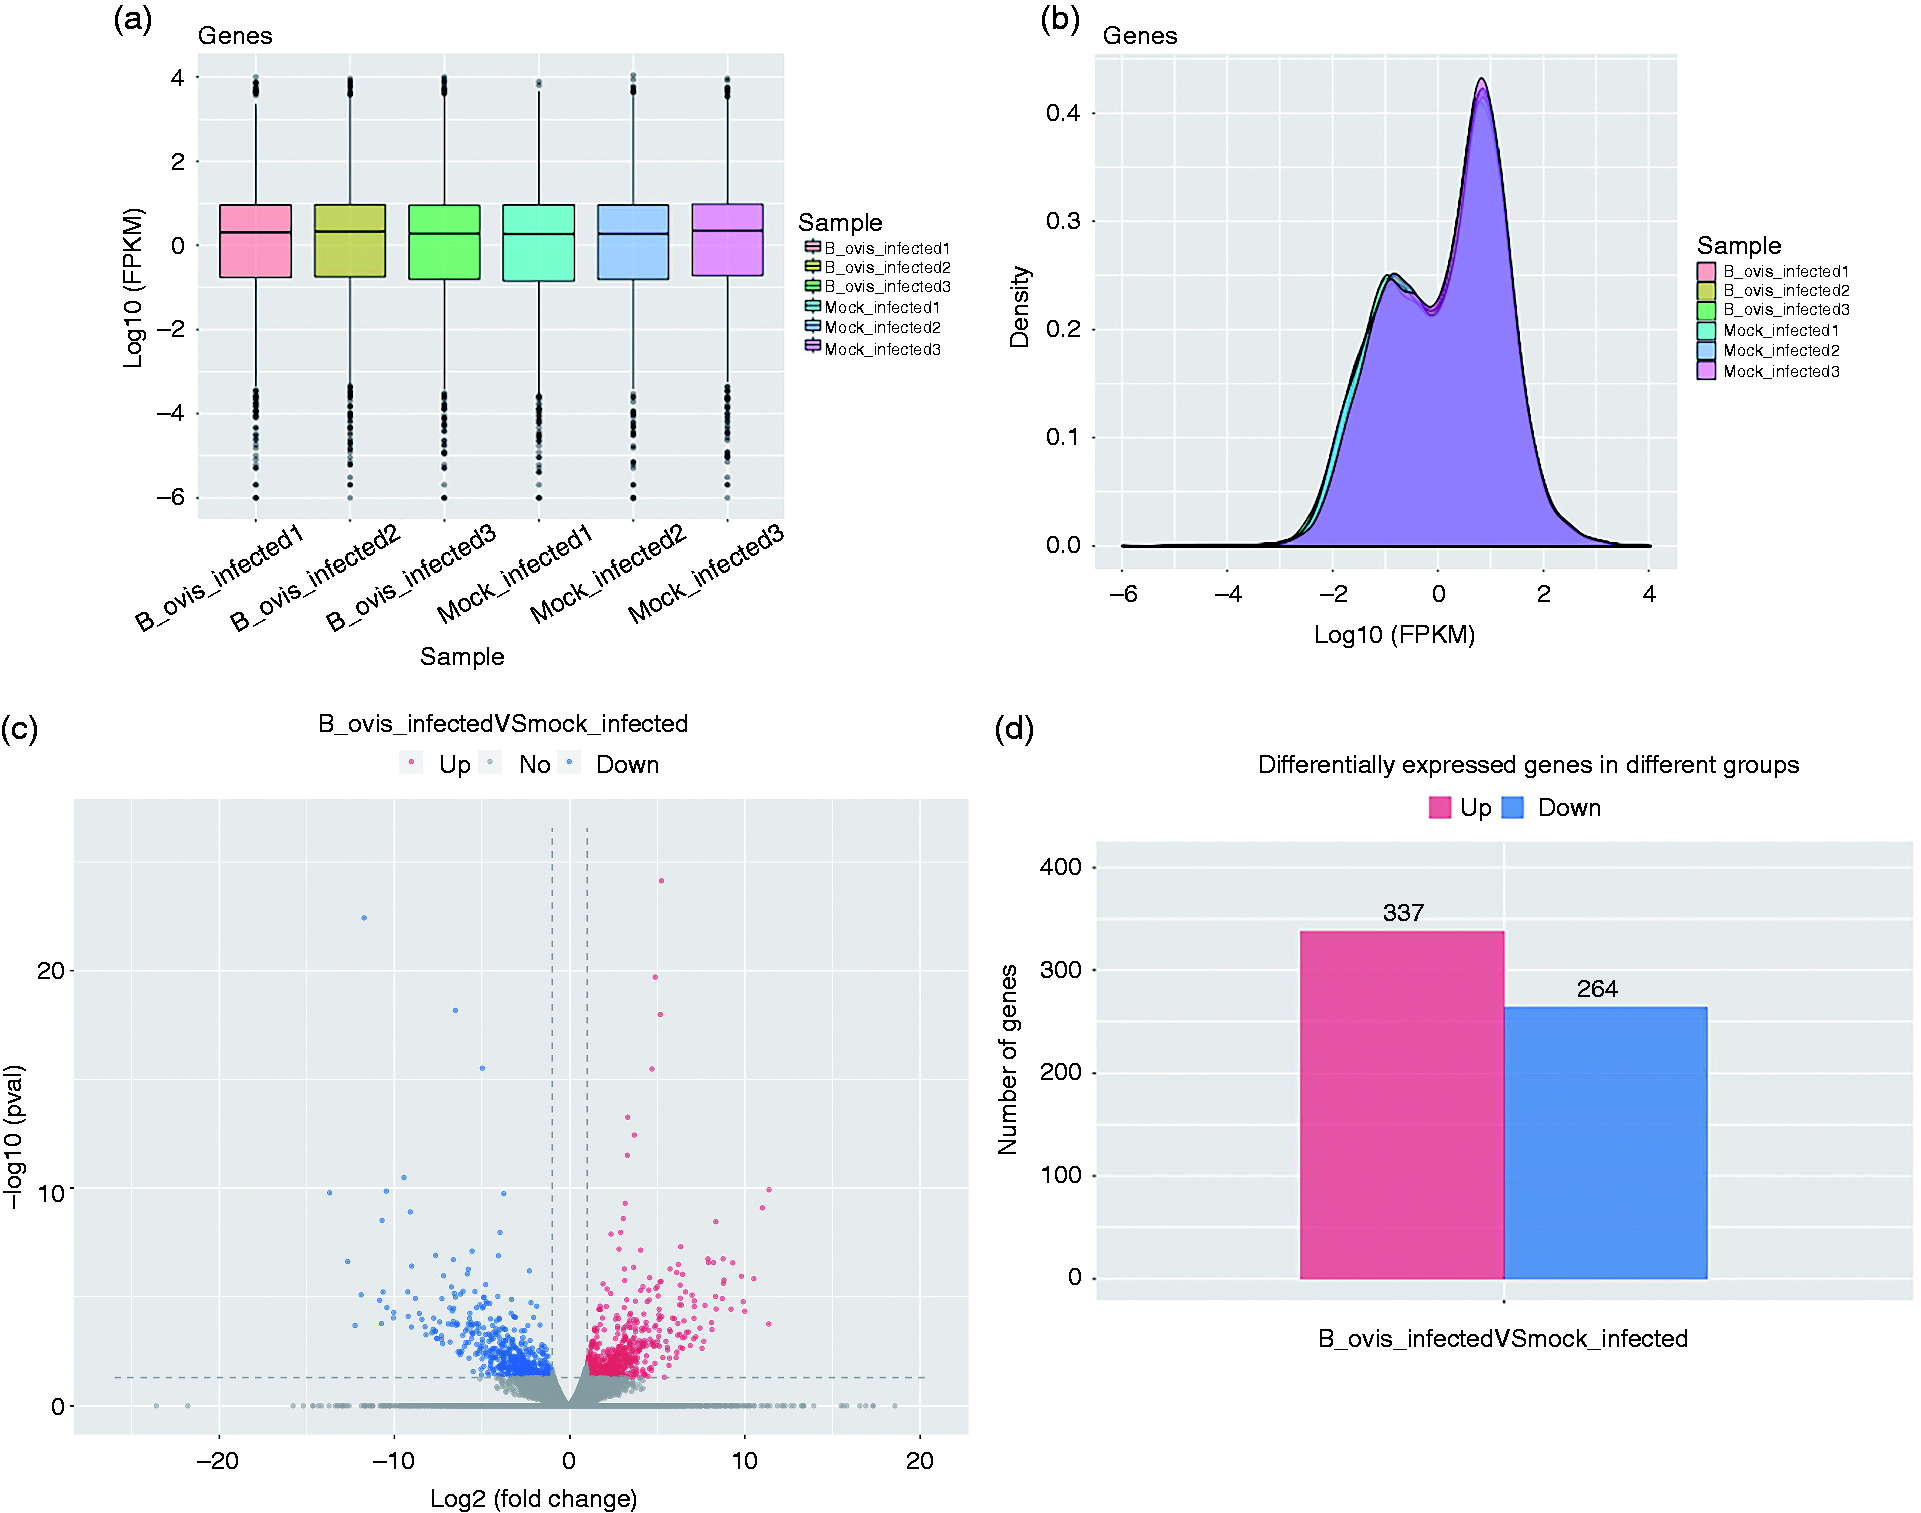
Analysis of DEGs. (a) Distribution of DEGs expression values of each sample. The X-axis was the sample name, and the Y-axis was log10 (FPKM). The box graph of each region corresponded to five statistics (the maximum, the upper quartile, the median, the lower quartile, and the minimum, respectively, from the top to the bottom). (b) DEGs expression density distribution, The X-axis was the log10 (FPKM), and the Y-axis was genes expression density. (c) Volcano plot of differential expression profiles between B. ovis_infected and mock_infected (n = 3). Red represents the up-regulated DEGs, blue represents the down-regulated DEGs, and gray represents the non-significant DEGs. (d) Statistics of up- and down-regulation frequency of DEGs with significant difference expression. Red represents up-regulated DEGs, blue represents down-regulated DEGs.
Functional analysis of KEGG and GO revealed multiple immunological pathways involved in B. ovis infection
ggplot2 29 , 30 was used to analyze the enrichment of KEGG. The results are shown by scatter plot: rich factor represents the number of differential genes located in the KEGG/the total genes located in the KEGG. The top 20 pathways of the significance enrichment analysis are shown in a KEGG enrichment scatter plot (Figure 3a). The histogram of GO functional analysis reflects the number distribution of DEGs on GO according to biological process, cellular component, and molecular function (Figure 3b). ggplot2 was also used to show the results of GO analysis with a scatter diagram; the rich factor represents the number of DEGs in the GO. The larger the rich factor, the higher the degree of GO enrichment. DEGs involved in the top 20 GO terms are shown by GO scatter diagram (Figure 3c).
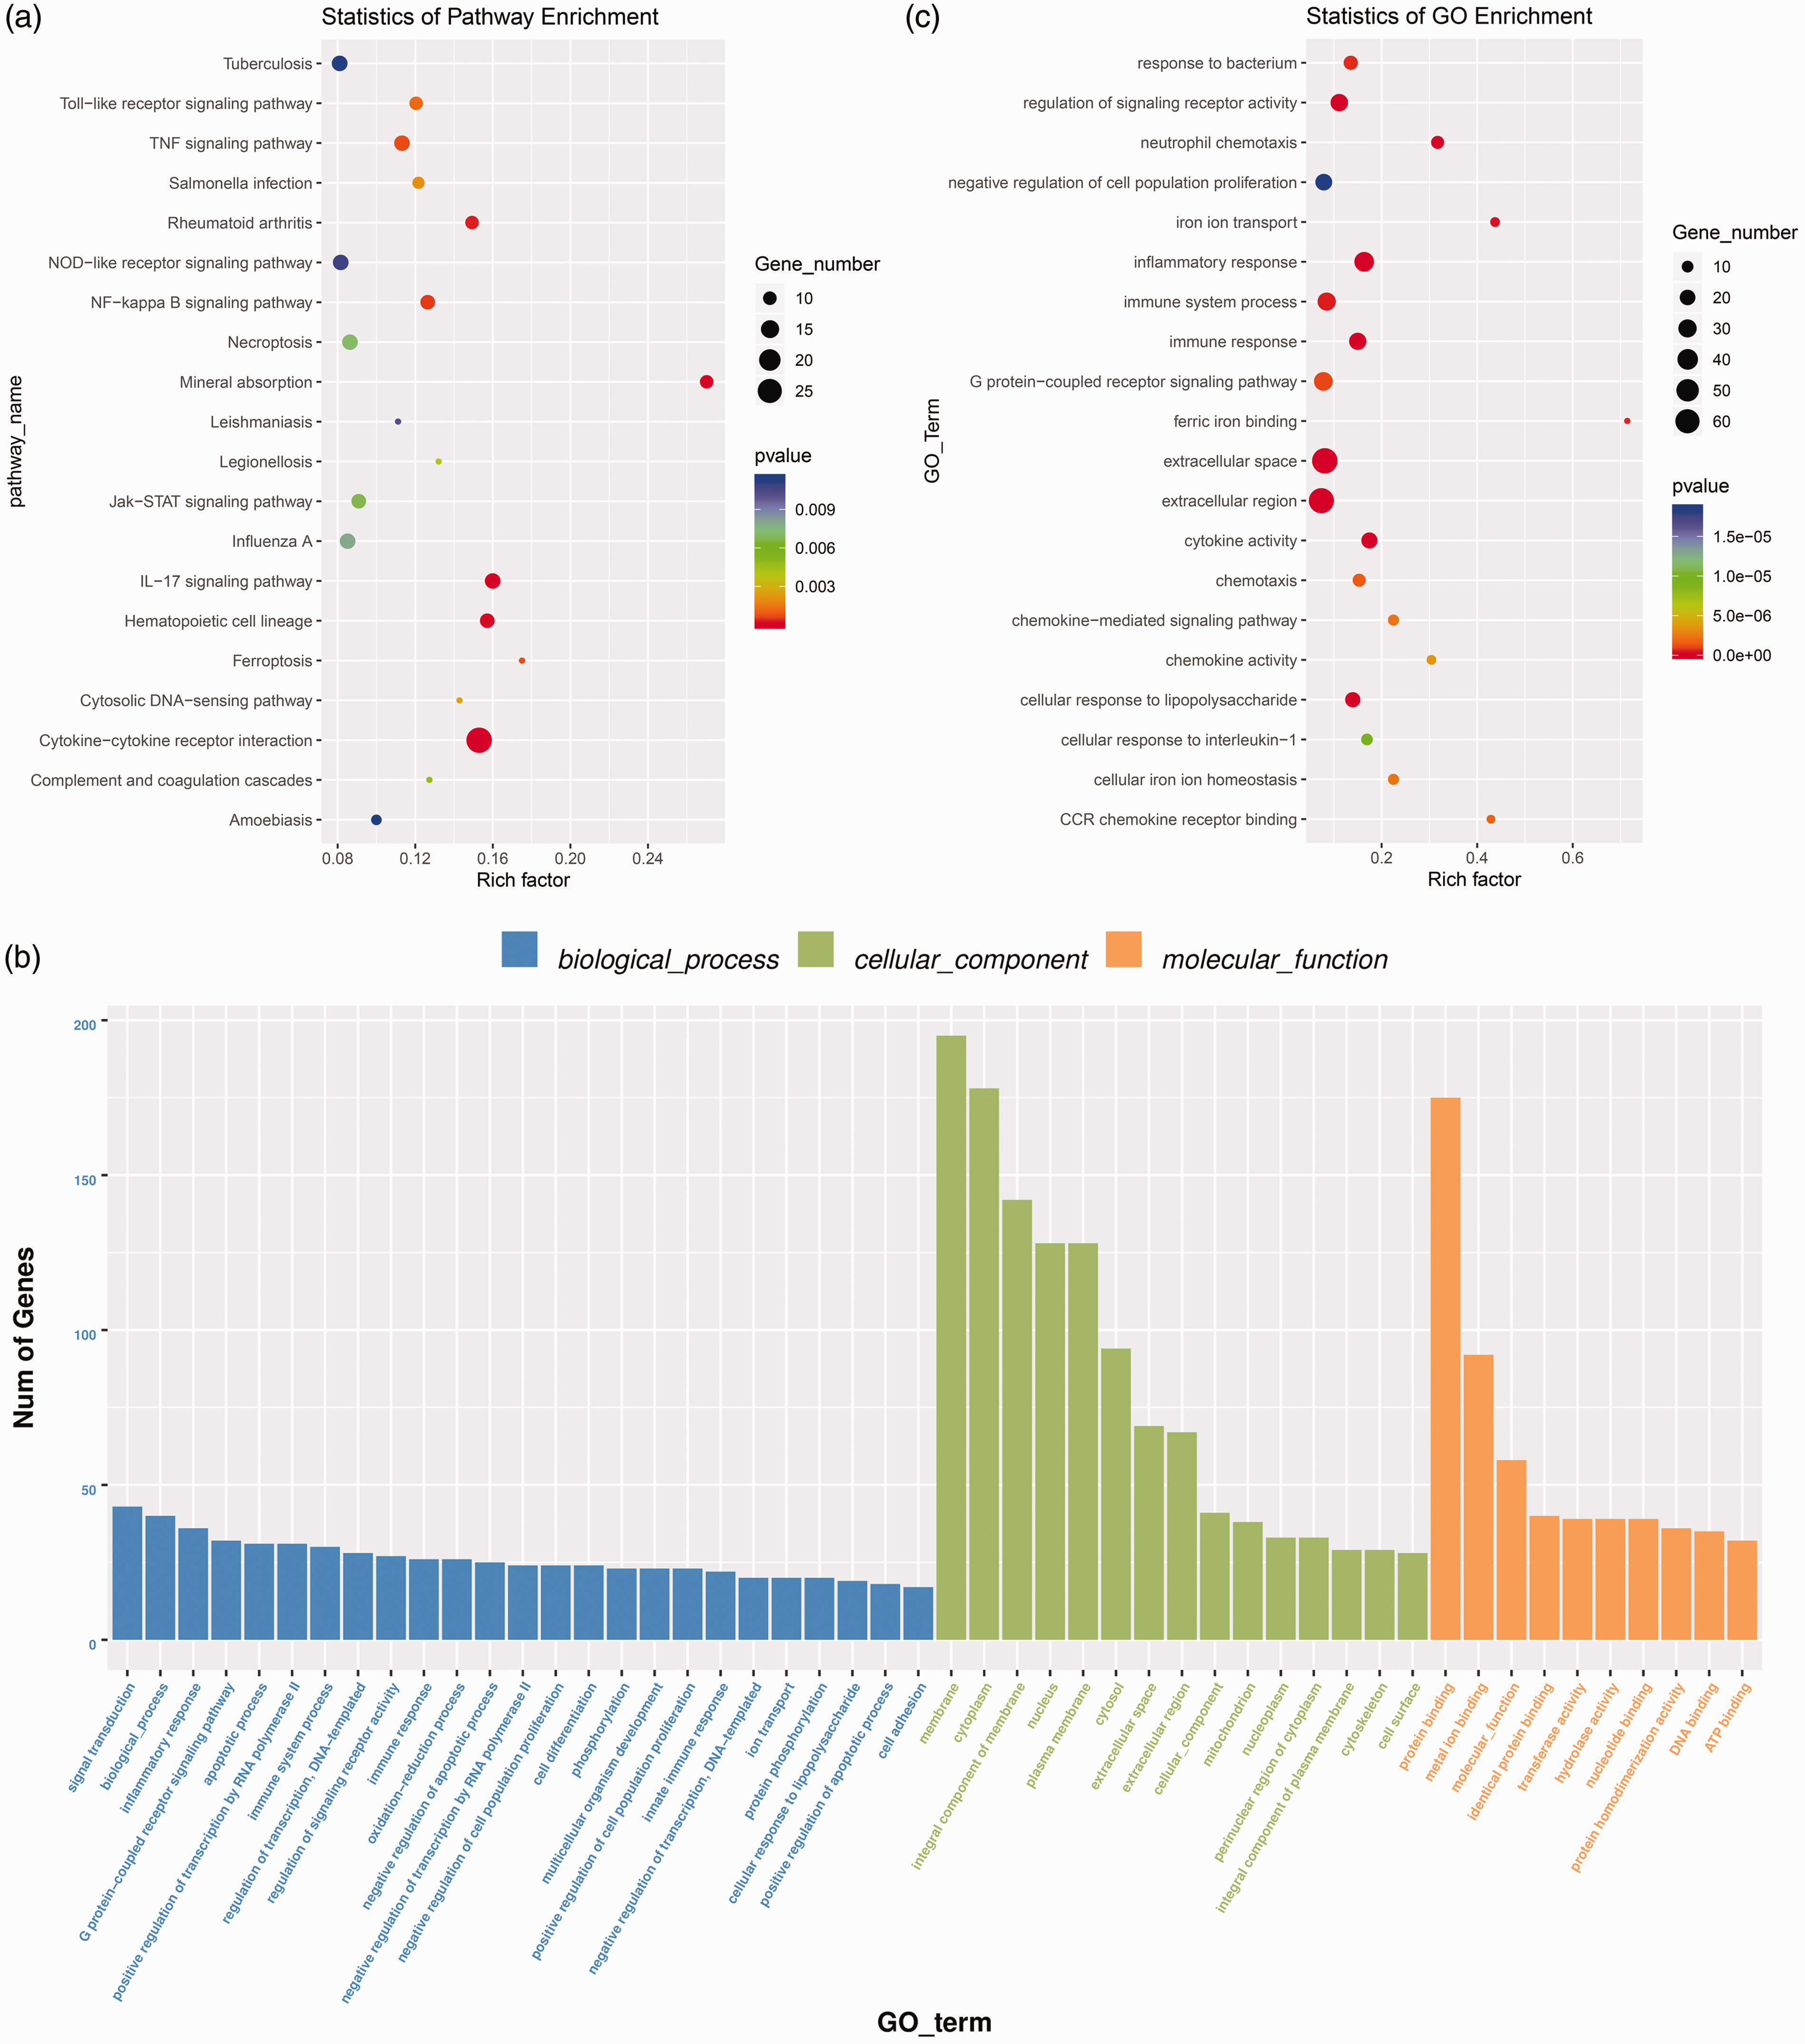
KEGG and GO enrichment analysis of DEGs. (a) KEGG pathway enrichment analysis of the DEGs. y-axis: pathway name; x-axis: rich factor. The color of each bubble represents the P value, and bubble size represents the gene number. (b) The GO enrichment analysis histogram results reflected the number distribution of DEGs on GO terms enriched by biological process, cellular component, and molecular function. (c) GO enrichment scatter plot of DEGs, y-axis: GO terms; x-axis: rich factor. The color of each bubble represents the P value, and bubble size represents the gene number.
The results of GO functional analysis demonstrated that DEGs of RAW264.7 macrophage cells challenged with B. ovis were involved in multiple immunological pathways, which were inflammatory response (GO:0006954) covering 36 DEGs (Figure 4a and Table S1), immune system process (GO:0002376) covering 30 DEGs (Figure 4b and Table S2), immune response (GO:0006955) covering 26 DEGs (Figure 4c and Table S3), cytokine activity (GO:0005125) covering 22 DEGs (Figure 4d and Table S4), chemotaxis (GO:0006935) covering 13 DEGs (Figure 4e and Table S5), chemokine-mediated signaling pathway (GO:0070098) covering nine DEGs (Figure 4f and Table S6), chemokine activity (GO:0008009) covering seven DEGs (Figure 4g and Table S7), and CCR chemokine receptor binding (GO:0048020) covering six DEGs (Figure 4h and Table S8).
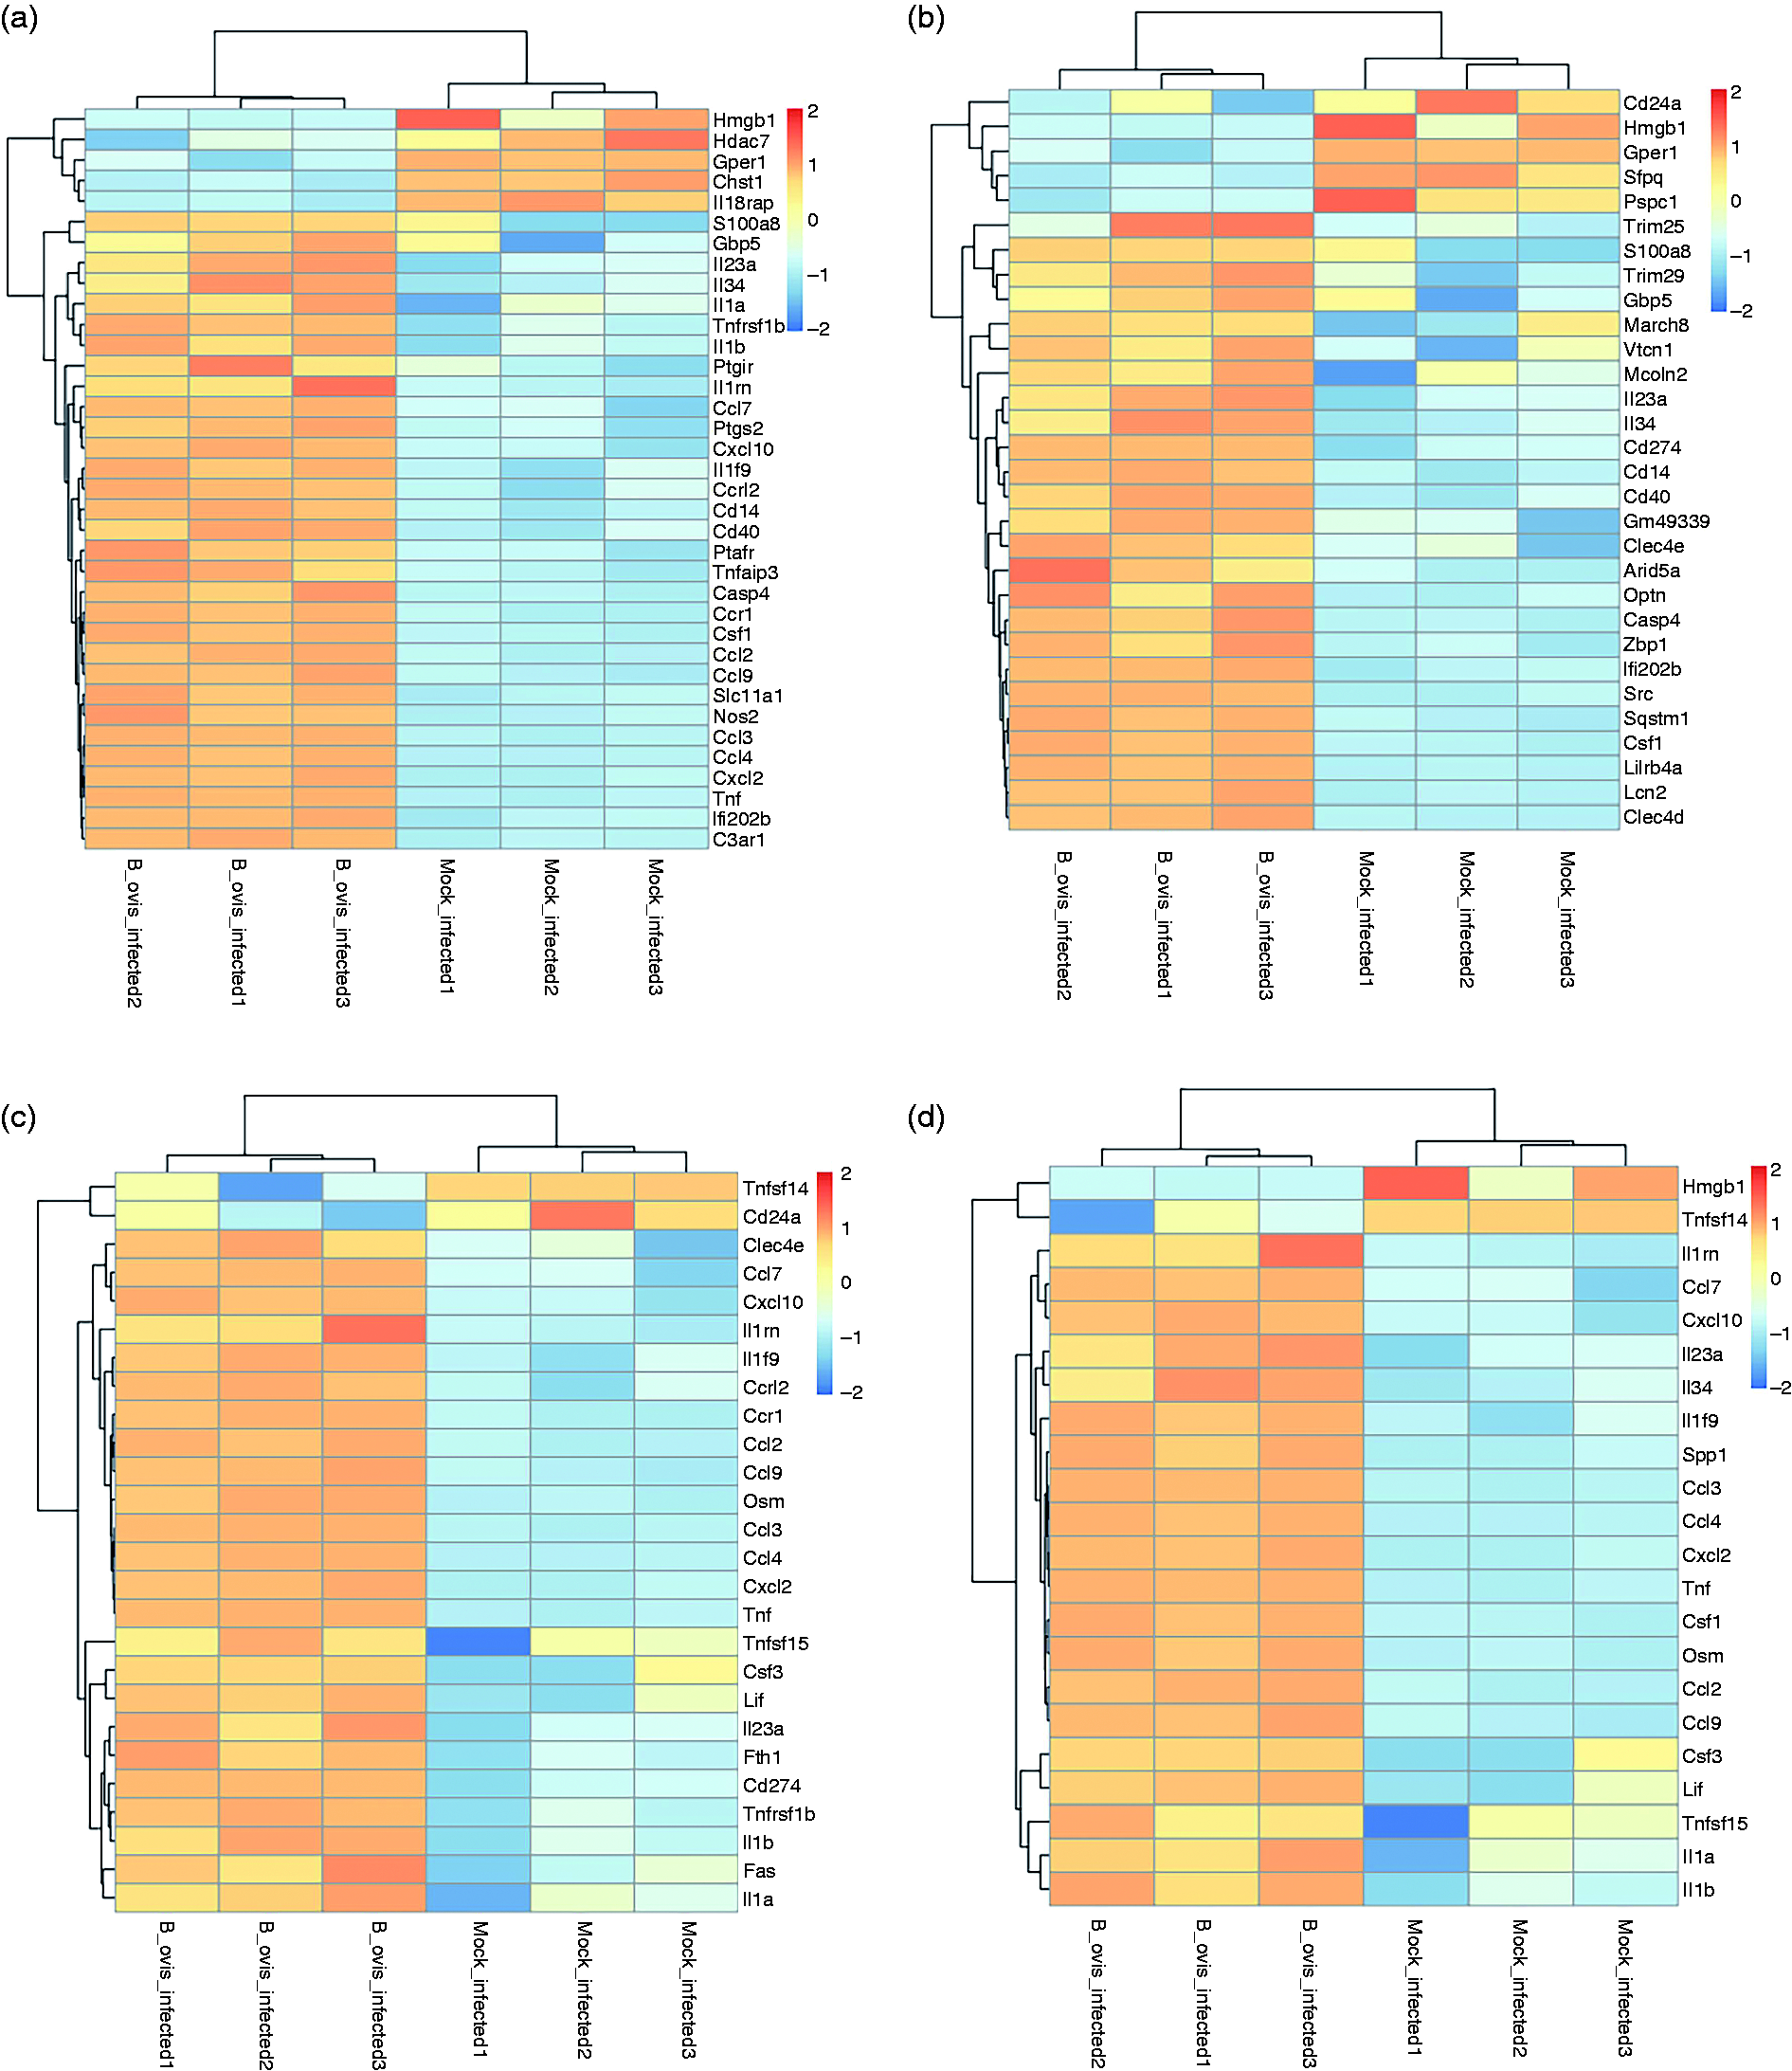
Heatmap of the immunological pathways of RAW264.7 macrophage cells in response to B. ovis infection. (a) Inflammatory response (GO:0006954). (b) Immune system process (GO:0002376). (c) Immune response (GO:0006955). (d) Cytokine activity (GO:0005125). (e) Chemotaxis (GO:0006935). (f) Chemokine-mediated signaling pathway (GO:0070098). (g) Chemokine activity (GO:0008009). (h) CCR chemokine receptor binding (GO:0048020).
Validation for DEGs using qRT-PCR
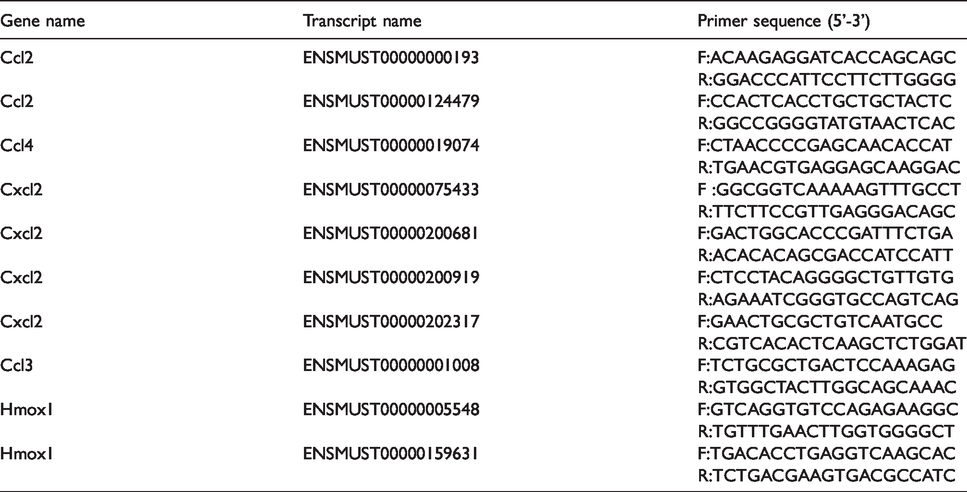
To confirm the results of the transcriptome sequencing data, we selected the top 10 up-regulated DEGs induced by B. ovis_infect to use with the qRT-PCR technique. The primers were designed by NCBI primer online software, and GAPDH was used as an internal control (Table 4). The results showed that Ccl2 (ENSMUST00000000193), Ccl2 (ENSMUST00000124479), Ccl3 (ENSMUST00000001008), Hmox1 (ENSMUST00000005548), Hmox1 (ENSMUST00000159631), Cxcl2 (ENSMUST00000075433), Cxcl2 (ENSMUST00000200681), Cxcl2 (ENSMUST00000200919), and Cxcl2 (ENSMUST00000202317) were significantly increased in the B. ovis_infected group similar to the sequencing results (Figure 5). Altogether, transcriptome sequencing provided a powerful tool for the study of DEGs, even though there were some false positives, and qRT-PCR can be used to validate the real positives and remove the false positives.
The primers of the selected 10 DEGs for qRT-PCR validation.
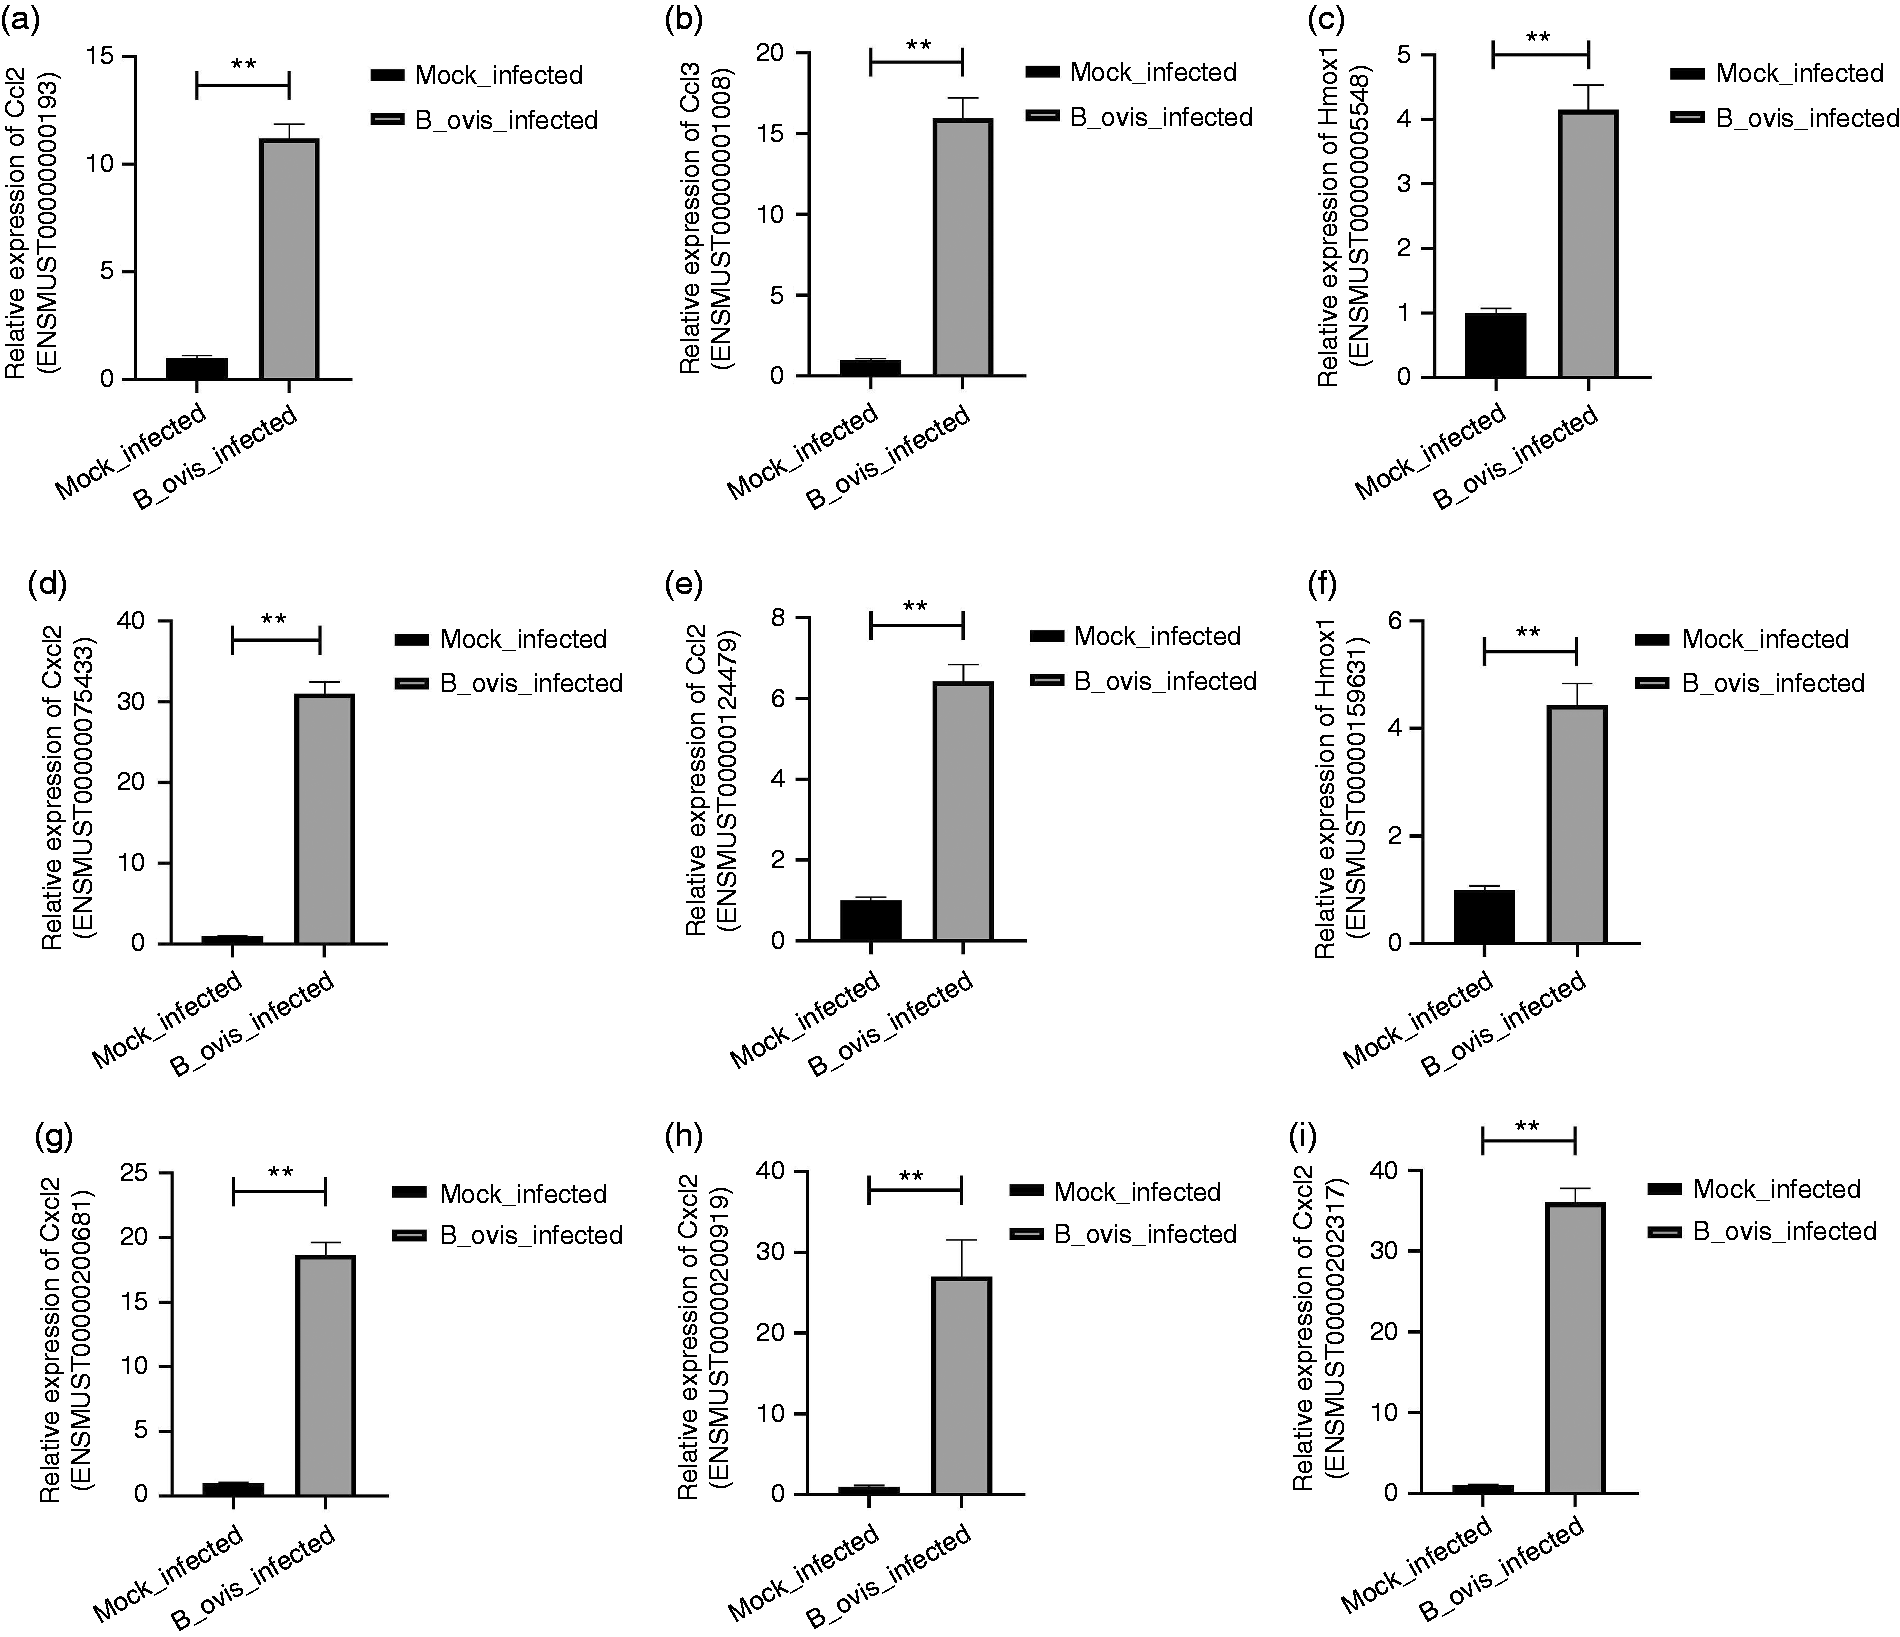
qRT-PCR validation for the partial transcriptome data. “*” stands for P value < 0.05, and “**” stands for P value < 0.01.
Discussion
Brucella is a kind of Gram-negative immobile bacteria, which can live in various domestic animals. 31 Phagocytes secrete digestive enzymes to eliminate the bacteria. However, Brucella is an intracellular bacterium, which can adapt to the intracellular environment in the chronic stage, leading to difficulties in curing it clinically and globally, causing brucellosis.32–34 It was found that the outer membrane proteins and type IV secretory system family protein of Brucella were directly related to the infection, intracellular survival, and reproduction of Brucella, and were recognized as virulence factors. The molecular basis of action of Brucella is closely related to the binding of virulence factors of Brucella and macrophage target protein. 35 , 36 There are high amounts erythritol in animal placenta, which can promote the growth of Brucella. Brucella has a significant affinity to placenta. The embryonic trophoblast is the link between mother and fetus, and the target cell of Brucella infection. Once damaged, it will lead to abortion, but the molecular mechanism of abortion is not clear. 37 , 38
Compared with first-generation sequencing technology, high-throughput sequencing technology is a milestone in the field of genomics because of lower costs and better opportunity to identify DEGs for further studying the pathogenesis of diseases.39–41 Brucella can be transmitted through contaminated placenta and aerosol, and can enter the host through gastrointestinal and respiratory mucosae. The mucosal immune response is the host’s main defense host against invasive Brucella.42–44 B. abortus activates NLR family thermoprotein domain protein 3 (NLRP3) and AIM2 inflammasome to secrete IL-1β and IL-18 cytokines and mediate inflammatory response. During Brucella infection, the type IV secretion system and virB co-regulate caspase-1 activation and the pro-inflammatory response. 45 B. abortus induced IL-6 secretion in mice, and then activated a Th1 cell-mediated immune response. Cytokine signal transduction inhibitor 3 (SOCS3) regulated IL-6 through the JAK/STAT pathway, which affected the activity of the macrophage response to Brucella infection and initiated an immune response. 46 It was reported that the variation of BoLA-A host (exons 2–3 and 4–5) was related to the host immune response to B. abortus. 47 After BALB/c mice were infected by B. abortus, the induction of mucosal and systemic immunity showed that the total Ag-specific IgG significantly increased in infected groups. In addition, the spleen cells in the infected group produced IFN-γ and IL-4, indicating induction of both Th1 and Th2 responses. 48 The innate immune process mediated by inflammatory corpuscles is the key to the treatment of brucellosis. It can regulate the activation of caspase-1-related inflammasome leading to the secretion of IFN-γ, IL-18, and other cytokines, activation of the cellular immune response, and targets to kill the invasive Brucella. 49
Chemokines are small cytokines or signal proteins secreted by host cells, and manage the migration of leukocytes to respective positions in the process of inflammation and homeostasis. 50 B. canis infects primary canine trophoblast cells and induces the increase of TNF-α and CC chemokine ligand 5 (CCL5) secretion, which may lead to placental inflammation and abortion in pregnant female dogs. 51 Human lung epithelial cells secrete CCL20 and human β-defensin 2 (hBD2), binding with membrane receptors to mediate the response of host immune cells to B. abortus by secreting cytokines. 52 The studies showed that B. ovis preferred to infect macrophages during chronic infection. Transcription microarray analysis was carried out on the macrophages infected by B. melitensis, B. neotomae and B. ovi, and we uncovered a mechanism of common natural immune response via significantly increasing levels of chemokines. 53 As is known, IFN-γ and chemokines play important roles in the prevention of Brucella infection. Altogether, the studies suggest that synergies between cytokines and chemokines play a key protective role in the response to Brucella infection. 54
Although there are some studies on the mechanism of the host immune response to Brucella infection, the response of RAW264.7 macrophages to B. ovis is still unclear. In this study, we first generated the mRNA profile of B. ovis-infected RAW264.7 macrophages, and identified 601 DEGs, belonging to eight immunological pathways. In detail, they were inflammatory response (GO:0006954) including 36 DEGs, immune system process (GO:0002376) including 30 DEGs, immune response (GO:0006955) including 26 DEGs, cytokine activity (GO:0005125) including 22 DEGs, chemotaxis (GO:0006935) including 13 DEGs, chemokine-mediated signaling pathway (GO:0070098) including nine DEGs, chemokine activity (GO:0008009) including seven DEGs, and CCR chemokine receptor binding (GO:0048020) including six DEGs. We selected the top 10 DEGs with high expression for qRT-PCR validation; nine of them were consistent with the sequencing results: only CCl4 (ENSMUST00000019074, 660bp) showed a verification error, indicating that there may be a false positive. Our findings may provide insights for elucidating the interactions of B. ovis with host and demonstrating the molecular mechanism of B. ovis infection.
Supplemental Material
sj-pdf-1-ini-10.1177_1753425920958179 - Supplemental material for Immunological pathways of macrophage response to Brucella ovis infection
Supplemental material, sj-pdf-1-ini-10.1177_1753425920958179 for Immunological pathways of macrophage response to Brucella ovis infection by Zhixiong Zhou, Guojing Gu, Yichen Luo, Wenjie Li, Bowen Li, Yu Zhao, Juan Liu, Xuehong Shuai, Li Wu, Jixuan Chen, Cailiang Fan, Qingzhou Huang, Baoru Han, Jianjun Wen and Hanwei Jiao: for BAT2 Investigators in Innate Immunity
Footnotes
Declaration of conflicting interests
The author(s) declared no potential conflicts of interest with respect to the research, authorship, and/or publication of this article.
Funding
The author(s) disclosed receipt of the following financial support for the research, authorship, and/or publication of this article: This study was financially supported by the National Science Foundation for Young Scientists of China (No. 31802215), the Fundamental Research Funds for the Central Universities (Nos. XDJK2020C022, XDJK2019C024), and the Chongqing Research Program of Basic Research and Frontier Technology (No. cstc2018jcyjA0807).
Supplemental material
Supplemental material for this article is available online.
References
Supplementary Material
Please find the following supplemental material available below.
For Open Access articles published under a Creative Commons License, all supplemental material carries the same license as the article it is associated with.
For non-Open Access articles published, all supplemental material carries a non-exclusive license, and permission requests for re-use of supplemental material or any part of supplemental material shall be sent directly to the copyright owner as specified in the copyright notice associated with the article.