
Abstract
Spontaneous apoptosis of neutrophils plays a key role in maintaining immune homeostasis and resolving inflammation. However, the mechanism triggering this apoptosis remains obscure. In the present study, we performed a global metabolomics analysis of neutrophils undergoing spontaneous apoptosis by using hydrophilic interaction chromatography ultra-high-performance liquid chromatography-tandem quadrupole/time-of-flight mass spectrometry and found 23 metabolites and 42 related pathways that were altered in these cells. Among them, glutathione, which is known to be involved in apoptosis, was particularly interesting. We found that
Introduction
Neutrophils have a short life span of < 24 h in culture and 5.4 d in the human circulation. 1 , 2 The death of neutrophils, termed spontaneous apoptosis, is an essential step to preventing activated neutrophils from releasing their highly cytotoxic contents into the circulation and subsequently damaging the surrounding tissue. 3 LPS is derived from Gram-negative bacteria, has been reported to reduce apoptosis significantly in neutrophils, and plays a key role in the resolution of inflammation. 4 Dys-regulation of spontaneous apoptosis of neutrophils has been involved in the destruction of immunological homeostasis, which can lead to several inflammatory diseases and cancers. 5 , 6
Although it is known that the neutrophil apoptosis rate under physiological conditions is controlled via regulation of apoptotic protein factors such as caspase-3, Mcl-1, and NF-κB,7–9 the precise mechanism triggering their apoptosis is still poorly understood.
Cellular metabolism plays a decisive role in the function and plasticity of diverse immune cells, including T cells and macrophages, 10 , 11 and evidence of the metabolic regulation of neutrophil biology is mounting.12–17 However, there are a limited number of studies investigating changes in the intra-cellular metabolites of apoptotic neutrophils. A metabolomic analysis provides a global metabolic profile by quantifying the metabolites produced in cellular processes and biochemical reactions. New innovative metabolomic technologies offer the possibility to screen for novel biomarkers and deepen our understanding of pathological processes. 18 , 19 Recently, Richer et al. used NMR spectroscopy to find increased levels of NAD+ and decreased levels of ATP, glutathione (GSH), hypotaurine, and phosphocholine in aged neutrophils. 16 However, NMR is recognized as less advantageous compared with ultra-high-performance liquid chromatography-quadrupole/time-of-flight hybrid mass spectrometry (UHPLC-Q-TOF MS), which can reveal the overall terminal products of cell in any given pathological state and is particularly suitable for low levels of metabolites. 20 , 21
In this study, we performed a new metabolomic analysis (UHPLC-Q-TOF MS) to obtain a global metabolite profile of apoptotic neutrophils and investigate the possible mechanism triggering their apoptosis. Our findings will help to identify potential biomarkers for the diagnosis and target of neutrophil-mediated inflammatory diseases and open new avenues for metabolism-based regulation of neutrophil function.
Materials and methods
Chemicals
LPS from Escherichia coli (0111:B4) was purchased from Sigma-Aldrich (St. Louis, MO, USA). GSH and an enhanced ATP assay kit were obtained from Beyotime Biotechnology (Shanghai, China). RPMI 1640 medium and FBS were from Gibco-BRL (Grand Island, NY, USA). Percoll was obtained from GE Healthcare Biosciences (Piscataway, NJ, USA). The GSH assay kit was from Nanjing Jiancheng Bioengineering Institute (Nanjing, China). The Annexin V-propidium iodide (PI) apoptosis assay kit was purchased from Wanlei Biotechnology Co., Ltd (Shenyang, China). Primary rabbit polyclonal Abs against β-actin, caspase-3, and ChaC1 were obtained from Proteintech (Chicago, IL, USA). All secondary Abs and the enhanced chemiluminescence reagent (ECL) were obtained from Cell Signaling Technology (Boston, MA, USA). All other reagents were from commercial suppliers and of standard biochemical grade.
Neutrophil harvesting and treating
Male C57BL/6 mice (age, 8–10 wk) were purchased from the Experimental Animal Center, Medical College of Yangzhou University. Animal welfare and experimental procedures were carried out in accordance with the Guidelines for the Care and Use of Laboratory Animals published by the National Academy Press, and the related ethical regulations of Jiangsu University.
Bone marrow cells were flushed with Hank's Balanced Salt Solution then layered on top of a discontinuous Percoll gradient (50%, 69%, and 78%). The cells harvested between 69% and 78% were considered neutrophils as described previously. 22 The purity of neutrophils was > 90% as assessed by flow cytometry and Giemsa-Wright staining (data not shown). Neutrophils were maintained in RPMI 1640 medium supplemented with 10% heat-inactivated FBS and kept at 37°C in a humidified atmosphere with 5% CO2. Neutrophils immediately collected after isolation were called the Control group. Cells cultured alone for 1 h, 4 h, and 24 h were named the Control 1 h, Control 4 h, and Control 24 h groups, respectively. Meanwhile, neutrophils stimulated with 1 μg/ml LPS for 4 h and 24 h were named the LPS 4 h and LPS 24 h groups, respectively.
Hydrophilic interaction chromatography UHPLC-Q-TOF MS
Neutrophils extracted from 10 mice were separated by UHPLC (1290 Infinity LC, Agilent Technologies) (Santa Clara, CA, USA) hydrophilic interaction chromatography (HILIC). Next, MS was performed using a Q-TOF system (Triple TOF 5600, ABSCIEX) (Boston, MA, USA) and detection was conducted in both electrospray ionization (ESI) positive and ESI-negative modes using a method described previously. 23
Spectrophotometric determination of intracellular reduced GSH content
Total GSH and GSSG (Glutathione Oxidized) were detected by 5,5′-dithiobis(2-nitrobenzoic acid) rate colorimetry. The procedure was performed according to the manufacturer’s instructions for the GSH assay kit. Finally, the intracellular GSH content was measured using a microplate reader.
Cell apoptosis assay
The apoptotic rate was measured by flow cytometry using an Annexin V‐FITC/PI apoptosis assay kit. Neutrophils after treatment were re-suspended in 500 µl binding buffer containing 5 µl Annexin V FITC and 10 µl PI, followed by an incubation for 20 min at room temperature in the dark. Next, apoptotic cells were analyzed by flow cytometry on the BD FACSCalibur flow cytometer (BD Biosciences) within no more than 1 h.
Western blot
Neutrophil proteins were extracted as described previously 24 and loaded onto a 10% SDS-polyacrylamide gel, separated, and transferred to a nitrocellulose membrane, which was incubated overnight with anti-caspase-3 Ab (1:1000 dilution) and anti-β-actin (1:2000 dilution). The secondary Ab used (1:2000 dilution) was an HRP-conjugated anti-rabbit IgG. The signals were detected using ECL reagent according to the manufacturer’s instructions.
RNA isolation and real-time PCR
Total RNA was extracted from neutrophils according to the manufacturer instruction of TRIzol reagent (Invitrogen). cDNA was reverse transcribed with oligo (dT) from total RNA extraction. Real-time PCR was performed with ABI 7500 (Thermo Fisher) and SYBR Green Master Mix kit (Takara). Target gene expression was normalized relative to a reference gene (β-actin). The PCR primers used in this study are listed in Supplemental Table S1.
Measurement of ATP synthesis
ATP content was measured by enhanced ATP assay kit. Briefly, neutrophils were lysed in lysis buffer and collected supernatant after centrifuging for 5 min at 12,000 g. Then, 20 μl lysate was added to a luciferin-luciferase assay mixture and the ATP content detected by a multifunctional microplate reader (PerkinElmer, USA).
Statistical analysis
For the metabolomic analysis, the data were pattern-recognized using SIMCA-P 14.1 software (Umetrics, Umea, Sweden). After the data were preprocessed by Pareto-scaling, multidimensional statistical analyses were carried out, including unsupervised principal component analysis, supervised partial least squares discriminant analysis (PLS-DA), and orthogonal PLS-DA (OPLS-DA). The R software was used to generate a volcano plot. The pathways related to the identified biomarkers were identified using MetaboAnalyst 3.0 (http://www.metaboanalyst.ca) (Montreal, QC, Canada). Kyoto Encyclopedia of Genes and Genomes (KEGG, http://www.genome.jp/kegg/) was used to analyze the significant levels of metabolite enrichment in each pathway.
Differences between data were tested by one-way ANOVA. A P value < 0.05 was considered significant. All experiments were conducted in triplicate and repeated three or four times.
Results
Metabolic profile of neutrophils undergoing spontaneous apoptosis and LPS-induced delay of cell death
Neutrophil underwent apoptosis for 4 h in our experiment (Supplemental Figure S1), so we chose 4–24 h for the following study. The OPLS-DA score plot shows the differences in metabolite levels between groups. In the ESI-positive and negative modes, clusters of metabolites showed clear separation between the Control versus Control 4 h and Control 4 h versus LPS 4 h groups (Supplemental Figure S2).
In addition, the differences in metabolites among groups were screened based on a variable importance for the projection > 1 using the OPLS-DA model. The results of t-tests and volcano and heatmap plots of the identified potential metabolic biomarkers are shown in Figure 1. In total, 23 metabolites were identified as potential biomarkers and showed differential abundances between the Control and Control 4 h groups in both ESI-positive and negative modes; among these, 14 metabolites increased including eicosapentaenoic acid, citraconic acid,
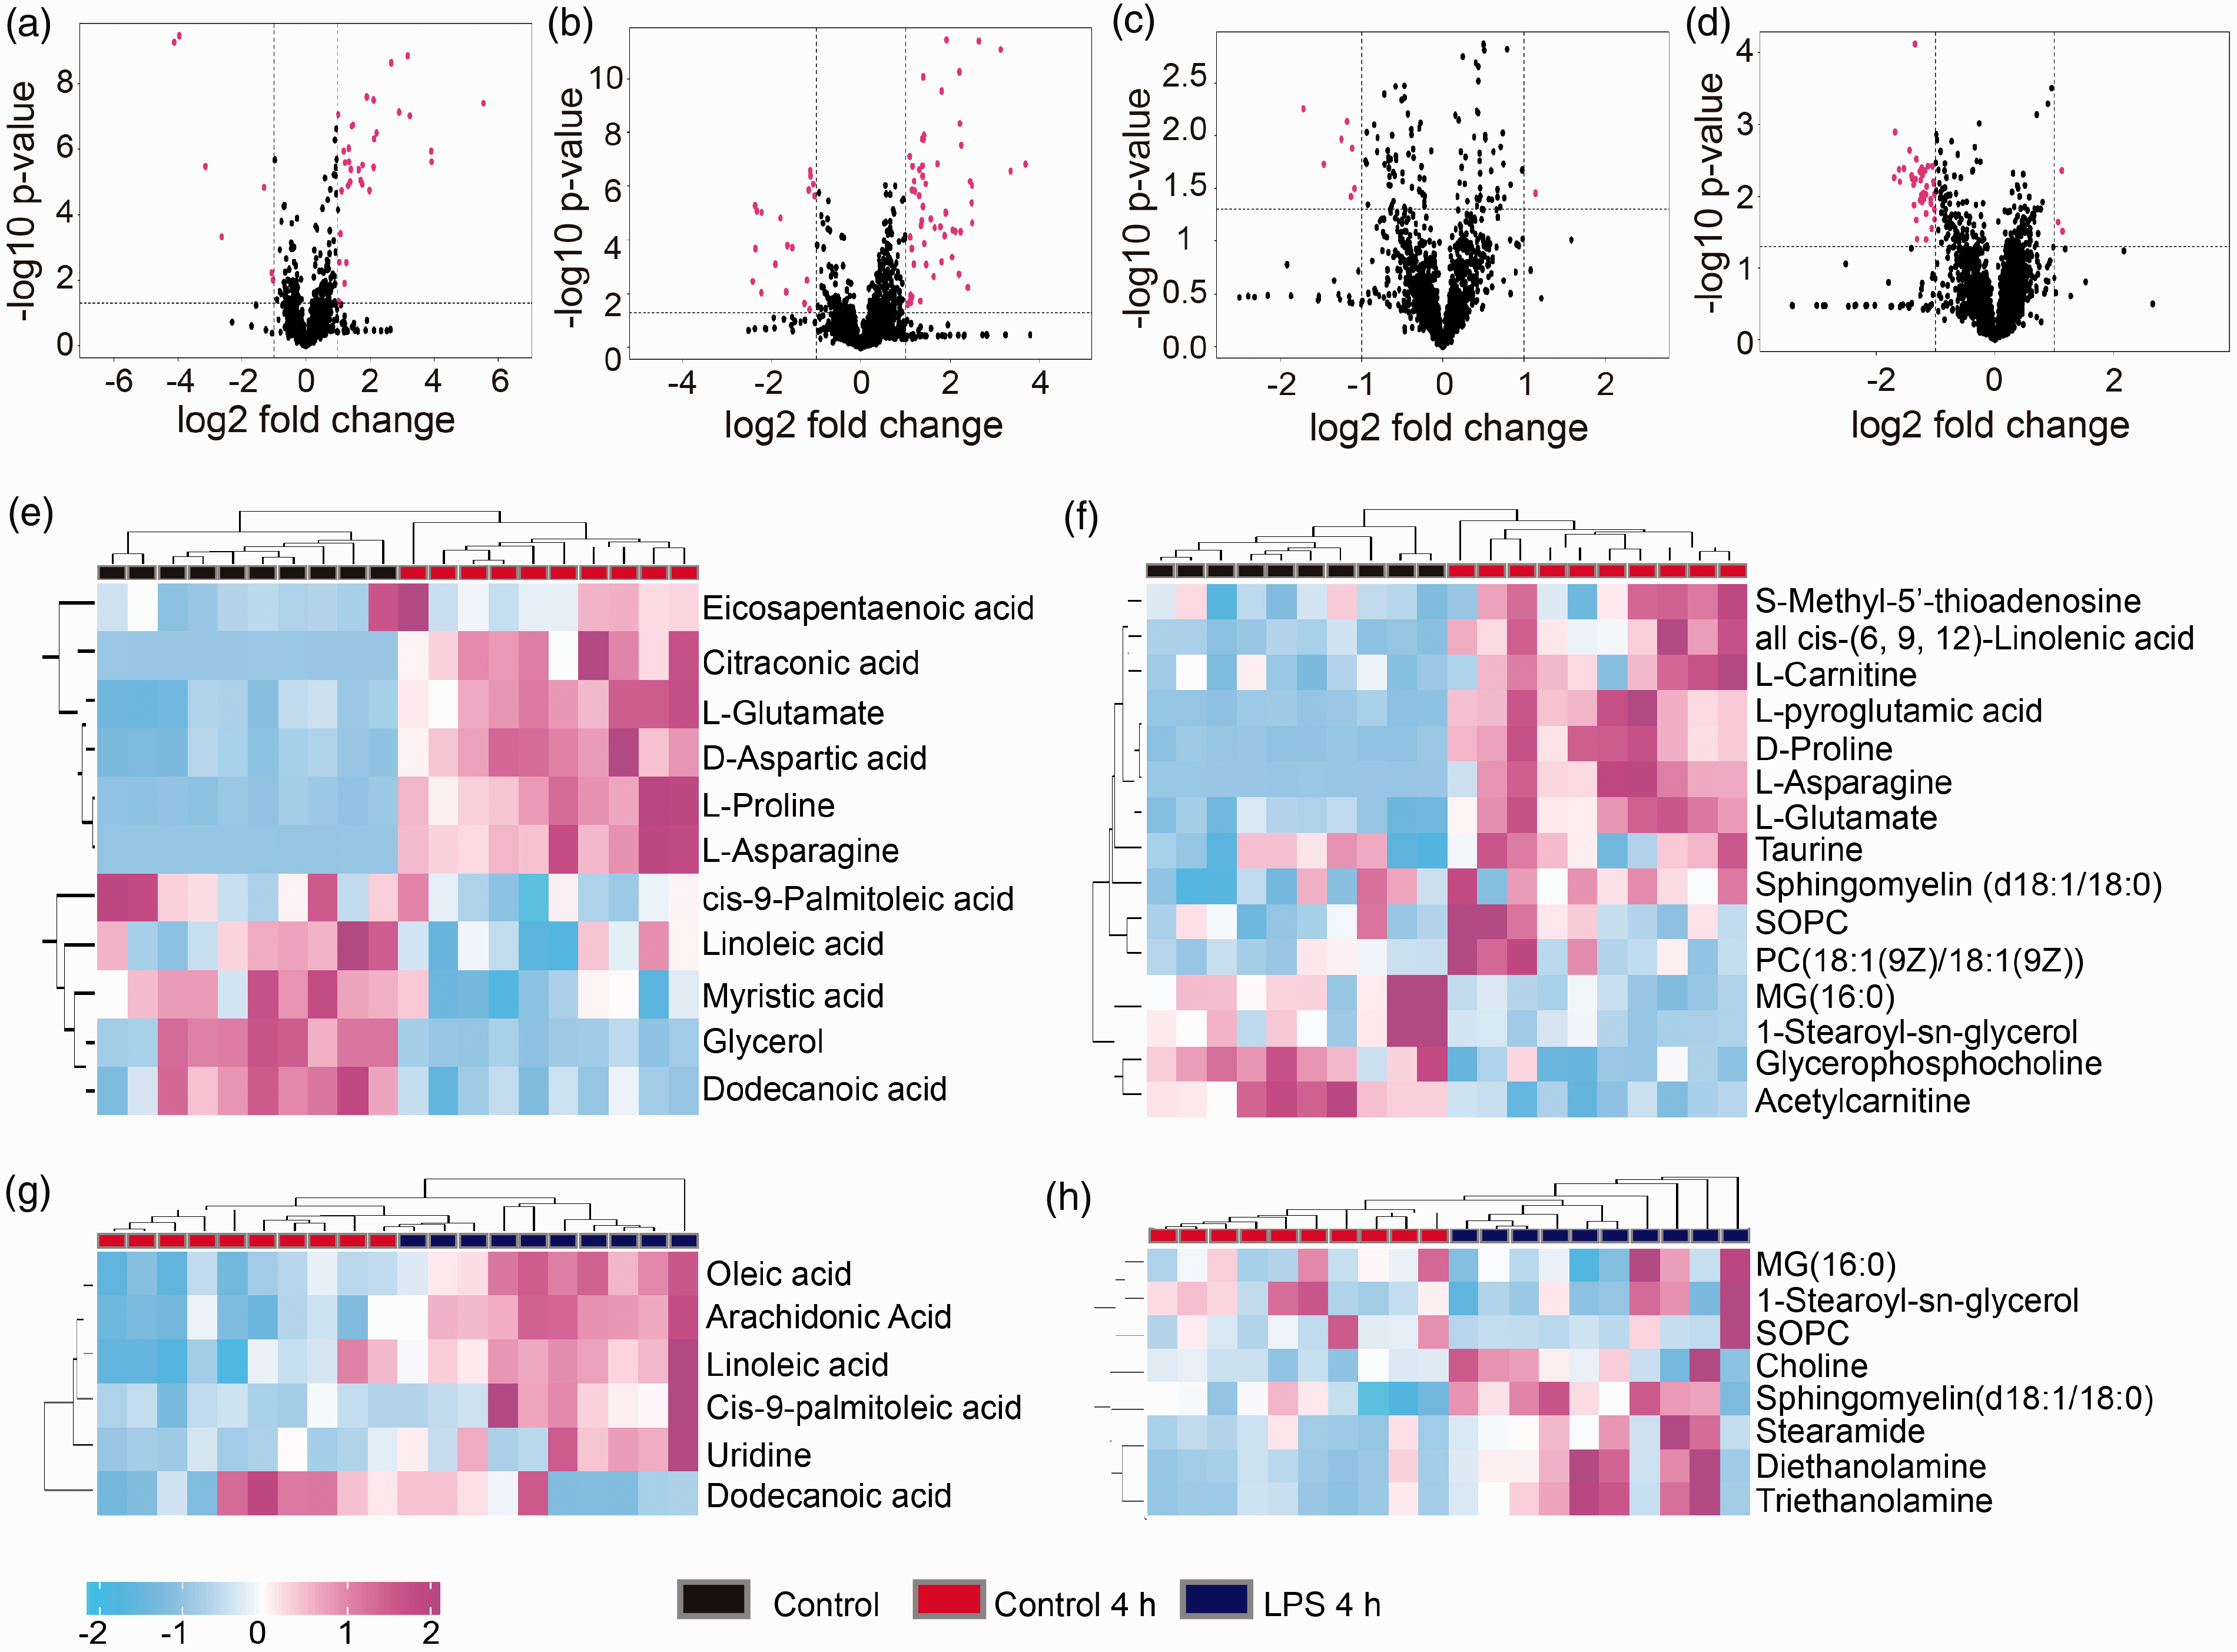
Metabolic differences in neutrophils undergoing spontaneous apoptosis. Volcano plots of differential metabolites between Control versus Control 4 h groups and Control 4 h versus LPS 4 h groups. (a) Control versus Control 4 h groups in positive-ion modes. (b) Control versus Control 4 h groups in negative-ion modes. (c) Control 4 h versus LPS 4 h groups in positive-ion modes. (d) Control 4 h versus LPS 4 h groups in negative-ion modes. Red dots represent the differential metabolites (fold change of > 1.5; P < 0.05). Heatmap of differential metabolites between Control versus Control 4 h groups and Control 4 h versus LPS 4 h groups. (e) Control versus Control 4 h groups in positive-ion modes. (f) Control versus Control 4 h groups in negative-ion modes. (g) Control 4 h versus LPS 4 h groups in positive-ion modes. (h) Control 4 h versus LPS 4 h groups in negative-ion modes. Red dots indicate differential metabolites (fold change > 1.5; P < 0.5).
MetaboAnalyst 3.0 and KEGG analyses were used to identify the pathways with differential activation in Control versus Control 4 h and Control 4 h versus LPS 4 h groups. As shown in Figure 2, linoleic acid metabolism,
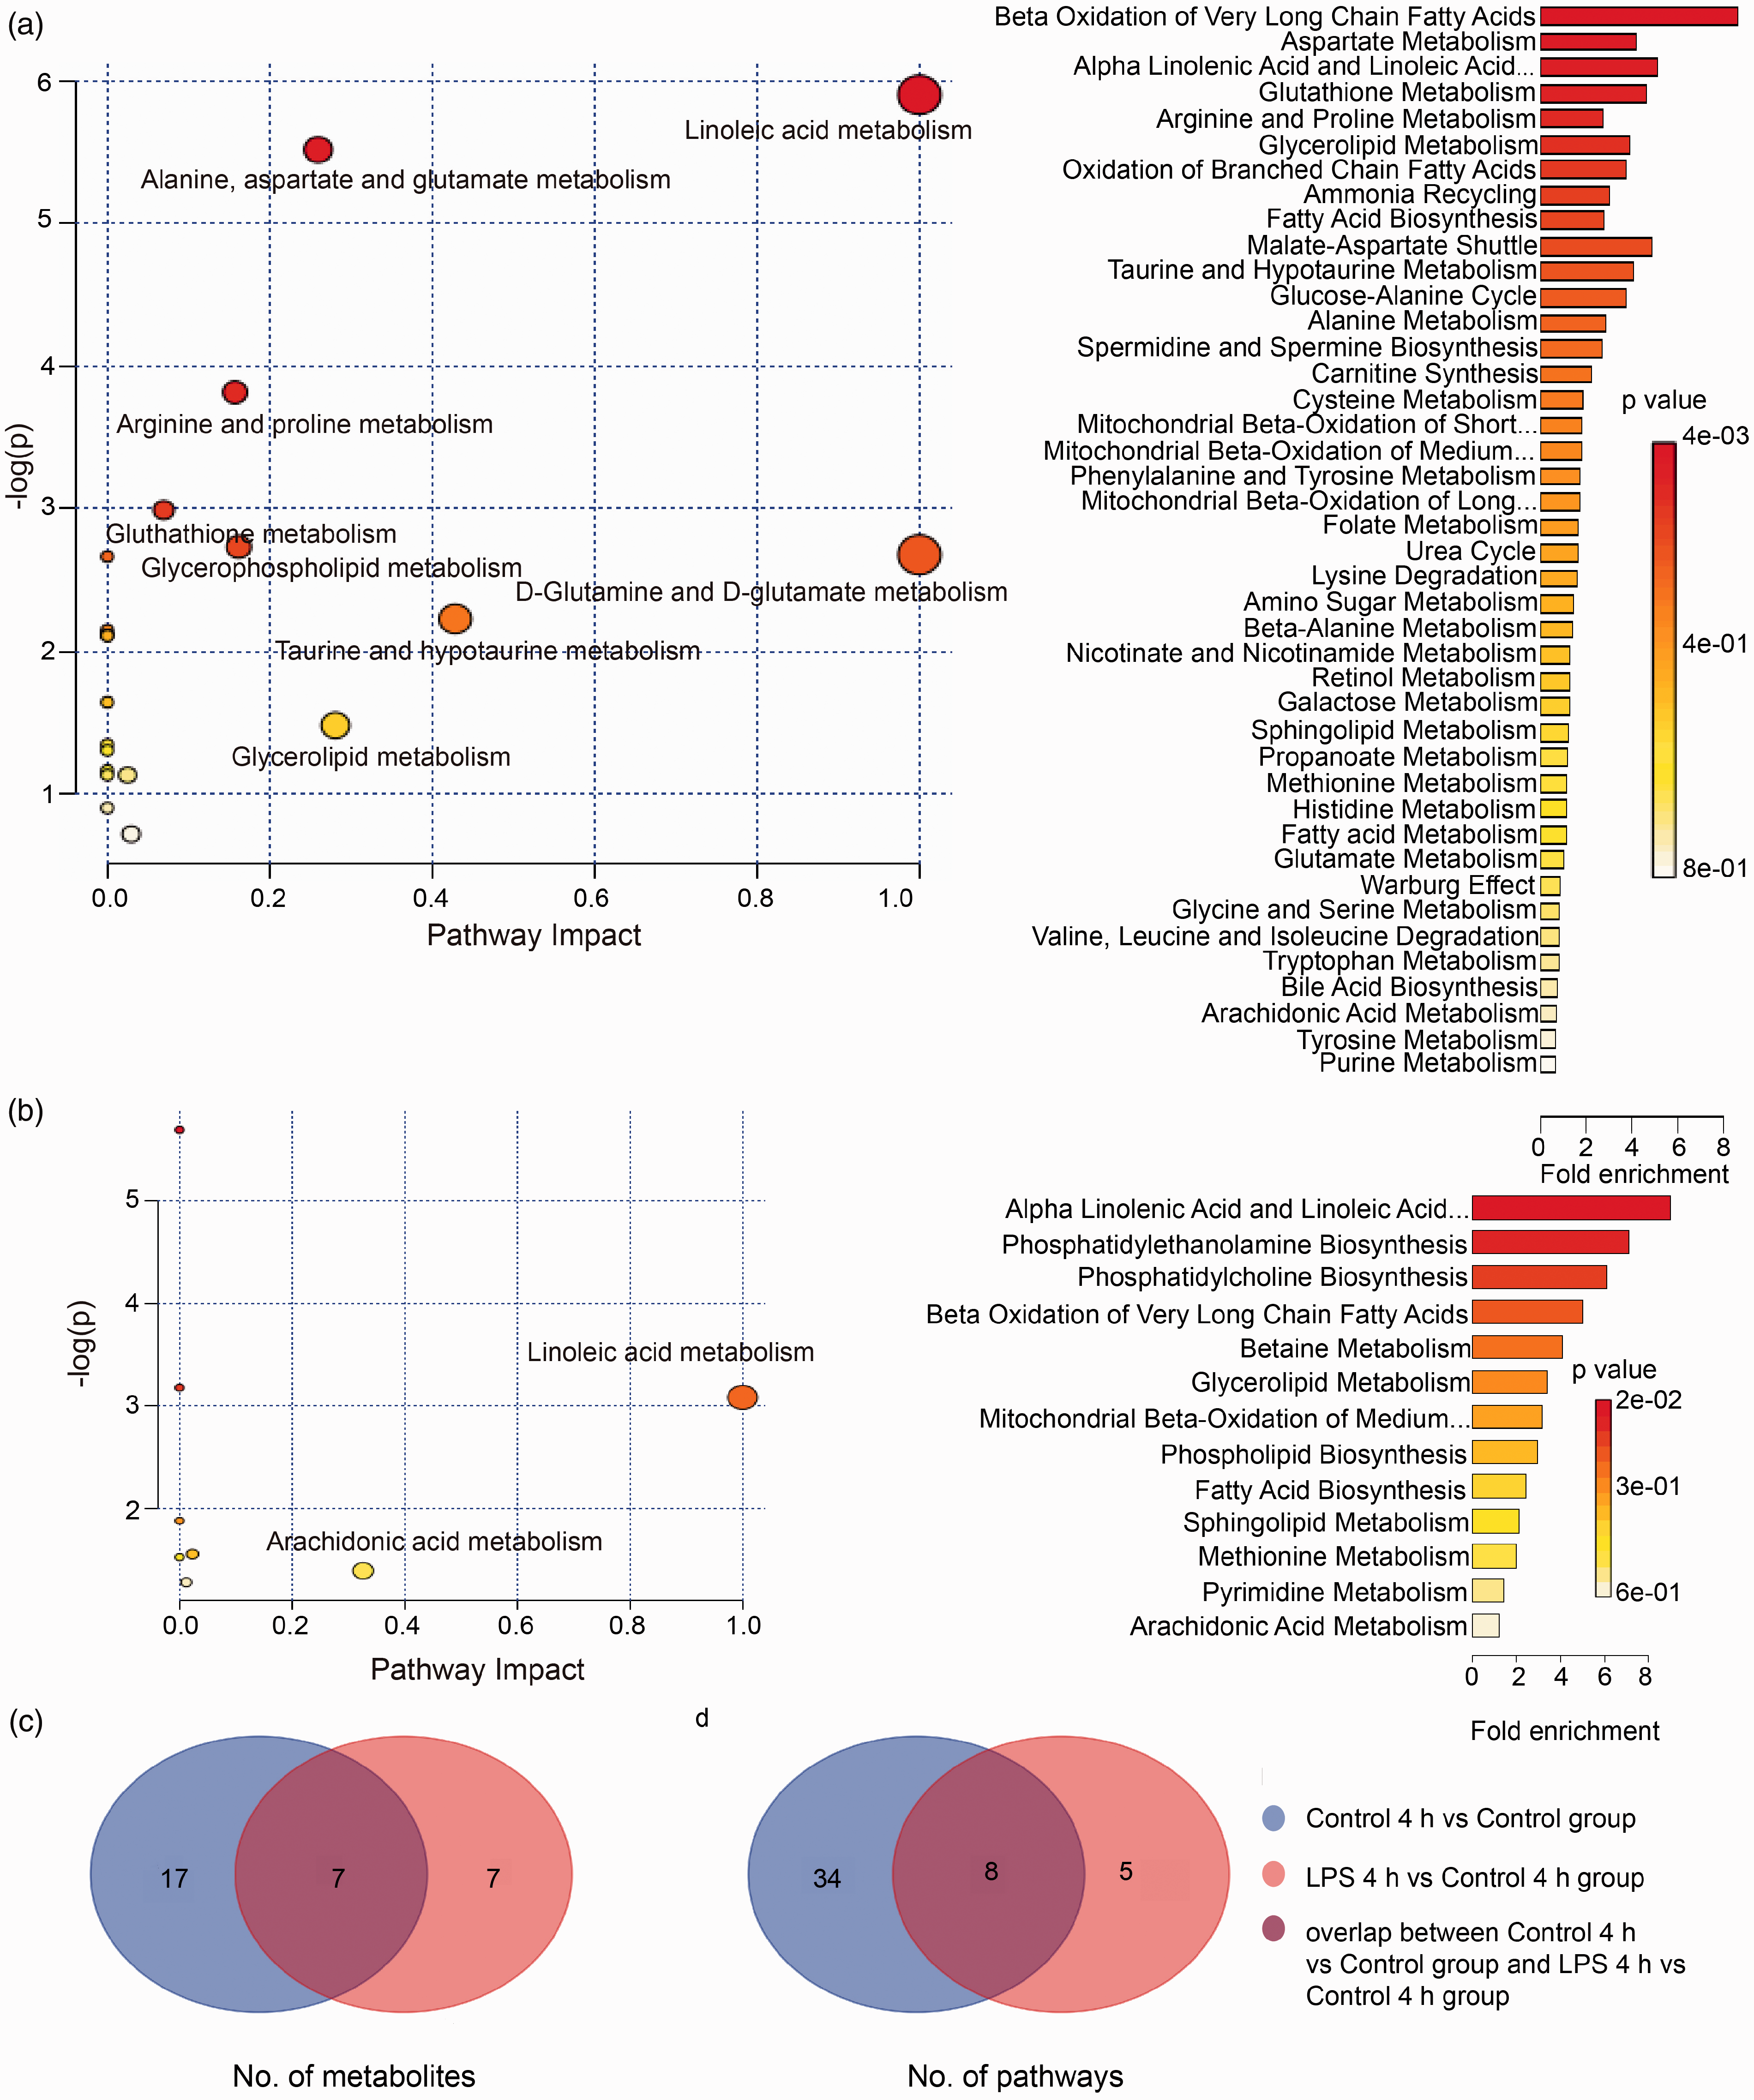
Metabolomic analysis results showing altered pathways in (a) Control versus Control 4 h groups and (b) Control 4 h versus LPS 4 h groups. The yellow and larger circle represents higher P values and pathway impact values, and the red and smaller circle represents lower P values and pathway impact values. Venn diagrams showing the number of (c) common and unique differentially abundant metabolites and (d) metabolic pathways between Control versus Control 4 h groups and Control 4 h versus LPS 4 h groups.
In addition, 17 differentially abundant metabolites and 34 related pathways were only identified between Control versus Control 4 h groups (Figure 2). The pathways included GSH metabolism, lysine degradation, histidine metabolism, taurine and hypotaurine metabolism, and glutamate metabolism. Among these, GSH metabolism is known to play a key role in the initiation of apoptosis 25 , 26 and, hence, was investigated further.
GSH depletion in apoptotic neutrophils
To determine whether GSH participated in neutrophil apoptosis, we first detected GSH levels. As shown in Figure 3a, the levels of reduced and total GSH and reduced/oxidized GSH ratio were decreased in the Control 4 h and Control 24 h groups compared with the Control group. These results suggested that apoptosis in neutrophils was accompanied by GSH depletion. Therefore, we next determined whether GSH depletion directly determined neutrophil survival. Figure 3b shows the percentage of apoptotic cells and levels of cleaved caspase-3 were both significantly decreased in the presence of 5 mmol/l GSH for 4–24 h.
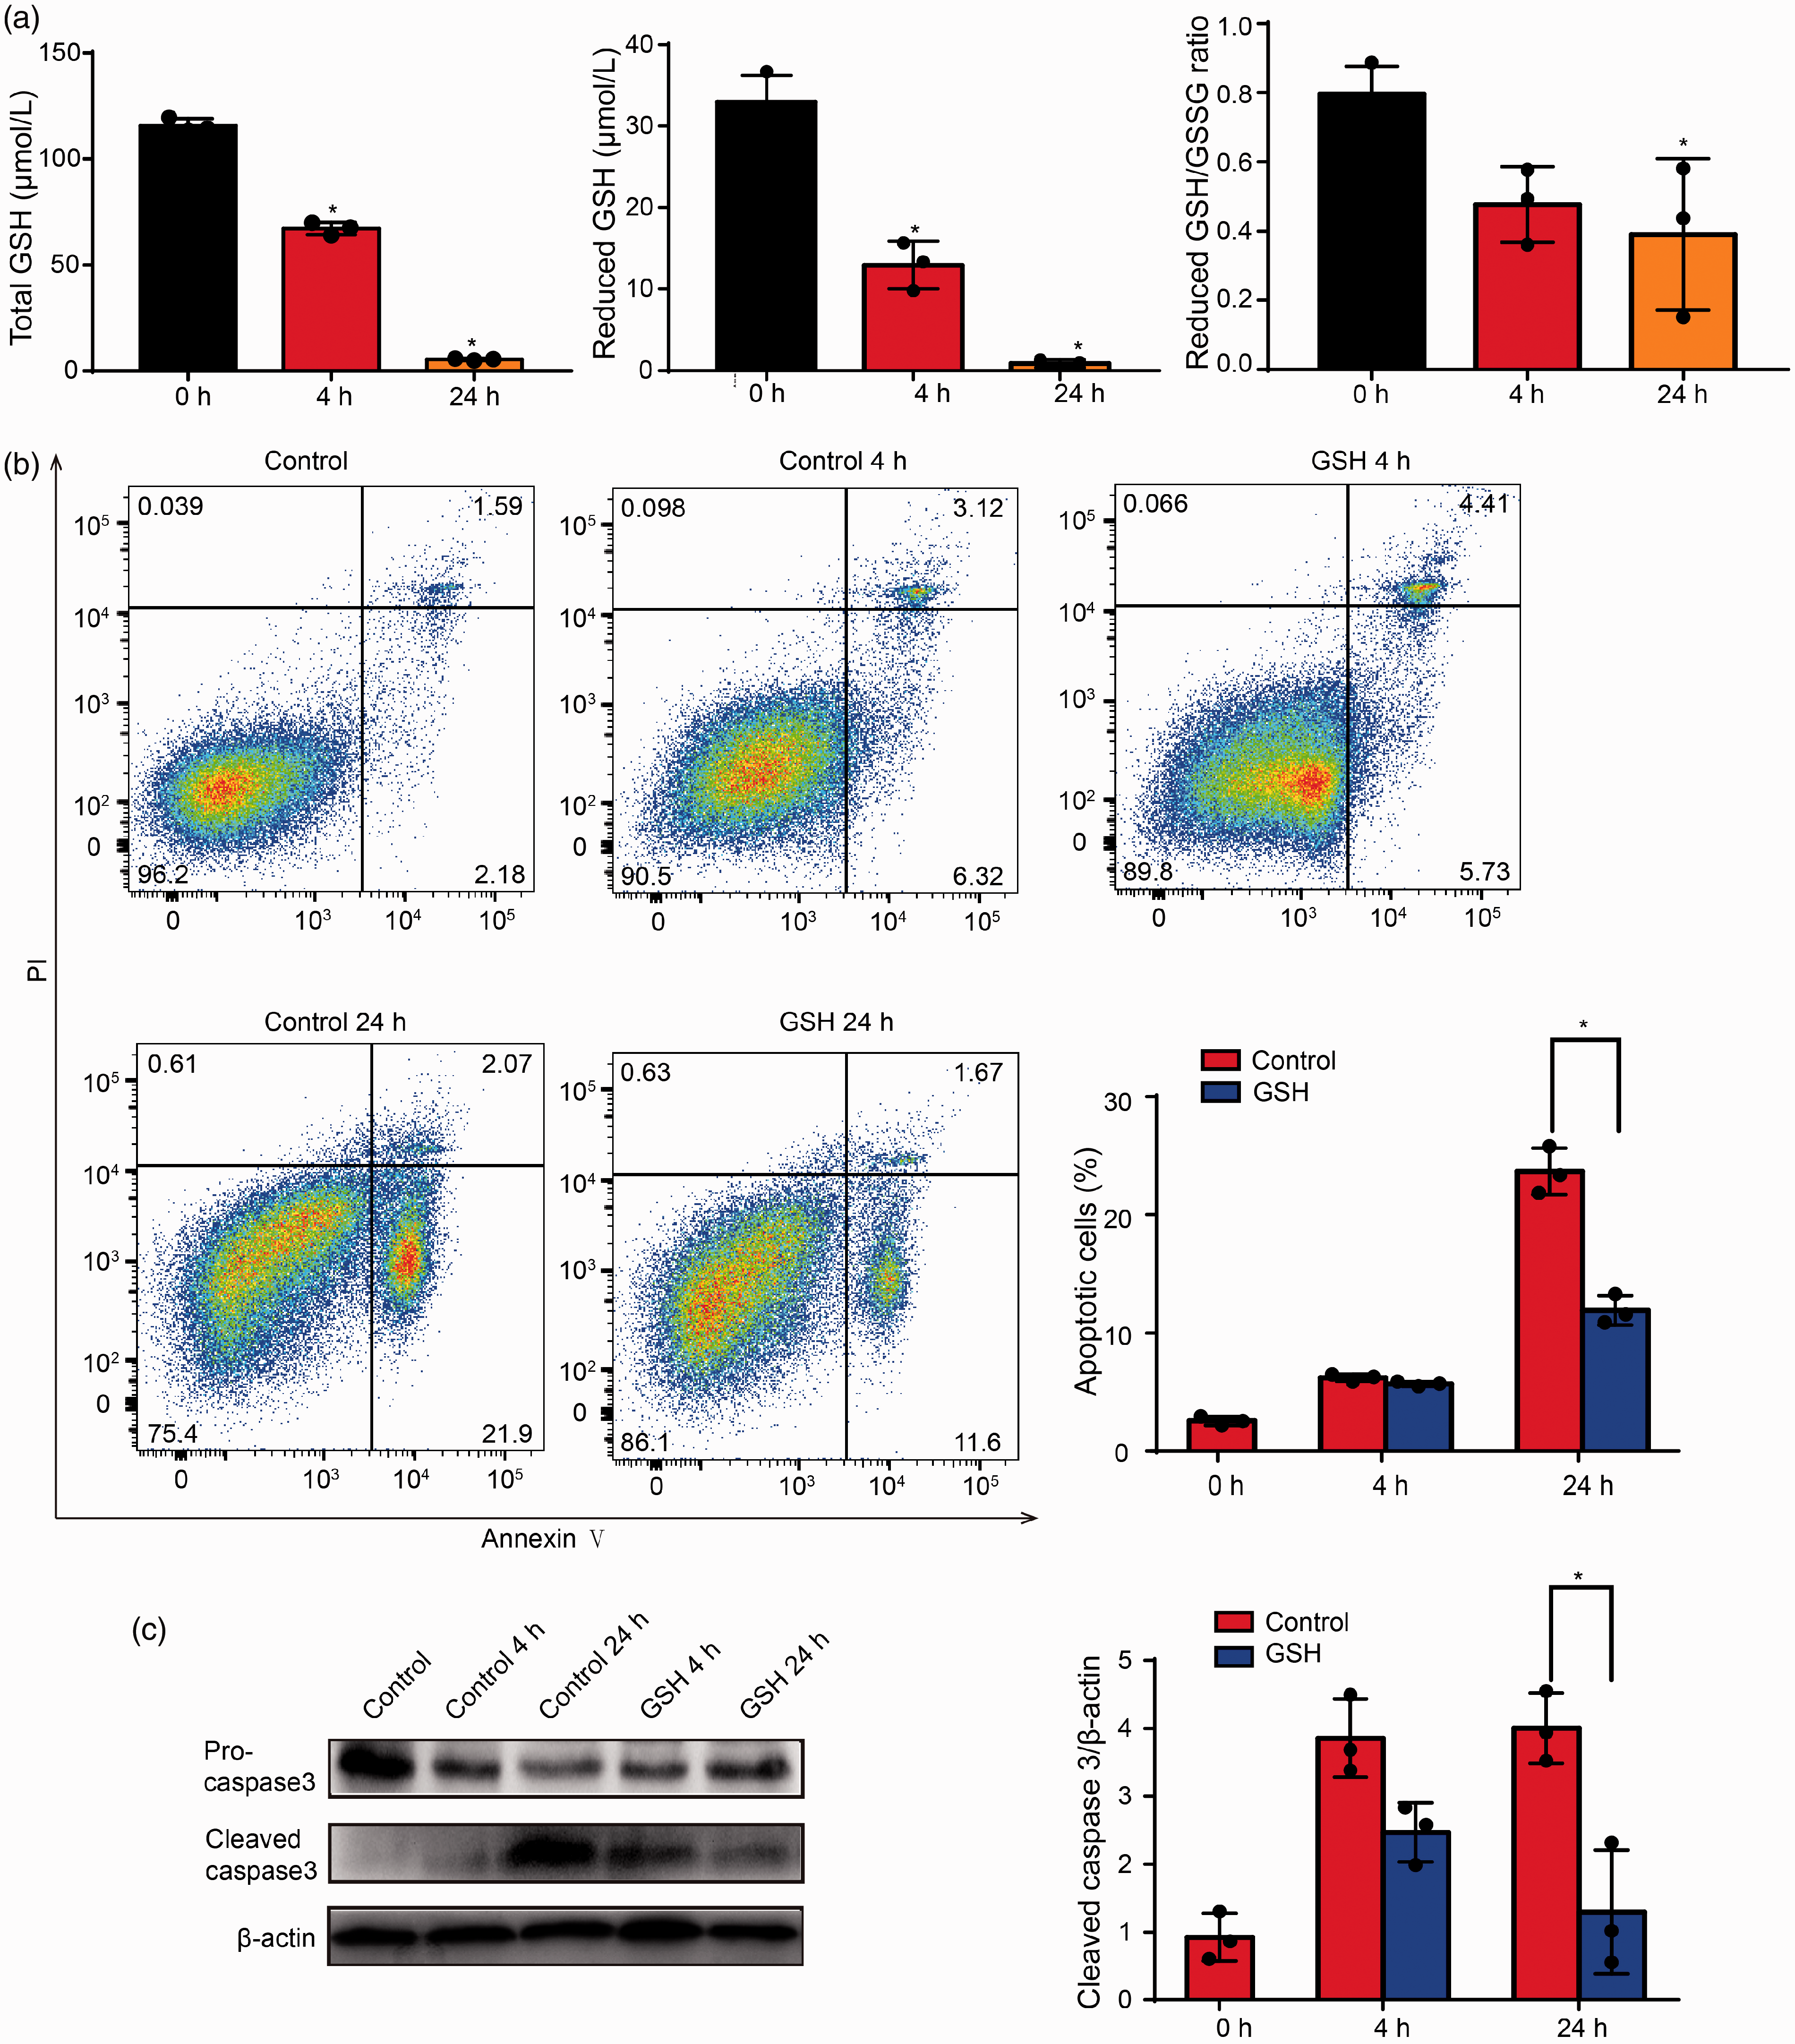
Glutathione (GSH) depletion induced neutrophil spontaneous apoptosis. Glutathione Oxidized (GSSG) (a) Neutrophils were cultured for 4–24 h, then analyzed for total GSH levels, reduced GSH levels, and reduced GSH/GSSG ratio; results are presented as the means ± SD of three independent experiments; *P < 0.05 versus the Control group. Black column: neutrophils were cultured for 0 h; red column: neutrophils were cultured for 4 h. Orange column: neutrophils were cultured for 24 h. (b) Neutrophils were cultured with or without GSH for 4–24 h, then stained with Annexin V-FITC/propidium iodide (PI). The percentage of apoptotic cells was analyzed by flow cytometry. (c) Neutrophils were cultured with or without GSH for 4–24 h, then western blotting was performed to analyze the levels of apoptosis-related proteins; β-actin was used as a loading control. Data represent means ± SD, n = 3; *P < 0.05 versus the corresponding control group.
Alleviation of neutrophil apoptosis by LPS
The levels of reduced and total GSH and the reduced/oxidized GSH ratio were increased in the LPS 4 h group compared with the Control 4 h group. This result indicated that LPS stimulation delayed cell death and may be associated with reducing GSH depletion. Furthermore, the LPS 4 h group showed a significantly decreased percentage of apoptotic cells and levels of cleaved caspase-3 (Figure 4).
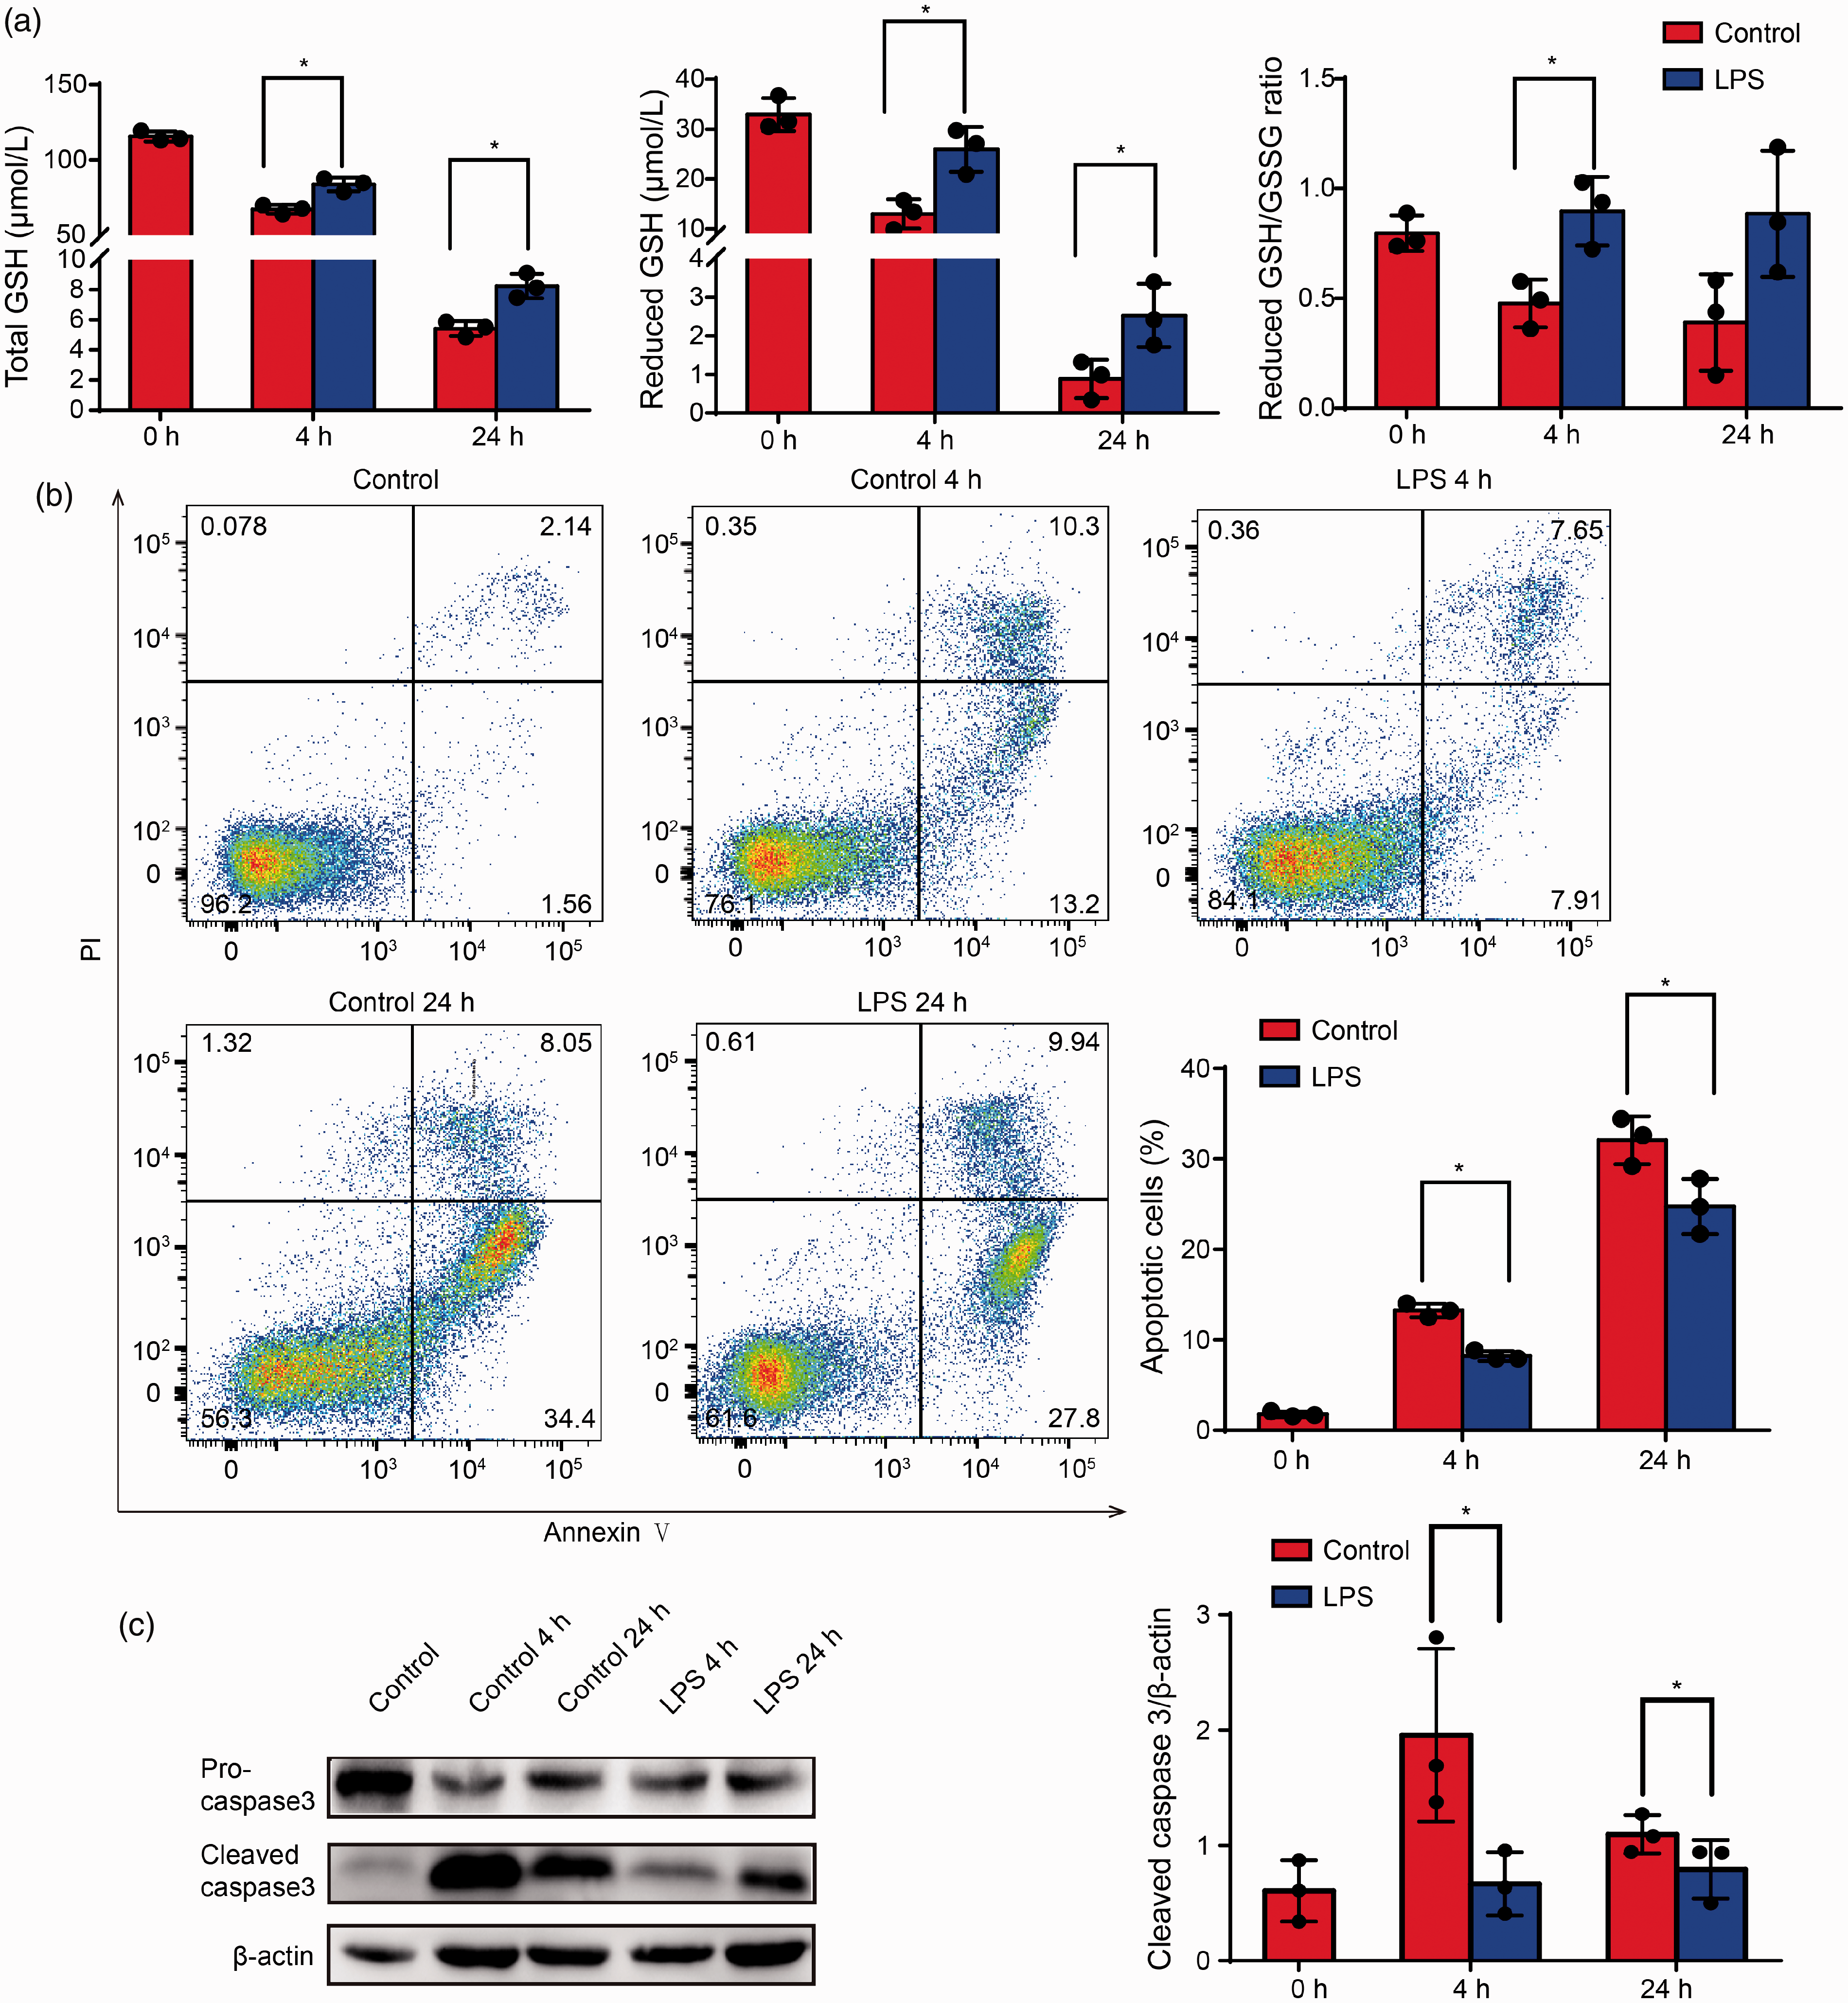
LPS protected against glutathione (GSH) depletion-induced spontaneous neutrophil apoptosis. (a) Neutrophils were treated with LPS for 4–24 h, then analyzed for total GSH levels, reduced GSH levels, and reduced GSH/GSSG ratio; results are presented as the means ± SD of three independent experiments; *P < 0.05 versus the control group. (b) Neutrophils were stained with Annexin V-FITC/propidium iodide (PI), and the percentage of apoptotic cells was analyzed by flow cytometry. (c) Western blotting was performed to analyze the levels of apoptosis-related proteins; β-actin was used as a loading control. Data represent means ± SD, n = 3; *P < 0.05 versus corresponding control group.
Reduced ATP levels triggered GSH degradation in apoptotic neutrophils
To understand why GSH was depleted, we next determined the expression of genes participating in GSH biosynthesis and degradation in apoptotic neutrophils. GSH biosynthesis is catalyzed by two ATP-dependent enzymes: glutamate-cysteine ligase (GCL) and glutathione synthase (GS). Meanwhile, three enzymes, γ-glutamyltransferase (GGT), 5-oxoprolinase (OPLAH), and γ-glutamylcyclotransferase (GGCT), participated in GSH degradation. These five genes along with glutathione reductase form a cycle called γ‐glutamyl to maintain GSH homeostasis (Figure 5a). 27 As shown in our results (Figure 5b and c), the expression of OPLAH, GGCT, and ChaC1, which is a member of the GGCT family and participated in GSH degradation, 28 were all enhanced. At the same time, the decrease in the ATP content of apoptotic neutrophils suggested the activity of GSH biosynthesis may be attenuated even if GCL and GS were up-regulated (Figure 5d).
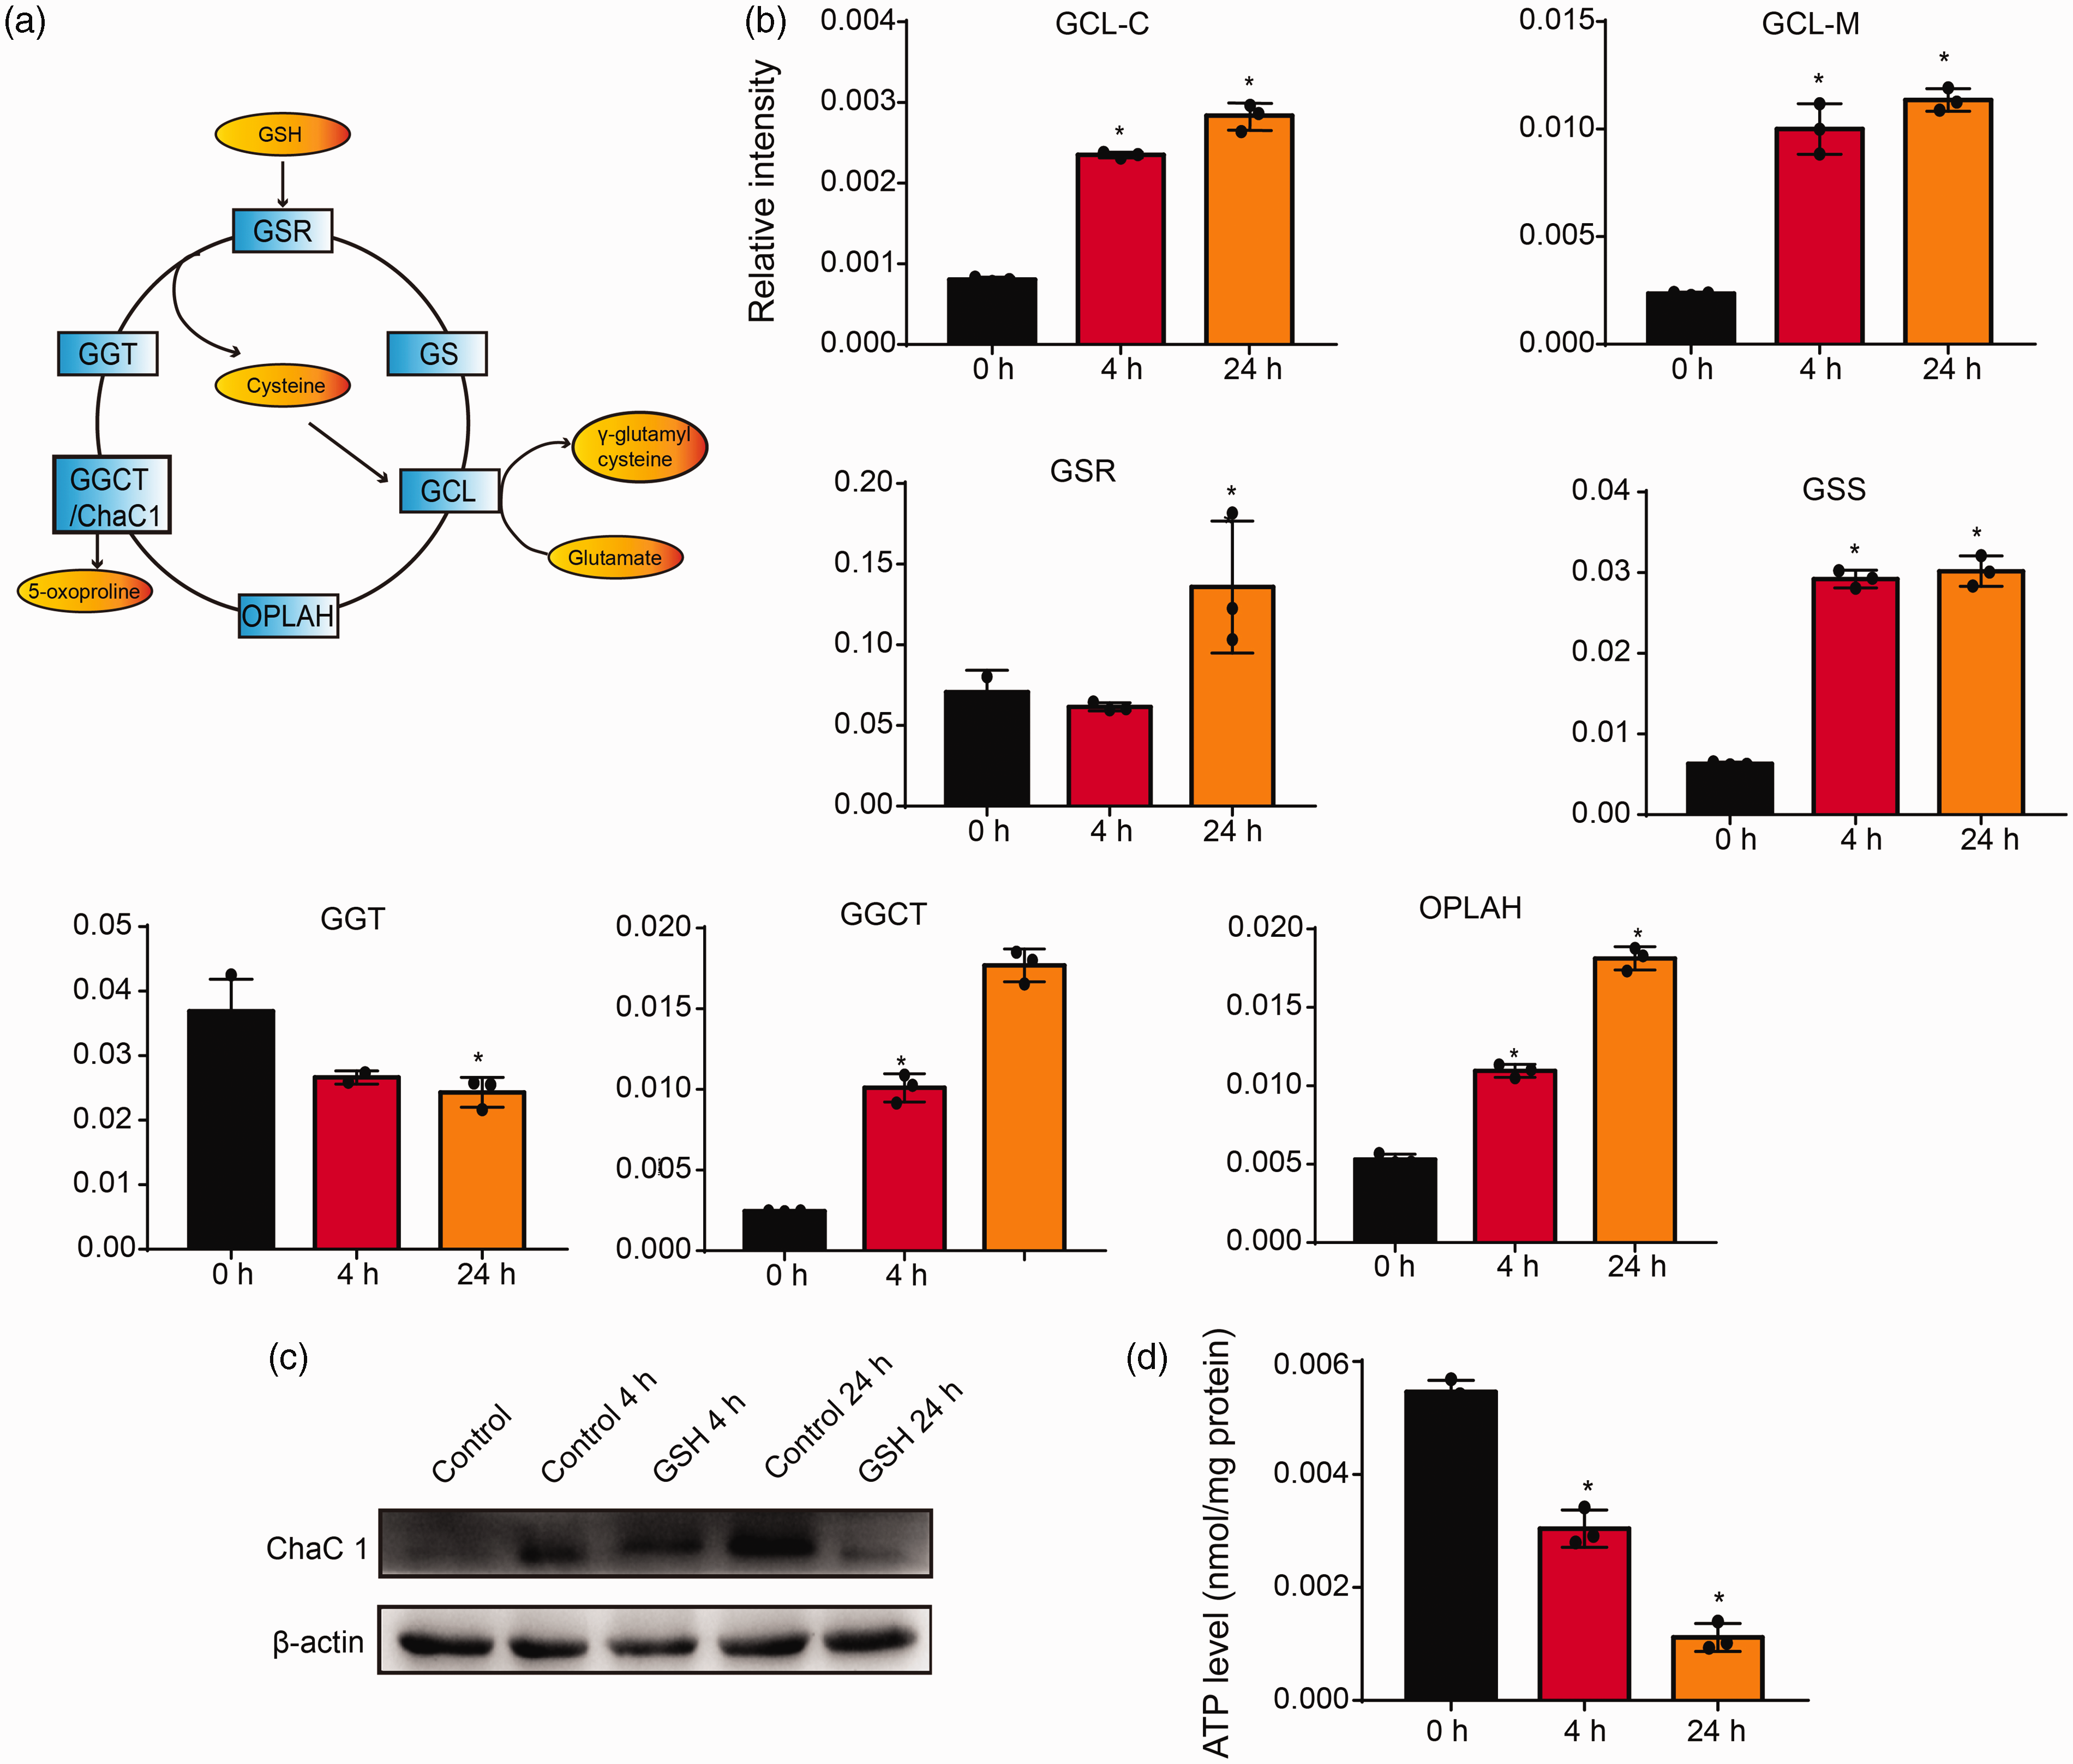
Glutathione (GSH) degradation developed in apoptotic neutrophils. (a) The γ-glutamyl cycle. (b) qPCR was performed to analyze the mRNA expression of γ-glutamyl cycle-related enzymes. Results are presented as the means ± SD of three independent experiments. *P < 0.05 versus control group. (c) Western blotting was performed to analyze the levels of ChaC1; β-actin was used as a loading control. (d) ATP levels of apoptotic neutrophils. Results are presented as the means ± SD of three independent experiments. *P < 0.05 versus the control group.
Discussion
We used HILIC UHPLC-Q-TOF MS to comprehensively investigate the metabolome of neutrophils undergoing spontaneous apoptosis and found that GSH metabolism plays an important role in this process and GSH depletion may be associated with the apoptosis of neutrophils.
In this study, some metabolites, such as citraconic acid,
Our metabolomics data also showed that linoleic acid metabolism,
Among the metabolites that were altered, GSH metabolism was particularly interesting. GSH is a thiol-containing tripeptide consisting of
GSH maintains its homeostasis by regulating various GSH activities, including biosynthesis, transport and efflux, peroxidation and reduction, consumption, and degradation. 33 The process of GSH biosynthesis and degradation form the so-called γ-glutamyl cycle. It consists of six key enzymes. 27 According to our results, the expression of two GSH biosynthesis enzymes including GCL and GS was elevated. It is contrary to our results that GSH is depleted. Considering these two enzymes are ATP dependent, we detected ATP levels in apoptotic neutrophils. We found that ATP content is diminished during apoptosis. Previous studies also confirmed that ATP could delay neutrophil apoptosis in a concentration-dependent manner. 34 According to this, we hypothesize that a lack of ATP inhibited the activities of GCL and GS activities then led to the down-regulation of GSH biosynthesis.
GSH degradation is catalyzed by GGT, GGCT, and OPLAH. ChaC1, which is a member of the GGCT family, acts to hydrolyze GSH to produce 5-oxoproline and the corresponding amino acids. It is a proapoptotic ER (endoplasmic reticulum) stress protein downstream of ATF4-ATF3-CHOP pathway, which appears to be important for human physiology and disease. 35 Here we demonstrate that the expression of GSH degradation enzymes including GGCT and OPLAH were elevated, as well as the up-regulation of ChaC1. It is consistent with the metabolomic analysis, which showed the elevation of 5-oxoproline and glutamate. Thus, our results suggested the inhibition of GSH biosynthesis and promotion of degradation may lead to GSH depletion, which finally induced neutrophil apoptosis. Future work should elucidate this pathway and may emphasize the importance of ChaC1 on health and disease.
In conclusion, we conducted a global metabolomics analysis of apoptotic neutrophils and found GSH levels were decreased in apoptotic neutrophils. Our data raise new questions such as how does GSH regulate the spontaneous apoptosis of neutrophils. Our findings will also help to identify potential biomarkers for the diagnosis and targets of neutrophil-mediated inflammatory diseases and open new avenues for metabolism-based regulation of neutrophil function.
Supplemental Material
sj-pdf-1-ini-10.1177_1753425920951985 - Supplemental material for Metabolomic analysis of spontaneous neutrophil apoptosis reveals the potential involvement of glutathione depletion
Supplemental material, sj-pdf-1-ini-10.1177_1753425920951985 for Metabolomic analysis of spontaneous neutrophil apoptosis reveals the potential involvement of glutathione depletion by Xiong Yuyun, Yu Fan, Wei Weiping, Yin Qing and Sun Bingwei in Innate Immunity
Footnotes
Declaration of conflicting interests
The author(s) declared no potential conflicts of interest with respect to the research, authorship, and/or publication of this article.
Funding
The author(s) disclosed receipt of the following financial support for the research, authorship, and/or publication of this article: This work was supported by Jiangsu Provincial Medical Youth Talent (QNRC2016828).
Supplemental material
Supplemental material for this article is available online.
References
Supplementary Material
Please find the following supplemental material available below.
For Open Access articles published under a Creative Commons License, all supplemental material carries the same license as the article it is associated with.
For non-Open Access articles published, all supplemental material carries a non-exclusive license, and permission requests for re-use of supplemental material or any part of supplemental material shall be sent directly to the copyright owner as specified in the copyright notice associated with the article.