
Abstract
Here we report that LPS induces osteoclast (OC) formation in murine RAW 264.7 macrophage cells in RPMI-1640 medium but not in α-minimum essential medium (α-MEM) as the original culture medium. LPS-induced OC formation in both media was examined to clarify the differential response. Receptor activator of NF-κB ligand induced OC formation in either α-MEM or RPMI-1640 medium. However, LPS-induced OC formation in RAW 264.7 cells maintained in RPMI-1640 medium, but not α-MEM, which was also supported by mouse bone marrow-derived macrophages, although they were less sensitive to LPS than RAW 264.7 cells. LPS augmented the expression of nuclear factor of activated T-cells (NFATc1) as a key transcription factor of osteoclastogenesis in cells maintained in RPMI-1640 medium, but reduced it in cells maintained in α-MEM. A high concentration of LPS was cytotoxic against cells maintained in α-MEM. Glutathione exclusively present in RPMI-1640 medium prevented LPS-induced cell death in α-MEM and augmented LPS-induced NFATc1 expression, followed by enhanced LPS-induced OC formation. LPS induced higher generation of reactive oxygen species in α-MEM than RPMI-1640 medium. An antioxidant enhanced LPS-induced OC formation, whereas a pro-oxidant reduced it. Taken together, redox balance in the culture condition was suggested to regulate in vitro LPS-induced OC formation.
Introduction
Osteoclasts (OCs) capable of bone resorbing are multinucleated cells that form by fusion of bone marrow-derived mononuclear precursors.1,2 OCs have a unique morphology and function to resorb calcified bone by creating resorption pits (Howship’s lacunae). 3 In vitro OC formation from mononuclear precursors is induced by two essential factors: receptor activator of NF-κB ligand (RANKL) and macrophage colony-stimulating factor (M-CSF).4,5 Although RANKL has been considered to be a key regulator of osteoclastogenesis, LPS induces OC formation independently of RANKL activity.6,7 RANK and TLR4, the respective receptors for RANKL and LPS, share common downstream signaling molecules.6,8 Moreover, LPS augments RANKL-induced osteoclastogenesis and enhances OC survival.9,10
During characterization of in vitro LPS-induced OC formation using RAW 264.7 macrophage cells, we incidentally found that the culture medium for maintenance of RAW 264.7 cells affected LPS-induced OC formation. Cells maintained in α-MEM were unable to differentiate into OCs in response to LPS, whereas those maintained in RPMI-1640 medium were able to differentiate into OCs under LPS stimulation. In this study we examined how the difference between α-MEM and RPMI-1640 medium affected LPS-induced OC formation in RAW 264.7 cells. We found that glutathione (GSH) exclusively contained in RPMI-1640 medium played an important role in LPS-induced OC formation. Here we report that redox balance regulates in vitro LPS-induced OC formation in RAW 264.7 cells and bone marrow-derived macrophages (BMDM).
Materials and methods
Reagents
LPS from Escherichia coli O55:B5, reduced GSH, N-acetyl cysteine (NAC) and buthionine sulfoximine (BSO) were obtained from Sigma Chemicals (St Louis, MO, USA). RANKL (catalog no. 315-11, lot no. 0510233-1) and mouse M-CSF were purchased from PeproTech (Rocky Hill, NJ, USA). Abs to whole p65 NF-κB, c-Jun, c-Fos and rabbit IgG were purchased from Cell Signaling Technology (Beverly, MA, USA). Abs to Lamin-C and whole NFATc1 were purchased from Santa Cruz Biotechnology (Santa Cruz, CA, USA).
Cell culture
The murine macrophage cell line, RAW 264.7, was obtained from Riken Cell Bank (Tsukuba, Japan) and maintained in α-MEM containing 5% heat inactivated FCS (Gibco-Invitrogen, Carlsbad, CA, USA), antibiotics, antimycotics and non-essential amino acid (Invitrogen, Carlsbad, CA, USA) at 37℃ under 5% CO2. To prepare cells maintained in RPMI-1640 medium, a quarter of α-MEM was replaced by RPMI-1640 medium (Gibco-Invitrogen) containing 5% heat inactivated FCS, antibiotics and antimycotics every 2 d, and the replacement was carried out for at least 7 d before use. Bone marrow cells were obtained by flushing the femurs of male C57BL/B6 mice (Japan SLC, Hamamatsu, Japan) with saline. Bone marrow cells were cultured on Nunc 90-mm culture dishes (Thermo Scientific, Rockford, IL, USA) with 10 ml of DMEM containing 10% heat inactivated FCS and murine M-CSF (20 ng/ml) for 1 d. The non-adherent cell population was recovered and further cultured with M-CSF for 2 d. The cell population was used as BMDM for osteoclastogenesis.
OC formation
Osteoclastogenesis was carried out as described previously. 11 Briefly, RAW 264.7 cells were cultured in flat, solid bottom, 96-well microplates (Falcon catalog no. 53072) at 5000 cells/250 µl/well and were allowed to adhere overnight (24 h). The cells were cultured with fresh medium containing LPS (100 ng/ml) or RANKL (100 ng/ml). Two d after stimulation, the culture medium was replaced with new medium containing LPS or RANKL. Cells were stained with a tartrate-resistant acid phosphatase (TRAP) staining kit at d 5. BMDM were plated at 10,000 cells/250 µl/well in a 96-well plate and cultured with M-CSF and LPS for 6 d, with culture medium exchange every 3 d. OC cells were counted per well under a phase-contrast microscopy. TRAP-positive multinuclear giant cell was identified as OC. The images were taken with a digital camera attached to the microscope.
TRAP staining
A TRAP staining kit was obtained from Primary Cell (Sapporo, Japan). TRAP staining was carried out according to the manufacturer’s instructions, as described elsewhere. 12 Briefly, the cells were washed with saline (100 µl) very carefully and fixed with fixation buffer (50 µl) for 5 min. After washing with distilled water (200 µl) three times, cells were stained with a dye solution (50 µl) for 40–60 min at 37℃. The dye was washed out and distilled water was added into wells.
Cell viability
RAW 264.7 cells were incubated with LPS (100 ng/ml) and the cell viability was determined 3 or 5 d after LPS stimulation with MTT activity using 3-(4,5-dimethyl-2-thiazolyl)-2,5-diphenyl-2H-tetrazolium bromide (Dojindo, Kumamoto, Japan), according to the manufacturer’s instructions. OD at 570 nm was determined with a microplate reader.
Laser flow cytometry
RAW 264.7 cells were incubated with phycoerythrin (PE)-conjugated Ab to TLR4 or an isotype-matched irrelevant Ab (eBiosciences, San Diego, CA, USA), or FITC-conjugated Ab to F4/80 or an isotype-matched irrelevant Ab (Biolegend, San Diego, CA, USA) for 30 min. The cell surface expression of TLR4 and F4/80 was analyzed by a flow cytometer (BD FACS CantoII, San Jose, CA, USA) and the fluorescence intensity is shown in a log scale. Apoptotic cells were determined with a FITC-conjugated annexin V apoptosis kit (Invitrogen) by a flowcytometer, and the fluorescence intensity is shown in a log scale.
Immunoblotting
Immunoblotting was performed as described previously. 13 Briefly, cells were cultured with or without LPS for the indicated time and then lysed in lysis buffer. Nuclear proteins were isolated by a nuclear extract kit (Active Motif, Carlsbad, CA, USA). Protein concentrations were measured using a bicinchoninic acid protein assay kit, including compatibility reagent (Pierce, Rockford, IL, USA). Equal amounts of protein (20 µg) diluted using 4 × sample buffer and boiled for 5 min were analyzed by SDS-PAGE (Tefco, Tokyo, Japan) electrophoresis under reducing conditions and separated proteins were transferred to membranes (Durapore; Merck Millipore, Billerica, MA, USA) by electroblotting. After blocking with 5% skimmed milk in PBS for 1 h, membranes were treated with appropriately diluted Abs. Resulting immune complexes were reacted with HRP-conjugated goat anti-rabbit IgG second Ab at a 1:2000 dilution. Finally, labeled Ag bands were detected with a chemiluminescence reagent, supersignal west dura (Pierce) and analyzed using an AE6955 light capture system with a CS analyzer (Atto, Tokyo, Japan). For re-probing, the membranes were stripped with the restore immunoblot striping buffer (Thermo Scientific) for 20 min, blocked with 5% skim milk for 1 h after washing and then treated with corresponding Abs. Prestained protein markers from BioDynamics Laboratory (Tokyo, Japan) were used to estimate molecular mass.
Determination of intracellular reactive oxygen species generation
Intracellular reactive oxygen species (ROS) generation was determined using oxidation of the fluorescent MitoSOX red reagent detecting superoxide (Molecular Probes, Invitrogen), as previously described. 14 Briefly, RAW 264.7 cells were stimulated with or without LPS at 100 ng/ml for 1 h. The culture medium was removed and the cells were treated with 5 µM MitoSOX red reagent in the dark for 15 min. The fluorescence intensity was determined by a laser flowcytometer (BD FACS CantoII, San Jose, CA, USA).
Measurement of GSH/oxidized GSH ratio
The level of GSH was measured using a GSH assay kit, according to the manufacturer's instructions (BioVision, Mountain View, CA, USA). Briefly, cell samples were homogenized in ice cold GSH assay buffer (100 µl). The homogenate was added to a pre-chilled tube containing perchloric acid (10 µl) and vortexed for several seconds. It was kept on ice for 5 min and centrifuged for 2 min at 13,000 g, and the supernatant collected. Potassium hydroxide (20 µl) was added to 40 µl of supernatant in order to neutralize the samples. After 5 min of centrifugation at 13,000 g, the supernatant was taken for the assay. For GSH detection, the samples (10 µl) were diluted with 80 µl of assay buffer. For GSH/oxidized GSH (GSSG) detection, the samples (10 µl) were diluted with 60 µl of assay buffer, mixed with 10 µl of GSH quencher at room temperature (20℃) for 10 min and reduced with 10 µl of reducing agent. Finally, all samples were mixed with 10 µl of o-phthalaldehyde probe and agitated at room temperature for 40 min in the dark. The fluorescence intensity was measured using a microplate reader SpectraMax M5 (Molecular Devices, Sunnyvale, CA, USA) at Ex/Em of 340/450 nm. The ratio of GSH/GSSG was calculated as described elsewhere. 15
Statistical analysis
Statistical analysis was performed using the Student’s t-test and values of P < 0.01 were considered significant. All experiments were performed independently three times. Data represent the mean value of triplicates ± SD.
Results
No difference between RAW 264.7 cells maintained in α-MEM and those maintained in RPMI-1640 medium in RANKL-induced OC formation
As RAW 264.7 cells differentiate into OC by stimulation with RANKL,
16
we examined RANKL-induced OC formation using cells maintained in RPMI-1640 medium or α-MEM as the original medium for RAW 264.7 cells (Figure 1). Cells were stimulated with RANKL (100 ng/ml) for 5 d. There was no significant difference in the number of OCs appearing in the cultures with α-MEM or RPMI-1640 medium (Figure 1A). Moreover, there was no significant difference in morphological changes between OC cells appearing in α-MEM and those appearing in RPMI-1640 medium (Figure 1B).
No difference in RANKL-induced OC formation using RAW 264.7 cells between α-MEM and RPMI-1640 medium. RAW 264.7 cells maintained in α-MEM or RPMI-1640 medium were stimulated with RANKL at 100 ng/ml for 5 d. (A) The number of OCs per well was counted. (B) Morphological changes were observed under a microscope. Scale bar shows a length of 0.1 mm. A typical result of three independent experiments is shown.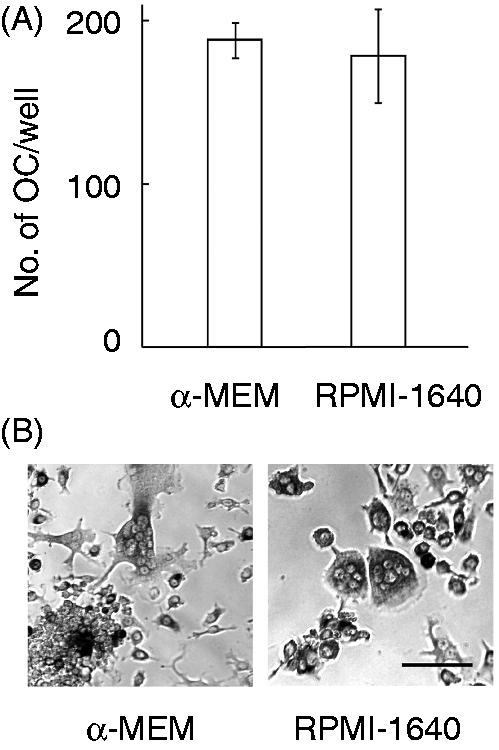
Differential response of RAW 264.7 cells and BMDM maintained in α-MEM or RPMI-1640 medium to LPS-induced OC formation
RAW 264.7 cells maintained in α-MEM or RPMI-1640 medium were used for LPS-induced OC formation. The cells were stimulated with various concentrations of LPS for 5 d (Figure 2A,B). LPS at 10 ng/ml induced OC formation in cells maintained in RPMI-1640 medium, but not α-MEM. LPS at 100 ng/ml induced a higher level of OC formation in cells maintained in RPMI-1640 medium. Morphologic studies demonstrated that multinucleated cells appeared in the culture with LPS at 10 ng/ml at d 5 and that typical multinucleated OC cells with stronger TRAP positivity appeared in the culture with LPS at 100 ng/ml (Figure 2B). However, cells maintained in α-MEM did not differentiate into OC cells in response to LPS at 10 ng/ml. There was a significant reduction in the cell number in the culture with LPS at 100 ng/ml. LPS at 100 ng/ml was used for further characterization of LPS-induced OC formation using RAW 264.7 cells. The differential response of RAW 264.7 cells to the two culture media in LPS-induced OC formation was examined using mouse BMDM as physiological macrophages (Figure 2C,D). BMDM were stimulated with LPS at 100 or 1000 ng/ml for 6 d in the presence of M-CSF at 20 ng/ml.
16
LPS at 100 ng/ml induced OC formation in BMDM maintained in both α-MEM and RPMI-1640 medium. However, LPS at 1000 ng/ml induced a higher level of OC formation in BMDM maintained in RPMI-1640 medium, but there was no OC cells in BMDM maintained in α-MEM (Figure 2C,D), suggesting a cytotoxic action of LPS at 1000 ng/ml against BMDM maintained in α-MEM. There was a significant difference in the LPS sensitivity to OC formation and cytotoxicity between BMDM and RAW 264.7 cells, and BMDM required a higher concentration of LPS than RAW 264.7 cells.
Differential response of RAW 264.7 cells and BMDM maintained in α-MEM or RPMI-1640 medium to LPS-induced OC formation. (A,B) RAW 264.7 cells maintained in α-MEM or RPMI-1640 medium were stimulated with LPS at 10 or 100 ng/ml for 5 d. (C,D) BMDM were stimulated with LPS at 100 or 1000 ng/ml in the presence of M-CSF at 20 ng/ml for 6 d with α-MEM or RPMI-1640 medium. (E) The cells were stimulated with LPS at 100 ng/ml for various days. (A,C,E) The number of OCs per well was counted. *P < 0.01 versus cells maintained in α-MEM. (B,D) Morphological changes were observed under a microscope. Scale bar shows a length of 0.1 mm. A typical result of three independent experiments is shown.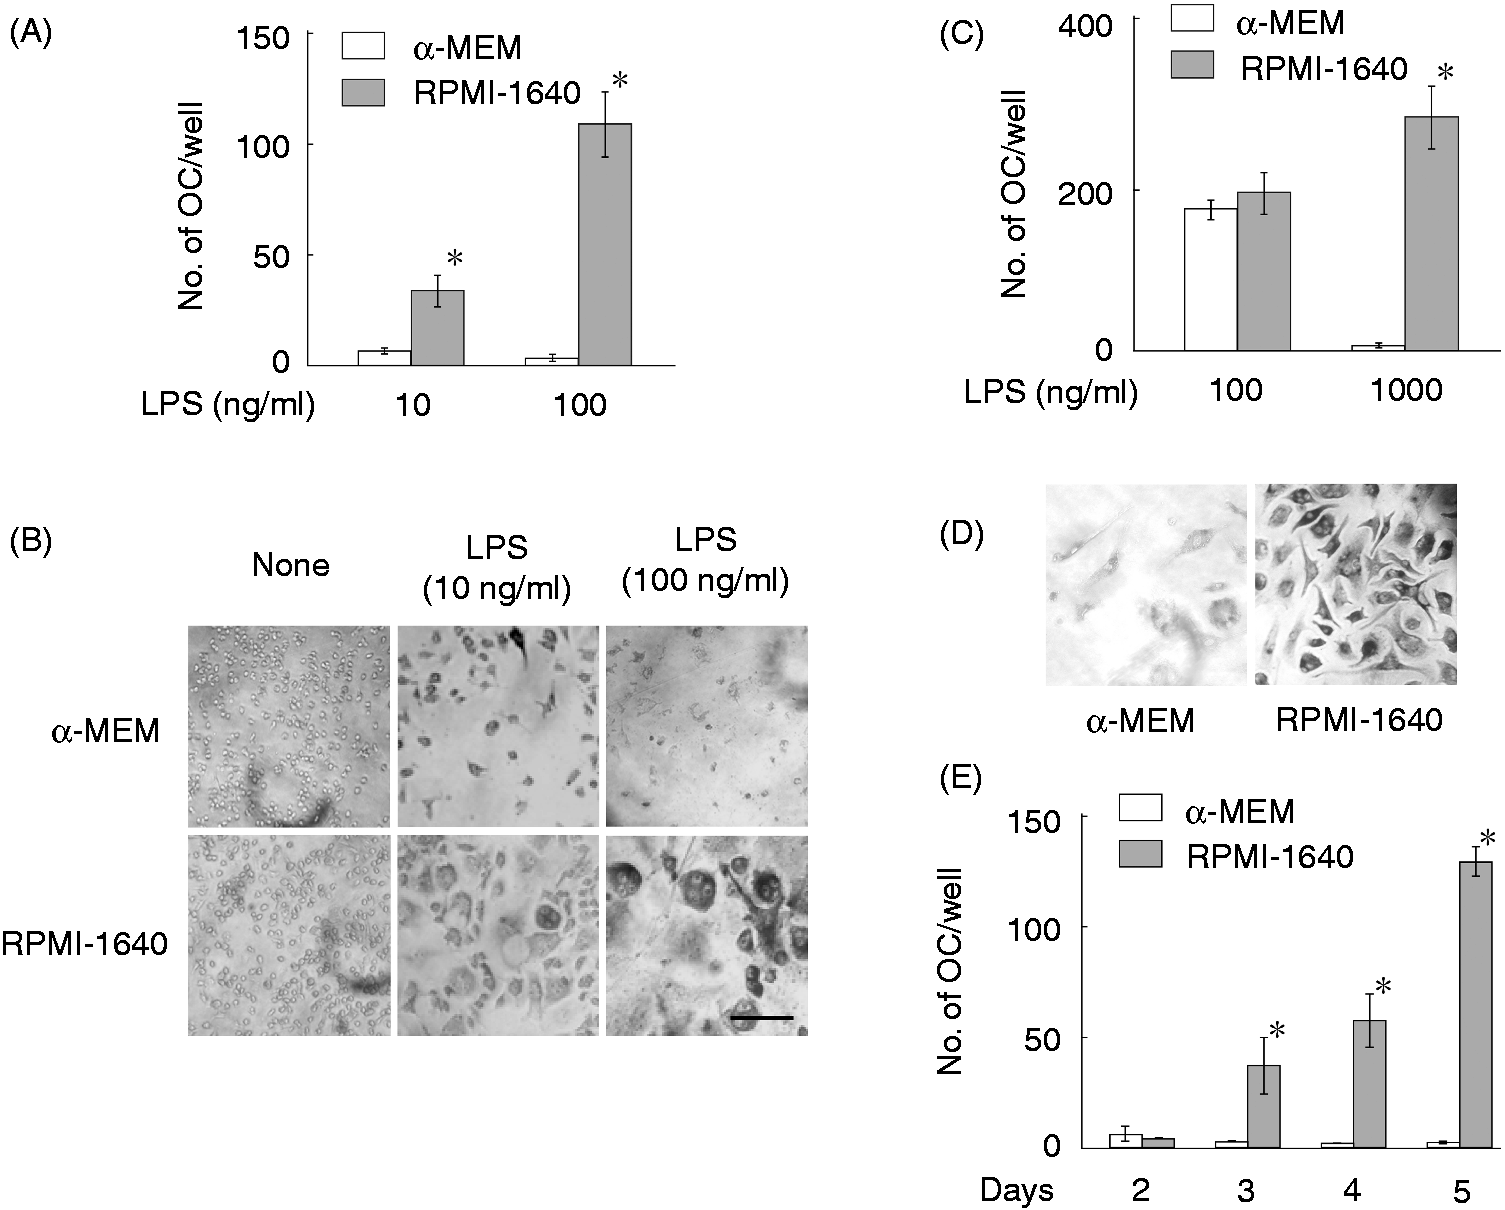
The time course of OC appearance was examined by culturing RAW 264.7 cells with LPS at 100 ng/ml for various lengths of time. Cells maintained in RPMI-1640 medium differentiated into OC cells 3 d after LPS stimulation and the OC number gradually increased up to d 5. However, the OC number did not increase in the culture with α-MEM (Figure 2D).
No difference in the expression of TLR4 as a LPS receptor and F4/80 as a macrophage maturation marker on cells maintained in α-MEM and RPMI-1640 medium
The cell surface expression of TLR4 and F4/80 on RAW 264.7 cells maintained in α-MEM and RPMI-1640 medium was compared to elucidate the differential response of those cells to LPS. Cells maintained in α-MEM or RPMI-1640 medium were stained with fluorescent anti-TLR4 or F4/80 Ab (Figure 3). Flow cytometric analysis demonstrated that there was no significant difference in the expression of TLR4 (Figure 3A) and F4/80 (Figure 3B) between cells maintained in α-MEM and RPMI-1640 medium, suggesting no significant difference in the cell surface phenotypes.
Expression of TLR4 and F4/80 on cells maintained in α-MEM or RPMI-1640 medium. RAW 264.7 cells maintained in α-MEM or RPMI-1640 medium were stained with PE and FITC-conjugated Ab to TLR4 (A) and F4/80 (B), respectively. The fluorescence intensity is expressed on a log scale. A typical result of three independent experiments is shown.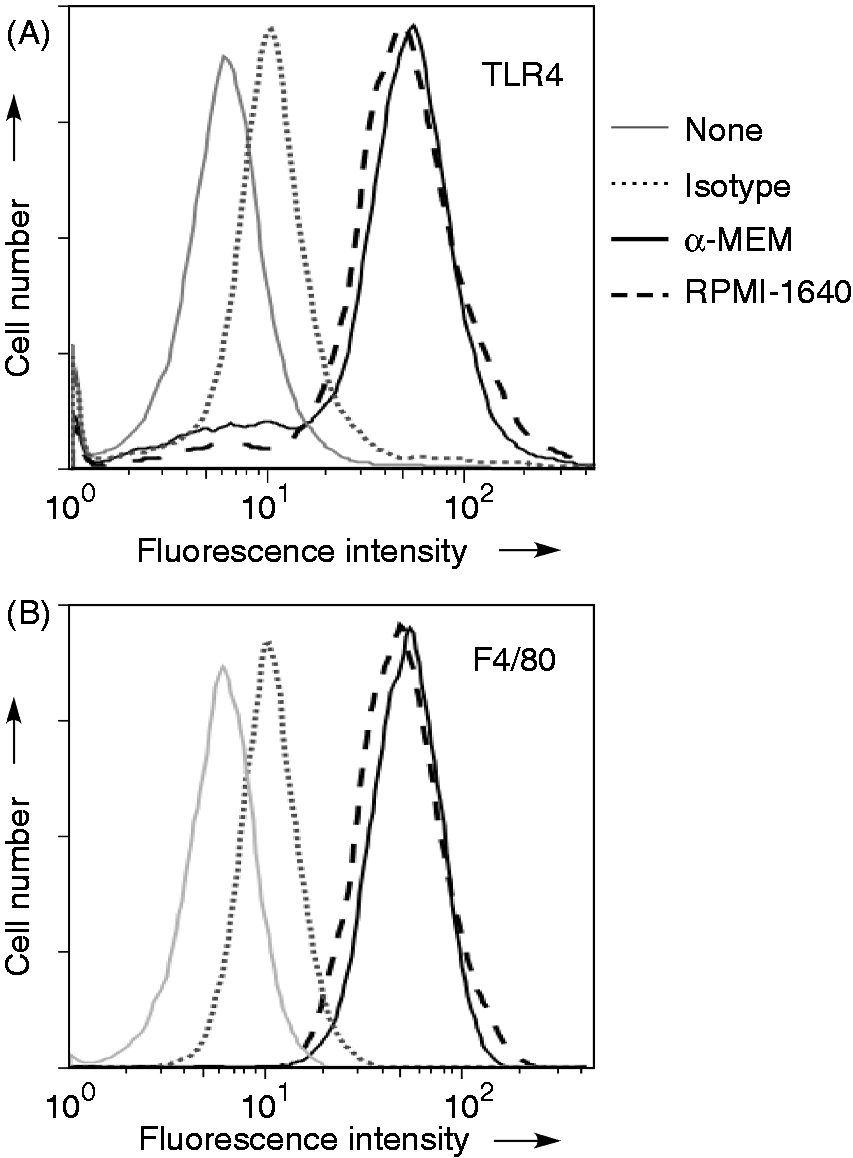
A cytotoxic action of LPS against cells maintained in α-MEM
The MTT assay was carried out to elucidate the reduction of cells maintained in α-MEM in the presence of a high concentration of LPS (Figure 4A). RAW 264.7 cells were incubated with LPS (100 ng/ml) for 3 and 5 d in the culture with α-MEM or RPMI-1640 medium. LPS markedly reduced the MTT activity in cells maintained in α-MEM, whereas it slightly reduced it in cells maintained in RPMI-1640 medium. In addition, there was no significant reduction of the MTT activity in cells treated with LPS at 10 ng/ml. Laser flow cytometric analysis demonstrated that LPS at 100 ng/ml increased the number of annexin V-positive cells in cells maintained in α-MEM, but not RPMI-1640 (Figure 4B).
A cytotoxic action of LPS against cells maintained in α-MEM. (A) RAW 264.7 cells maintained in α-MEM or RPMI-1640 medium were stimulated with or without LPS at 100 ng/ml for 3 or 5 d, and the cell viability was determined using a MTT assay. *P < 0.01 versus cells maintained in α-MEM alone. (B) RAW 264.7 cells maintained in α-MEM or RPMI-1640 medium were stimulated with LPS (100 ng/ml) for 20 h and stained with FITC-conjugated anti-annexin V Ab. The fluorescence intensity is expressed on a log scale. A typical result of three independent experiments is shown.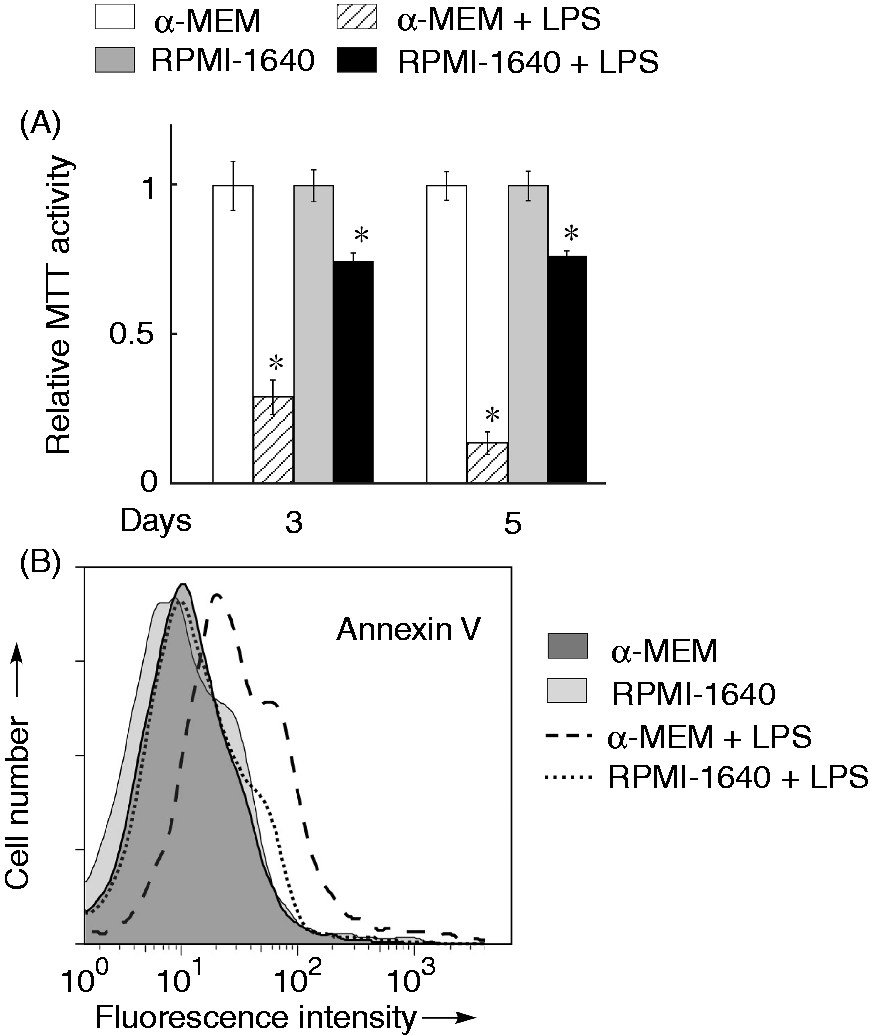
Activation of osteoclastogenesis-related transcription factors by LPS in cells maintained in α-MEM or RPMI-1640 medium
RANKL leads to the expression of NFATc1 as a key transcription factor of osteoclastogenesis via the activation of AP1 consisting of c-Fos and c-Jun,17,18 and NF-κB activation is also involved in LPS-induced OC formation.
7
Therefore, we examined nuclear translocation of p65 NF-κB, c-Fos and c-Jun 6 h after LPS or RANKL stimulation with immunoblotting using Abs detecting unphosphorylated and phospharylated forms present in the nuclear fraction (Figure 5A). LPS augmented the expression level of nuclear p65 NF-κB, c-Fos and c-Jun in α-MEM-maintained cells more than RPMI-1640 medium-maintained cells. However, there was no significant difference in the nuclear translocation of the transcription factors between cells maintained in α-MEM and RPMI-1640 medium in response to RANKL.
LPS-induced nuclear translocation of transcription factors in cells maintained in α-MEM or RPMI-1640 medium. RAW 264.7 cells maintained in α-MEM or RPMI-1640 medium were stimulated with LPS 100 ng/ml for 6 h (A) or 24 h (B). The expression of a series of signaling molecules in the nuclear fraction was analyzed with immunoblotting. An equal protein loading was confirmed with Lamin-C. A typical result of three independent experiments is shown.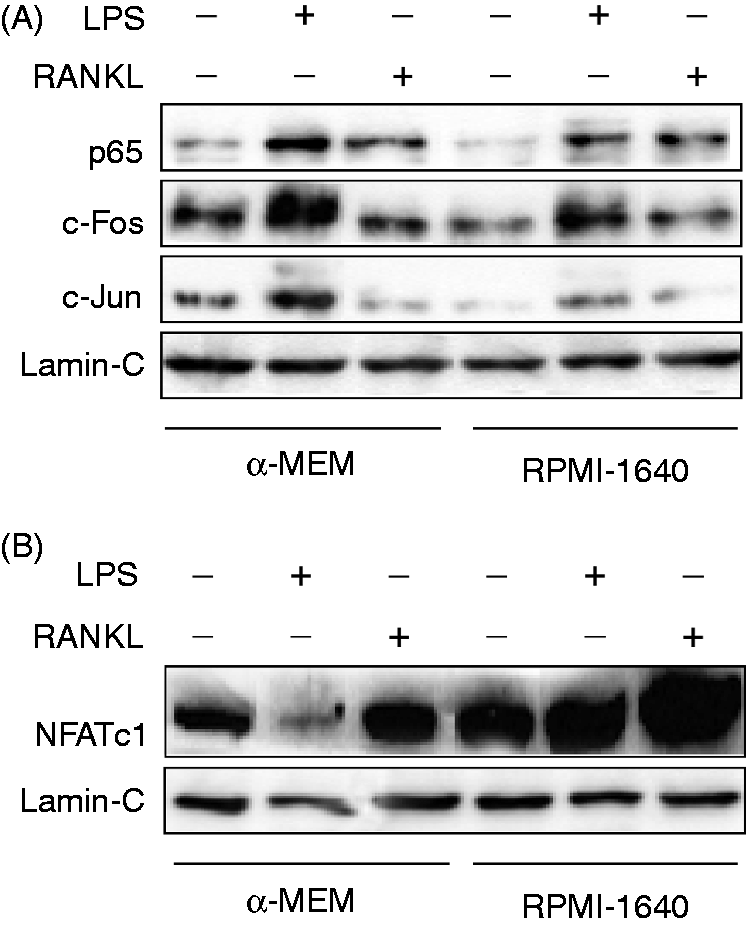
Next, the nuclear translocation of NFATc1 was compared using cells maintained in α-MEM or RPMI-1640 medium (Figure 5B). α-MEM or RPMI-1640 medium-maintained RAW 264.7 cells were cultured with LPS (100 ng/ml) or RANKL (100 ng/ml) for 24 h. Immunoblotting analysis demonstrated that the level of nuclear NFATc1 expression was augmented in cells maintained in RPMI-1640 medium in response to either LPS or RANKL. However, LPS reduced it in cells maintained in α-MEM, although RANKL increased it.
Role of GSH on LPS-induced OC formation using α-MEM or RPMI-1640 medium
GSH is contained in RPMI-1640 medium, but not α-MEM.
19
The effect of GSH on LPS-induced OC formation using α-MEM and RPMI-1640 medium was examined (Figure 6A). Cells were pretreated with or without GSH (0.3 mM) for 1 h and then stimulated with LPS. The addition of GSH enhanced LPS-induced OC formation in cells maintained in α-MEM up to the level of cells maintained in RPMI-1640 medium. GSH also slightly augmented LPS-induced OC formation in RPMI-1640 medium. The effect of GSH on LPS-induced nuclear translocation of NFATc1 in cells maintained in α-MEM or RPMI-1640 medium was examined (Figure 6B). Addition of GSH significantly enhanced the nuclear translocation of NFATc1 in cells maintained in α-MEM medium, although it did not affect the nuclear translocation in cells maintained in RPMI-1640 medium.
Role of GSH on LPS-induced OC formation using α-MEM or RPMI-1640 medium. (A) RAW 264.7 cells were stimulated with LPS (100 ng/ml) in the culture with α-MEM or RPMI-1640 in the presence or absence of GSH at 0.3 mM for 5 d. The number of OC cells was counted per well. *P < 0.01 versus cells maintained in α-MEM. (B) RAW 264.7 cells were stimulated with GSH at 0.3 mM for 24 h in the culture with α-MEM or RPMI-1640 medium. NFATc1 expression was analyzed with immunoblotting. (C) The ratio of GSH/GSSG in LPS-stimulated cells in the culture with α-MEM or RPMI-1640 medium in the presence or absence of GSH (0.3 mM). *P < 0.01 versus cells maintained in RPMI-1640 medium.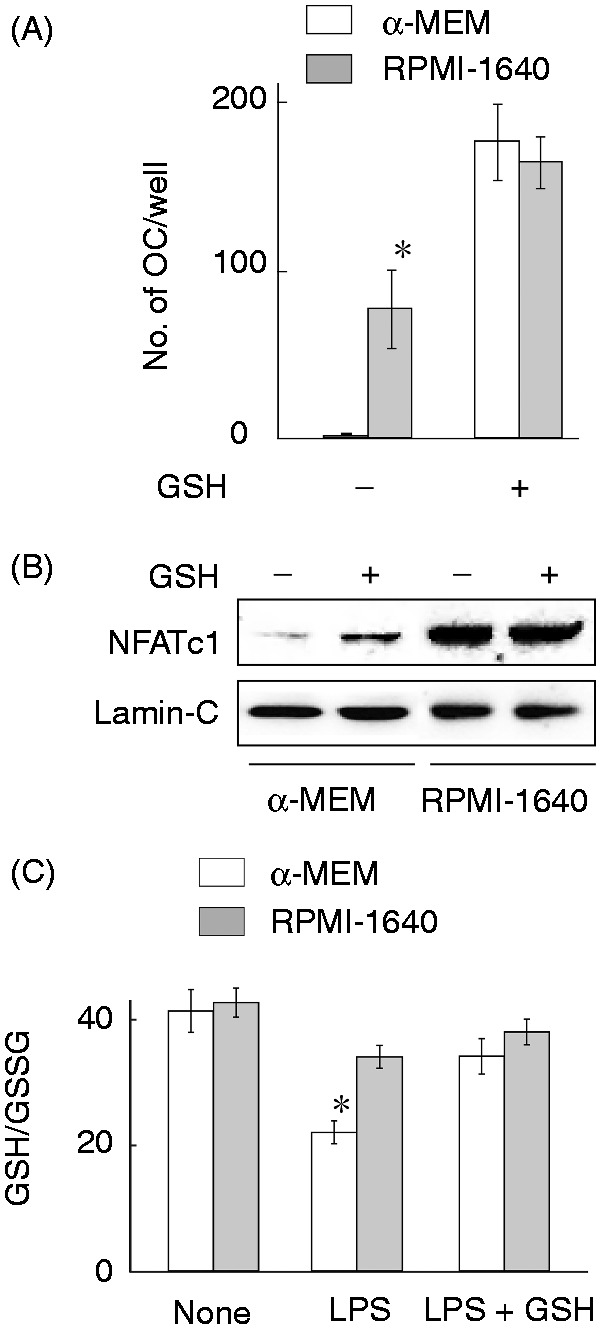
Further, we compared the ratio of GSH to oxidized GSH (GSSG) in cells maintained in α-MEM or RPMI-1640 medium in response to LPS at 100 ng/ml (Figure 6C). There was no significant difference in the GSH/GSSG ratio of untreated cells between α-MEM or RPMI-1640 medium. LPS reduced the GSH/GSSG ratio in cells maintained in α-MEM much more than that in cells maintained in RPMI-1640 medium. The addition of GSH restored the reduced GSH/GSSG ratio in α-MEM-maintained cells, suggesting that LPS caused GSH oxidation in cells maintained in α-MEM.
Involvement of ROS generation in LPS-induced OC formation with α-MEM
As GSH possessing antioxidant activity affected LPS-induced OC formation, we compared LPS-induced intracellular ROS generation in cells maintained in α-MEM or RPMI-1640 medium (Figure 7A). Cells were stimulated with LPS at 100 ng/ml for 1 h. LPS induced a higher level of ROS generation in cells maintained in α-MEM than that in cells maintained in RPMI-1640 medium. Further, the effect of NAC as an antioxidant and BSO as a pro-oxidant on LPS-induced OC formation in RPMI-1640 medium-maintained cells was examined (Figure 7B). Cells were stimulated with LPS (100 ng/ml) in the presence or absence of NAC or BSO. Antioxidant NAC (0.3 mM) enhanced LPS-induced OC formation in RPMI-1640 medium, whereas pro-oxidant BSO (0.1 mM) inhibited it.
Involvement of ROS generation in LPS-induced OC formation using α-MEM. (A) RAW 264.7 cells were stimulated with LPS at 100 ng/ml for 1 h and treated with 5 µM MitoSOX for 15 min. The ROS generation was analyzed with laser flow cytometry. The fluorescence intensity is shown in a log scale. A typical result of three independent experiments is shown. (B) RAW 264.7 cells were stimulated with LPS at 100 ng/ml for 5 d in the presence or absence of NAC (0.3 mM) or BSO (0.1 mM). The number of OC cells was counted per well. *P < 0.01 versus none.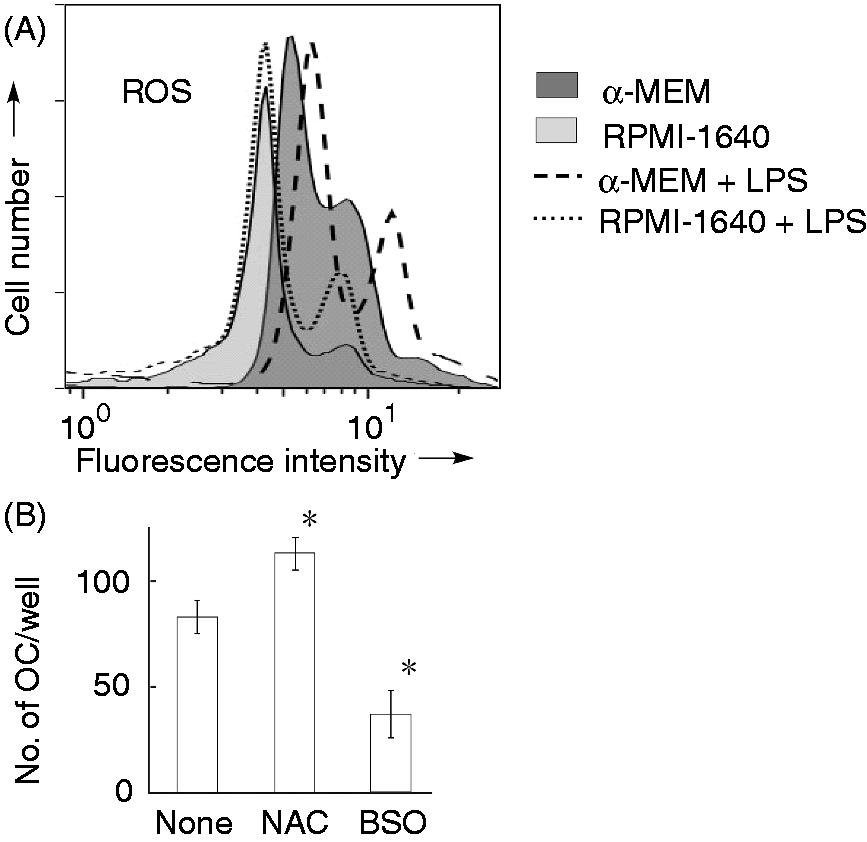
Discussion
We have demonstrated that LPS induces the OC formation in RAW 264.7 macrophage cells maintained in RPMI-1640 medium, but not α-MEM, and that redox balance in the culture condition affects LPS-induced OC formation. It is also confirmed by BMDM, as well as RAW 264.7 cells. The differential response is responsible for the ingredients contained in α-MEM and RPMI-1640 media. Antioxidant GSH, which is exclusively contained in RPMI-1640 medium, restores LPS-induced OC formation reduced in α-MEM. Further, the experimental result using antioxidant NAC and pro-oxidant BSO suggests the involvement of redox balance in LPS-induced OC formation. As RANKL induces OC formation in cells maintained in either α-MEM or RPMI-1640 medium, the redox state does not affect RANKL-induced OC formation. Thus, OC progenitors might be sensitive to redox balance and differentiate into OC only under redox-balanced microenvironments in noxious states, such as inflammation and infection.
LPS is known to augment RANKL-induced OC formation.20,21 In the absence of RANKL, LPS has been thought to be unable to induce OC formation in human or mice BMDM21–23 and RAW 264.7 cells. 24 In those studies, α-MEM containing no GSH has been used to maintain OC precursors. Recently, we have reported that RAW 264.7 cells differentiate into OC in response to LPS in the absence of RANKL in culture with RPMI-1640 medium. 7 In this study, we confirm that BMDM and RAW 264.7 cells differentiate into OCs in response to LPS in RPMI-1640 medium, but not α-MEM. RPMI-1640 medium and α-MEM have been suggested for maintaining of OC precursor cell culture and OC differentiation assay on RANKL stimulation, respectively. 25 Further, both culture media are used for the study of RANKL-induced osteoclastogenesis and of the maintenance of OC precursors.11,16 However, RPMI-1640 medium is useful for characterization of LPS-induced OC formation.
A high concentration of LPS is required for LPS-induced OC formation, but such a high concentration of LPS appears to cause cell death in cells maintained in α-MEM. RAW 264.7 cells and BMDM seem to die in response to LPS at 100 ng/ml and 1000 ng/ml, respectively, in α-MEM. The difference in the LPS sensitivity between RAW 264.7 cells and BMDM is consistent with previous reports that RAW 264.7 cells respond more highly to LPS than primary macrophages.13,26 We also demonstrate that LPS induces a higher generation of ROS in α-MEM-maintained cells than RPMI-1640 medium-maintained cells. The higher ROS generation in α-MEM may result in ROS-mediated apoptosis in response to LPS. GSH contained in RPMI-1640 medium is possible to prevent LPS-induced cell death through scavenging the high level of ROS generation. In addition, we exclude the involvement of augmented TLR4 expression and altered maturation in no OC formation of α-MEM-maintained cells. Once again, LPS induces high ROS generation in cells maintained in α-MEM and subsequently abolishes OC formation of them.
NFATc1 is known as a main transcription factor of OC-specific genes. 27 We have, for the first time, reported that NFATc1 expression is augmented by LPS stimulation in cells maintained in RPMI-1640 medium, but not α-MEM. It is consistent with our previous report that LPS-induced OC formation can be characterized by the cultivation of RAW 264.7 cell with RPMI-1640 medium. 7 Interestingly, the upstream signaling leading to NFATc1 activation, such as activation of p65 and c-Fos/c-Jun, is more strongly triggered in α-MEM than RPMI-1640 medium in response to LPS. However, it does not cause a high expression of NFATc1 in those cells, but causes the reduced expression. The strong activation of p65 and c-Fos/c-Jun reflects a cell response to a high level of ROS generation, and the reduced NFATc1 expression is a sign of ROS-mediated cell death.
The enhancing effect of GSH is reported in RANKL-induced osteoclastogenesis. 15 Antioxidants, such as GSH and ascorbic acid, enhance RANKL-induced osteoclastogenesis by scavenging of ROS.15,28,29 RPMI-1640 medium contains GSH, whereas α-MEM is GSH-free and includes lower level of GSH precursors than RPMI-1640 medium. 19 However, the present study demonstrates no difference in RANKL-induced OC formation between α-MEM and RPMI-1640 medium, suggesting no involvement of GSH in RANKL-induced OC formation. The involvement of redox state in RANKL-induced OC formation with RAW 264.7 cells must await further characterization.
Local chronic bacterial inflammatory diseases such as periodontitis, otitis and osteomyelitis are complicated with osteolysis via persistent LPS load-OC activation.9,30,31 Less ROS production is reported to cause more OC formation in a murine periodontitis model using phagocyte oxidase-deficient mice; further, the redox state is suggested to regulate LPS-induced OC formation, but not OC activation. 32 The findings are consistent with the results of this study. Thus, redox state might play an important role on pathophysiological osteoclastogenesis in chronic bacterial inflammatory diseases. Although there is a case report on endotoxic shock with osteolysis in distal limbs, 33 there is no direct evidence that acute LPS dissemination activates osteoclastogenesis. The relationship between in vitro LPS-induced OC formation and in vivo osteolysis in LPS-related diseases remains unclear.
In conclusion, LPS induces OC formation in RPMI-1640 medium, but not α-MEM. GSH exclusively contained in RPMI-1640 medium prevents a cytotoxic action of LPS against OC precursors through scavenging ROS. Redox balance may play an important role on in vitro LPS-induced OC formation.
Footnotes
Funding
This work was supported, in part, by a Grant-in-Aid for Scientific Research from the Ministry of Education, Science, Sports and Culture of Japan, and a grant of Strategic Research Foundation Grant-aided Project for Private Universities from Ministry of Education, Culture, Sports, Science, and Technology, Japan (MEXT), 2011-2015 (S1101027).
Acknowledgements
We are grateful to K. Takahashi and A. Morikawa for technical assistance.
Conflict of interest
The authors do not have any potential conflicts of interest to declare.